Abstract
Background:
Ruta angustifolia Pers. is a perennial herb that is cultivated worldwide, including Southeast Asia, for the treatment of various diseases as traditional medicine.
Objective:
The purpose of the study was to identify an active principle of R. angustifolia and to investigate its effect on the HT29 cell death.
Materials and Methods:
The methanol and fractionated extracts (hexane, chloroform, ethyl acetate, and water) of R. angustifolia Pers. were initially investigated for their cytotoxic activity against two human carcinoma cell lines (MCF7 and HT29) and a normal human colon fibroblast cell line (CCD-18Co) using sulforhodamine B cytotoxicity assay. Eight compounds including rutamarin were isolated from the active chloroform extract and evaluated for their cytotoxic activity against HT29 human colon carcinoma cell line and CCD-18Co noncancer cells. Further studies on the induction of apoptosis such as morphological examinations, biochemical analyses, cell cycle analysis, and caspase activation assay were conducted in rutamarin-treated HT29 cells.
Results:
Rutamarin exhibited remarkable cytotoxic activity against HT29 cells (IC50 value of 5.6 μM) but was not toxic to CCD-18Co cells. The morphological and biochemical hallmarks of apoptosis including activation of caspases 3, 8, and 9 were observed in rutamarin-treated HT29 cells. These may be associated with cell cycle arrest at the G0/G1 and G2/M checkpoints, which was also observed in HT29 cells.
Conclusions:
The present study describes rutamarin-induced apoptosis in the HT29 cell line for the first time and suggests that rutamarin has the potential to be developed as an anticancer agent.
SUMMARY
Rutamarin was cytotoxic to HT29 colon cancer cells but exerted no damage to normal colon cells
Rutamarin induced morphological and biochemical hallmarks of apoptosis in HT29 cells
Rutamarin induced cell cycle arrest at the G0/G1 and G2/M checkpoints in a dose-dependent manner in HT29 cells
Rutamarin activated caspases 3, 8, and 9 in a dose-dependent manner in HT29 cells.
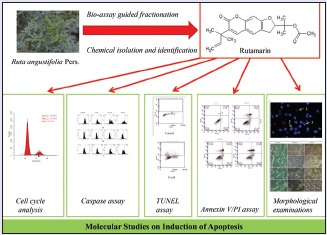
Abbreviations used: ACN: Acetonitrile, ANOVA: One-way analysis of variance, BrdU: Bromodeoxyuridine, 13C-NMR: Carbon-13 Nuclear magnetic resonance, CAD: Caspase-activated endonuclease, CCD-18Co: Human colon normal, DLD1: Human Duke's type C colorectal adenocarcinoma, DMRT: Duncan's multiple range test, DMSO: Dimethyl sulfoxide, DNA: Deoxyribonucleic acid, DR4/5: Death receptor 4/5 protein, EMEM: Eagle's minimum essential media, FBS: Fetal bovine serum, FITC Annexin V: Annexin V conjugated with fluorescein isothiocyanate, FITC-DEVD-FMK: Fluorescein isothiocyanate conjugate of caspase inhibitor Asp-Glu-Val-Asp-fluoromethyl ketone, FITC-IETD-FMK: Fluorescein isothiocyanate conjugate of caspase inhibitor Ile-Glu-Thr-Asp-fluoromethyl ketone, FITC-LEHD-FMK: Fluorescein isothiocyanate conjugate of caspase inhibitor Leu-Glu-His-Asp-fluoromethyl ketone, G0: Quiescent phase of cell cycle, G1: Gap 1 phase of cell cycle, G2: Gap 2 phase of cell cycle, GC-MS: Gas chromatography-mass spectrometry, HeLa: Human cervical adenocarcinoma, HPLC: High performance liquid chromatography, HT29: Human colon adenocarcinoma, Huh7.5: Human hepatocellular carcinoma, IC50: Half maximal inhibitory concentration, KSHV: Kaposi's sarcoma-associated herpesvirus, M phase: Mitotic phase of cell cycle, MCF7: Human breast adenocarcinoma, NMR: Nuclear magnetic resonance, PBS: Phosphate-buffered saline, PI: Propidium iodide, RNase: Ribonuclease, rt: Retention time, S phase: Synthesis phase of cell cycle, SD: Standard deviation, SRB: Sulforhodamine B, TCA: Trichloroacetic acid, TLC: Thin layer chromatography, TNF-R1: Tumor necrosis factor receptor 1 protein, TUNEL: Terminal deoxynucleotidyl transferase (TdT) dUTP nick-end labeling, UV: Ultraviolet.
Keywords: Apoptosis, cancer, cytotoxicity, in vitro, Ruta angustifolia, rutamarin
INTRODUCTION
Cancer is reported to be one of the main causes of death worldwide, and approximately 8.2 million cancer deaths and 14 million new cancer cases occurred in 2012.[1] It is the second major cause of death after myocardial infarction.[2] In Malaysia, colorectal cancer is the most commonly diagnosed cancer in the male population and the second most common cancer in the female population.[3] Hence, an effective and safe therapy for colon cancer is urgently needed. Researchers are turning to plants for possible new source of drugs as plants provide a large bank of compounds with highly varied structures which are not likely to be synthesized in the laboratory.
Ruta angustifolia Pers., locally known as “garuda,” is a native plant of the Mediterranean region and has been introduced to Southeast Asia.[4] Traditionally, the plant is commonly used as an abortifacient, anthelmintic, emmenagogue, and ophthalmic drug. Recently, the extracts of R. angustifolia were reported to exhibit antiviral activity against a hepatoma (Huh7.5) cell line.[5] This finding suggests that the R. angustifolia extracts may possess cytotoxic activity. Several components have been isolated from R. angustifolia, namely, graveoline, kokusaginine, psoralen, bergapten, arborinine, chalepin, moskachan B, moskachan D, rutamarin, and chalepensin. Rutamarin has been demonstrated to confer antiviral activity against Kaposi's sarcoma-associated herpesvirus as well as antidiabetic activity.[6,7]
In the present study, the chemical constituents for the active chloroform extract were evaluated for their cytotoxicity. Rutamarin, an active constituent of R. angustifolia, was selected for further investigations of its ability to induce apoptosis in the HT29 cells by evaluating both the morphological and biochemical characteristics of the cells.
MATERIALS AND METHODS
Chemicals
Analytical- and high-performance liquid chromatography (HPLC)-grade solvents and thin layer chromatography (TLC) plates were obtained from Merck (Germany), whereas other chemicals such as dimethyl sulfoxide (DMSO), trichloroacetic acid, cell culture media, fetal bovine serum (FBS), accutase, penicillin/streptomycin, amphotericin B, sulforhodamine B (SRB), Hoechst 33342, and propidium iodide (PI) were obtained from Sigma-Aldrich (USA). Phosphate-buffered saline (PBS) was purchased from Nacalai Tesque, Inc., (Japan).
Collection and extraction of plant material
Whole plants of R. angustifolia Pers. were purchased at Sungai Buloh, Selangor, Malaysia. The samples were authenticated by Dr. Sugumaran Manickam (a botanist), and a voucher specimen (herbarium no. KLU48128) was deposited at Rimba Ilmu, University of Malaya, Kuala Lumpur, Malaysia. The aerial parts of R. angustifolia Pers. were washed, dried, and ground to a fine powder (108.66 g). The powder of aerial parts was extracted by soaking in 90% aqueous methanol at room temperature for 72 h, yielding a methanol extract (10.63 g, 9.75%). The methanol extract (10.63 g) was then fractionated with hexane to give a hexane-soluble extract (1.64 g, 15.43%) and a hexane insoluble residue. The hexane-insoluble residue was further partitioned with chloroform-water (1:1) to give a chloroform-soluble extract (2.15 g, 20.23%). The water layer was then partitioned with ethyl acetate to give an ethyl acetate-soluble extract (0.50 g, 4.70%) and a water-soluble extract (2.34 g, 22.01%). The crude methanol and fractionated extracts (hexane, chloroform, ethyl acetate, and water) were dissolved in DMSO to form stock solutions (40 mg/ml).
Cell culture
The MCF7 (human hormone-dependent breast adenocarcinoma cell line), HT29 (human colon adenocarcinoma cell line), and CCD-18Co (normal human colon fibroblast cell line) cells were purchased from the American Type Culture Collection. The MCF7 and HT29 cells were cultured in RPMI 1640 media (Sigma-Aldrich, USA), supplemented with 10% v/v FBS, 2% v/v penicillin/streptomycin, and 1% v/v amphotericin B. The CCD-18Co cells were cultured in Eagle's minimum essential media, supplemented with 10% v/v FBS, 2% v/v penicillin/streptomycin, and 1% v/v amphotericin B. The cells were maintained in a humidified 5% CO2 atmosphere at 37°C.
In vitro cytotoxicity assay
The cells were plated at a density of 3 × 10⁴ cells/ml onto sterile 96-well flat bottom microtiter plates. The plates were incubated for 24 h to allow the cells to adhere. The media were replaced with fresh media containing extracts and isolated compounds, with the following concentrations: 1.56, 3.13, 6.25, 12.5, 25, 50, and 100 μg/ml. The cells treated with the plant extracts were incubated for 72 h in a 37°C and 5% CO2 incubator, whereas the plates treated with the isolated compounds were incubated for 48 and 72 h in a 37°C and 5% CO2 incubator. The untreated cells in 0.5% DMSO served as a negative control. The final concentration of DMSO in the test wells did not exceed 0.5% (v/v). The SRB assay was performed as described by Phang et al.[8] The absorbance at 492 nm and 620 nm was measured as background using a microplate reader (Biotek Synergy H1 Hybrid). The percentage of inhibition of each of the test samples was calculated as follows: ([Absorbancecontrol − Absorbancesample]/Absorbancecontrol) ×100. The IC50 values (concentration of the test agent that causes 50% inhibition or cell death) were determined based on the dose-dependent response curves of each extract and isolated compound. The experiments were performed in triplicate.
Isolation of the pure compounds from the chloroform extract
The plant extracts were tested for their cytotoxic effect, and based on the cytotoxicity screening, as well as yield, the chloroform extract was subjected to isolation procedure by HPLC. The analytical HPLC analysis was initially performed on an Agilent 1260 infinity HPLC system, consisting of a quaternary pump equipped with a 1260 autosampler (ALS), a 1290 thermostat, a 1260 thermostatted column compartment, a 1260 diode array detector (DAD VL+), a 1260 fraction collector (FC-AS), and Agilent OpenLAB CDS Chemstation software. The analytical analysis was performed using a binary eluent of chromatographic-grade acetonitrile (ACN) and ultrapure water under the following gradient conditions: 0–20 min of isocratic 30% ACN; 20–25 min of a linear gradient from 30% to 60% ACN; 25–35 min of a linear gradient from 60% to 100% ACN; and 35–40 min of isocratic 100% ACN at a flow rate of 1.0 ml/min. The column used here was a ZORBAX Eclipse XDB-C18 (4.6 × 250 mm, 5 μm) and the temperature was set to 30°C. The chloroform extract of R. angustifolia was filtered through activated charcoal to remove most of the chlorophyll, and the filtrate was evaporated using a rotary evaporator. The extract was then prepared to a concentration of 5 mg/ml with methanol and filtered through a membrane filter (0.45 μm, Sartorius). The sample (5.0 μL) was injected onto the column and the peaks were detected by monitoring the UV absorbance at 200 nm. Subsequently, the sample was prepared at 50 mg/ml in methanol, and then, 100 μl of the sample was injected into the Agilent Semi-Prep XDB-C18 column (9.4 × 250 mm, 5 μm) at a flow rate of 4.18 ml/min. The selected peaks in the resulting chromatogram were repeatedly collected using a fraction collector. Similar fractions from each round of separation were combined, the mobile phases were evaporated using a rotary evaporator at 40°C, and the fractions were weighed.
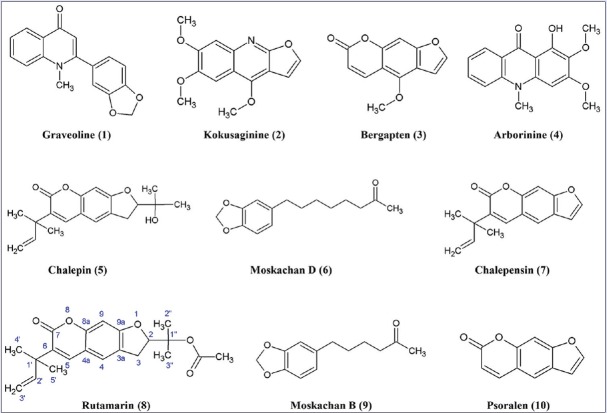
Twenty peaks were observed in the HPLC analysis of the chloroform extract, and the eluents of the peaks were collected and then pooled to give twenty fractions (A–T) [Figure 1], based on similarity of spots on TLC. Fractions that showed a single spot on TLC were subjected to analytical HPLC analysis to determine their purity. Eight compounds [Figure 2], namely graveoline (1), kokusaginine (2), bergapten (3), arborinine (4), chalepin (5), moskachan D (6), chalepensin (7), and rutamarin (8), were identified through their mass spectral and NMR data, which were consistent with published data.[9,10,11] However, only the mass spectral and NMR data for rutamarin are provided in Appendixes section. Psoralen (9) and moskachan B (10) were identified through their mass spectral data, which were consistent with published data.[9,10] Gas chromatography-mass spectrometry (GC-MS) analysis was performed using an Agilent Technologies 6980 N gas chromatograph equipped with a 5979 Mass Selective Detector (70eV direct inlet). The column used here was an HP-5 ms capillary column (5% phenylmethylsiloxane) (30.0 m × 25 mm × 25 μm), which was initially set at 100°C, then increased to 300°C at 5°C/min, and then held for 10 min using helium as the carrier gas at a flow rate of 1 ml/min. The total ion chromatogram obtained in the GC-MS was auto-integrated by ChemStation, and the components were identified by comparing them with the accompanying spectral database (Wiley, Mass Spectral Library, USA) whenever possible. Fraction A (rt = 12.609 min) gave graveoline (10.3 mg); fraction B (rt = 15.905 min) gave psoralen (2.8 mg); fraction C (rt = 16.952 min) gave kokusaginine (1.9 mg); fraction F (rt = 24.275 min) gave bergapten (2.5 mg); fraction H (rt = 26.482 min) gave arborinine (7.4 mg); fraction I (rt = 27.931 min) gave moskachan B (2.7 mg); fraction J (rt = 29.089 min) gave chalepin (48.1 mg); fraction K (rt = 30.906 min) gave moskachan D (9.4 mg); fraction L (rt = 31.528 min) gave chalepensin (8.5 mg); and fraction M (rt = 32.461 min) gave rutamarin (9.1 mg) [Figure 1]. Only compounds 1–8 were subjected to cytotoxicity screening because the amount of psoralen and moskachan B was insufficient for cytotoxicity screening, fractions D, E, and G were still in the identification stage, and fractions N-T were not pure.
Figure 1.
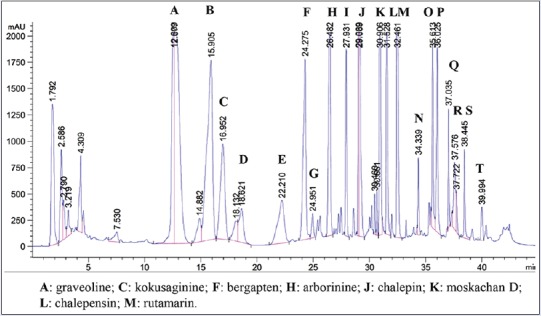
High-performance liquid chromatography chromatogram of the chloroform extract of Ruta angustifolia Pers. The chloroform extract of Ruta angustifolia Pers. was subjected to high performance liquid chromatography analysis, and twenty fractions corresponding to peaks A–T were collected and identified
Figure 2.
Structures of isolated compounds 1–10
Quantification of rutamarin by high-performance liquid chromatography
The quantification of rutamarin in both methanol and chloroform extracts of R. angustifolia Pers. was performed as described by Kumar et al.[12] with some modifications. Briefly, the isolated and purified rutamarin (1.0 mg/ml or 2.8 mM) was subjected to analytical HPLC analysis as described earlier to determine its purity. Precisely, 10.0 mg of the weighed methanol and chloroform extracts of R. angustifolia Pers. were dissolved in 10.0 ml methanol. The samples were then filtered through a membrane (0.45 μm, Sartorius). An aliquot of 10.0 μl of each sample, with or without co-elution with the purified rutamarin, was then subjected to analytical HPLC analysis as described earlier to determine the presence of rutamarin. An external standard calibration curve for rutamarin was prepared with calibration solutions ranging from 0.005 to 0.10 mg/ml (0.014–0.280 mM). The concentration curve was constructed using the average area calculated by the OpenLAB Chromatographic Data System (Agilent, USA). An aliquot of 10.0 μl of the 1.0 mg/ml methanol and chloroform extracts of R. angustifolia Pers. were injected onto the HPLC column and eluted as described earlier. The calculated concentration of rutamarin was expressed in mg/ml.
Morphological changes, as analyzed by phase contrast microscopy
The HT29 cells were cultured overnight at a density of 1 × 10⁵ cells/ml on sterile culture plates and then treated with rutamarin at concentrations of 8 μM, 14 μM, and 28 μM for 24, 48, and 72 h in a 37°C and 5% CO2 incubator. The untreated cells in 0.5% DMSO were used as a negative control. The changes in cellular morphology were observed using phase contrast microscopy at ×40 magnification (Zeiss Axio Vert. A1, Germany).
Morphological changes, as analyzed by Hoechst 33342/propidium iodide staining and fluorescence microscopy
The HT29 cells were cultured overnight at a density of 1 × 10⁵ cells/ml on sterile culture plates after which the cells were treated with rutamarin at concentrations of 8 μM, 14 μM, and 28 μM for 48 h in a 37°C and 5% CO2 incubator. The untreated cells in 0.5% DMSO were used as a negative control. The cells were harvested and washed with cold PBS after 48 h. The cells were then re-suspended in a Hoechst 33342 solution (10 μg/ml) and incubated in a 37°C and 5% CO2 incubator for 7 min. After the incubation, the cells were stained with PI (2.5 μg/ml) and incubated in the dark for 15 min at room temperature. The stained cells were placed onto a slide and allowed to dry. The nuclear morphology of the cells was examined under a Leica fluorescence microscope at ×630 magnification (DM6000B, Germany).
Detection of apoptosis by annexin V binding and flow cytometry
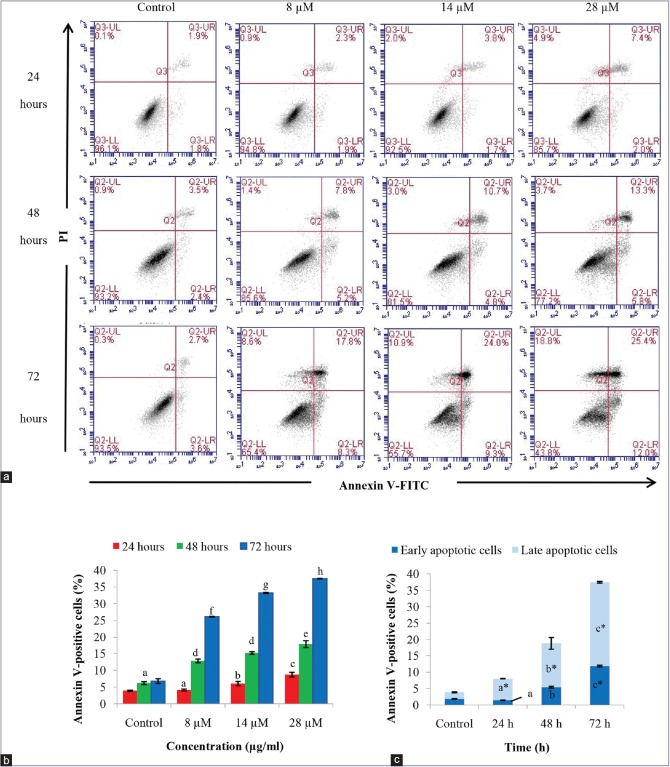
Apoptosis was detected using the FITC Annexin V Apoptosis Detection Kit (BD Biosciences, USA). The HT29 cells were cultured overnight at a density of 1 × 10⁵ cells/ml on sterile culture plates and treated with rutamarin at concentrations of 8 μM, 14 μM, and 28 μM for 24, 48, and 72 h in a 37°C and 5% CO2 incubator. The untreated cells in 0.5% DMSO were used as a negative control. The cells were harvested, washed with PBS, and double stained with annexin V and PI for 15 min at room temperature in the dark. Apoptosis was detected using an Accuri C6 flow cytometer, and the distribution of cells in different quadrants was analyzed with quadrant statistics. The lower left quadrant represents the viable cells, the lower right quadrant represents the early apoptotic cells, the upper right quadrant represents the late apoptotic/secondary necrotic cells, and the upper left quadrant represents the primary necrotic cells.
Terminal deoxynucleotidyl transferase (TdT) dUTP nick-end labeling assay by flow cytometry
DNA fragmentation was detected using the APO-BrDU Terminal deoxynucleotidyl transferase (TdT) dUTP nick-end labeling (TUNEL) Assay Kit (Invitrogen). The HT29 cells were cultured overnight at a density of 5 × 10⁵ cells/ml on sterile culture plates and treated with rutamarin at concentrations of 8 μM, 14 μM, and 28 μM for 48 h in a 37°C and 5% CO2 incubator. The untreated cells in 0.5% DMSO were used as a negative control. The cells were harvested, washed with PBS, and fixed with 1% (w/v) paraformaldehyde. Next, the cells were centrifuged, washed, and fixed with ice-cold 70% ethanol. The DNA was then labeled according to the manufacturer's instructions, and the cells were analyzed using an Accuri C6 flow cytometer.
Cell cycle analysis
The HT29 cells were cultured overnight at a density of 1 × 10⁶ cells/ml on sterile culture plates and treated with rutamarin at concentrations of 8 μM, 14 μM, and 28 μM for 72 h in a 37°C and 5% CO2 incubator. The untreated cells in 0.5% DMSO were used as a negative control. The cells were harvested, washed with PBS, and fixed in ice-cold 70% ethanol overnight at −20°C. The ethanol-fixed cells were then pelleted, washed with ice-cold PBS, and resuspended in a staining solution containing 50 μg/ml PI, 100 μg/ml RNase, 0.1% sodium citrate, and 0.1% Triton-X-100 for 30 min. Next, the cells were analyzed by flow cytometry.
Assessment of caspase 3, caspase 8, and caspase 9 activity by flow cytometry
Caspase activity was assessed using the CaspILLUME Fluorescein Active Caspase-3 Staining Kit, CaspILLUME Fluorescein Active Caspase-8 Staining Kit, and CaspILLUME Fluorescein Active Caspase-9 Staining Kit (GeneTex). The HT29 cells were cultured overnight at a density of 1 × 10⁵ cells/ml on sterile culture plates and treated with rutamarin at concentrations of 8 μM, 14 μM, and 28 μM for 72 h in a 37°C and 5% CO2 incubator. The untreated cells in 0.5% DMSO were used as a negative control. The cells were harvested, washed with PBS, and incubated with the respective CaspILLUME in situ marker, FITC-DEVD-FMK for caspase 3, FITC-IETD-FMK for caspase 8, and FITC-LEHD-FMK for caspase 9, for 45 min in a 37°C and 5% CO2 incubator. The fluorescent marker binds irreversibly to the respective activated caspase in the apoptotic cells. The cells were then centrifuged, washed, and resuspended in wash buffer according to the manufacturer's instructions, and then, the cells were analyzed using an Accuri C6 flow cytometer in the FL1 channel.
Statistical analysis
All results were presented as the means ± standard deviation from at least three independent experiments. The one-way analysis of variance/Bonferroni and Duncan's multiple range tests statistical analyses were performed using SPSS Statistics 17.0 (IBM) to determine the statistical significance between the untreated and treated groups. Results with P < 0.05 were considered statistically significant.
RESULTS AND DISCUSSION
Isolation and chemical characterization of compounds
The active chloroform extract was subjected to HPLC, as described in the experimental section. The HPLC profile of the chloroform extract is shown in Figure 1. After repeated semi-preparative HPLC analysis, ten compounds were isolated and purified. These compounds were identified using GC-MS and NMR techniques, and the mass spectral and NMR data were found to be consistent with those reported in the literature.[9,10,11,13]
The structures of the isolated compounds are illustrated in Figure 2. Graveoline (1) and kokusaginine (2) are quinolone alkaloids, whereas arborinine (4) is an acridone alkaloid. Bergapten (3), chalepin (5), chalepensin (7), and rutamarin (8) share the same basic skeleton of psoralen (9), a furanocoumarin [Figure 2]. They differ by only the functional groups attached to the basic psoralen structure. It is highly probable that they are biosynthesized from psoralen (9). It is worth noting that rutamarin (8) is the acetylated form of chalepin (5), which in turn is derived from chalepensin (7). Chalepin (5) has an extra 1-hydroxymethylethyl functional group at C-2 of the furan ring, and both chalepin (5) and rutamarin (8) have hydrogenated furan rings. Moskachan B and moskachan D have been previously reported to be present in the essential oil of R. angustifolia Pers., whereas the other compounds isolated here have been reported in plants of the Rutaceae family.[10,11,13,14] The chromatogram obtained for the pure, isolated rutamarin (1.0 mg/ml or 2.8 mM) showed a single peak at a retention time of 34.472 min, with melting point of 98–99°C. The proton and 13C-NMR spectra showed that the isolated compound was pure (96.0%) as there was no impurity present in both spectra. The 1H NMR data (600 MHz, CDCl3): δ 7.49 (1H, s, H-5), δ 7.20 (1H, s, H-4), δ 6.72 (1H, s, H-9), δ 6.17 (1H, dd, J = 17.42, 10.82 Hz, H-2’), δ 5.09 (2H, dd, J = 6.60, 3.67 Hz, H-3’), δ 5.07 (1H, m, H-2), δ 3.25 (1H, dd, J = 16.14, 9.90 Hz, H-3a), δ 3.16 (1H, dd, J = 16.14, 8.07 Hz, H-3b), δ 1.99 (3H, s, CH3 CO), δ 1.56 (3H, s, 5’-CH3), δ 1.51 (3H, s, 4’-CH3), δ 1.47 (6H, s, 2”,3”-CH3). The 13C NMR data (600 MHz, CDCl3): δ 170.29 (COCH3), δ 162.43 (C-9a), δ 160.19 (C-7), δ 154.75 (C-8a), δ 145.63 (C-2’), δ 138.03 (C-5), δ 130.91 (C-6), δ 123.89 (C-3a), δ 123.08 (C-4), δ 113.10 (C-4a), δ 112.09 (C-3’), δ 97.17 (C-9), δ 88.29 (C-2), δ 82.22 (C-1”), δ 40.31 (C-1’), δ 29.70 (C-3), δ 26.12 (C-4’, 5’), δ 22.31 (CH3 CO), δ 21.95 (C-3”), δ 21.03 (C-2”). The proton and 13C NMR spectral data are consistent with those reported by Wu et al.[11] The presence of rutamarin in both the methanol and chloroform extracts of R. angustifolia Pers. was shown through co-elution with the isolated rutamarin. Both the methanol and chloroform extracts of R. angustifolia Pers. contained rutamarin at concentrations of 0.046 and 0.075 mg/ml, respectively.
Cytotoxicity screen of compounds
In vitro toxicity evaluation is a crucial step in the development of a new therapeutic product.[15] Based on the preliminary cytotoxicity screening in which the chloroform extract of R. angustifolia Pers. was found to be more cytotoxic to the colon cancer cells, compounds 1–8 were selected for a cytotoxicity screen against the HT29 colon carcinoma cell line and the normal human colon (CCD-18Co) cell line. A compound is considered to exert good cytotoxicity if the IC50 value is less than 50 μM, mild cytotoxic activity for IC50 values between 50–100 μM, and inactive for IC50 values ≥100 μM.[16]
Table 1 displays the IC50 values of the compounds after 72 h of incubation with the cell lines. Rutamarin (8) displayed remarkable cytotoxicity against HT29 human colon carcinoma cells (IC50 values of 5.6 μM), but it exerted no damage against the CCD-18Co normal colon cells (IC50 values ≥100 μM). This result is consistent with those of Yang et al.[13] who reported remarkable cytotoxicity of rutamarin against lung, breast, colon, nasopharyngeal, liver, ovarian, and esophageal carcinoma cell lines, with IC50 values ranging between 3.7 and 13.0 μM. Rutamarin was also reported to exhibit good cytotoxicity against the DLD-1 colon carcinoma and HeLa cervical carcinoma cell lines, with IC50 values of 37.5 and 50.7 μM, respectively, as well as against gastric cancer.[11,17]
Table 1.
Cytotoxicity (inhibitory concentration 50% values) of compounds 1-8 against human colon cancer and normal colon cell lines after 72 h of incubation
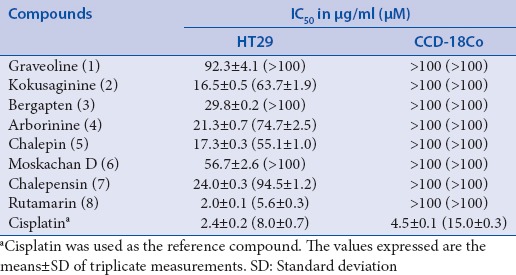
Most current therapeutic drugs for cancer treatment excessively damage healthy cells.[18] Cisplatin, which is currently used for the treatment of several human cancers, was employed as the positive control in the present study. Cisplatin was not only cytotoxic against HT29 colon cancer cell line but also exerted toxicity against the normal colon human cell line [Table 1]. On the contrary, rutamarin exerted no damage against the normal cells but displayed the ability to kill the cancer cells at a dose that was comparable to that of cisplatin. Hence, in comparison to cisplatin, rutamarin would be a better candidate for development as an anticancer drug. The identification of compounds that specifically target cancer cells with minimal impact to normal cells is an overriding goal of cancer research.[19] Rutamarin-treated HT29 cells was thus further subjected to molecular investigation.
Morphological examinations of the HT29 colon cancer cell line
Defective apoptosis (programmed cell death) plays a major role in the development and progression of cancer.[20] Cells undergoing apoptosis show typical, well-defined morphological changes including plasma membrane blebbing, reduction in cell size (pyknosis), chromatin condensation with margination of chromatin to the nuclear membrane, nuclear fragmentation, and formation of apoptotic bodies.[21,22,23,24] The cellular morphology of the apoptotic cells can be visualized using phase contrast microscopy. In this study, rutamarin-treated HT29 cells underwent cellular morphological changes in a dose- and time-dependent manner [Figure 3]. As the doses of rutamarin were increased, apoptotic bodies, cell shrinkage, detachment, and rounding were observed in a time-dependent manner.
Figure 3.
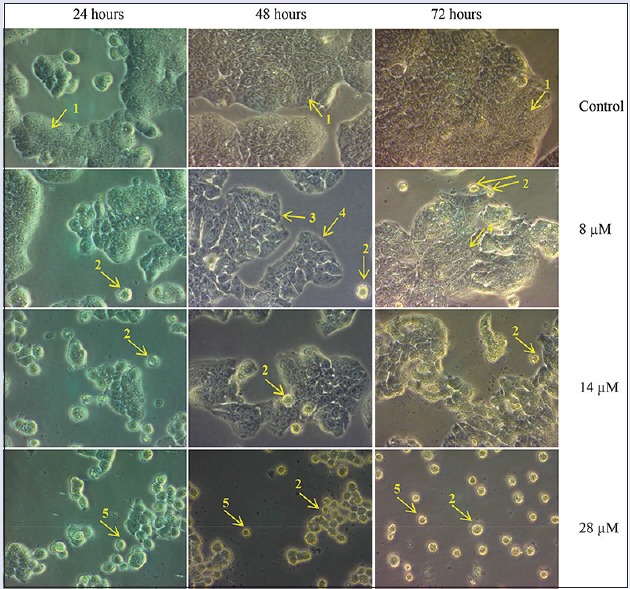
Cell morphology examination of the HT29 cancer cell line by phase contrast microscopy at ×40. The cells were treated with 8 μM, 14 μM, or 28 μM rutamarin for 48 and 72 h. The arrows indicate: (1) A control cell, (2) apoptotic bodies, (3) cell shrinkage, (4) rounding of cells and (5) detached cells
On the other hand, nuclear morphological alterations of the HT29 cells were observed using double staining with blue-fluorescent Hoechst 33342 and red fluorescent PI dyes. [Figure 4] shows alterations in nuclear morphology, particularly nuclear condensation and fragmentation as well as loss of plasma membrane integrity of the HT29 cancer cell line after 48 h of rutamarin treatment. Untreated cells showed dull blue fluorescence representing viable cancer cells. At a concentration of 8 μM, chromatin condensation, which is a hallmark of apoptosis, could be observed in the bright blue fluorescent live apoptotic cells. However, the number of pink-stained cells with condensed or fragmented nuclei representing late apoptosis or secondary necrosis as well as red-stained cells with nonfragmented nuclei representing necrosis increased as the dose increased. Both the phase contrast and fluorescence microscopic examinations strongly indicated the morphological hallmarks of apoptosis. However, it is imperative to study both the morphological and biochemical characteristics of apoptosis to postulate the type of rutamarin-induced cell death.
Figure 4.
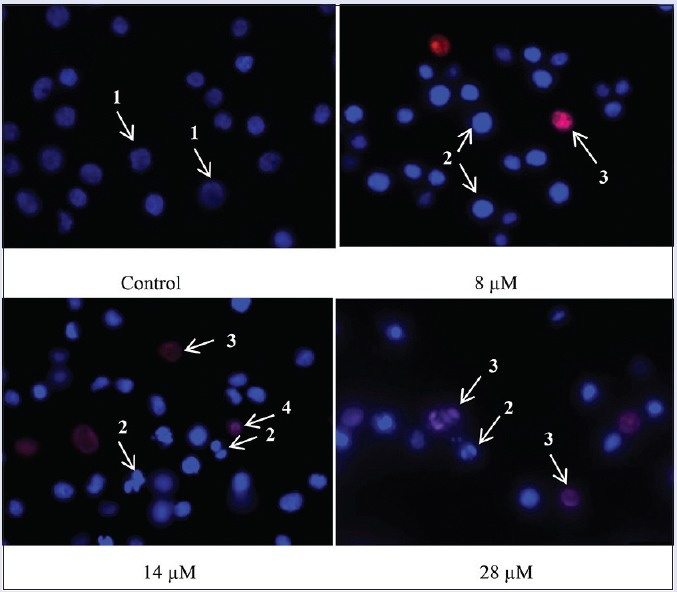
The nuclear morphology of the HT29 cancer cell line was examined by double staining of Hoechst 33342/propidium iodide and fluorescence microscopy at ×630. The cells were treated with 8 μM, 14 μM, or 28 μM rutamarin for 48 h. The arrows indicate: (1) Viable cells with normal nuclei, (2) live cells with apoptotic nuclei, (3) dead cells with apoptotic nuclei, and (4) dead cells with normal nuclei
Rutamarin induced early and late apoptosis in the HT29 cell line
The biochemical hallmarks of cancer include DNA fragmentation, externalization of phosphatidylserine, and cleavage of intracellular substrates.[23,25] In apoptotic cells, phosphatidylserine is translocated from the inner leaflet to the outer leaflet of the plasma membrane and binds to the annexin receptor of the macrophages to initiate phagocytosis.[26] This can be observed with FITC-labeled annexin V in which annexin V binds to the externalized phosphatidylserine only during apoptosis.[27]
In this study, annexin V/PI double staining was utilized to detect the early and late stages of apoptosis [Figure 5]. The annexin V-positive cells represent cells at the early stage of apoptosis, whereas cells that are positive for both annexin V and PI represent cells at the late stage of apoptosis or secondary necrosis. Rutamarin induced early and late apoptosis at each time point in a dose-dependent manner; however, there is a greater increase in late apoptotic cells than early apoptotic cells [Figure 5a and c]. Meanwhile, there is a significant time-dependent increase in late apoptotic cells by 28 μM rutamarin. Thus, rutamarin-induced apoptosis was validated through the detection of phosphatidylserine externalization.
Figure 5.
(a) Annexin V/propidium iodide assay of the rutamarin-treated HT29 cell line by flow cytometry represented (b) in a bar chart form and (c) analyzed at the concentration of 28 μM. The results are expressed as the means ± standard deviation, the different letters (a-h) represent a significant difference between different time points of treatment whereas the asterisk in (c) represents a significant difference compared to untreated control in 0.5% dimethyl sulfoxide, P < 0.05
DNA fragmentation in the rutamarin-treated HT29 cell line
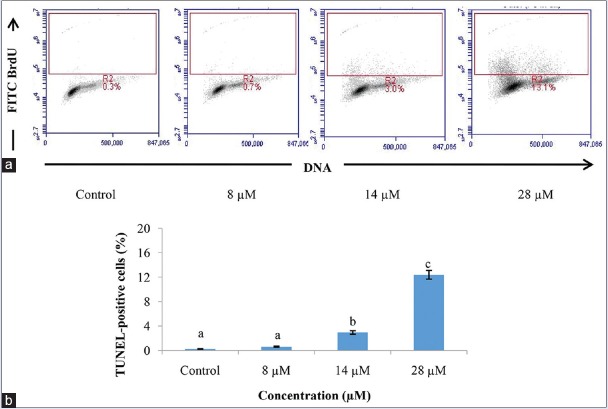
DNA fragmentation is a biochemical hallmark of apoptosis. In dying cells, DNA is cleaved by an endonuclease (CAD) that fragments the double-stranded DNA into nucleosomal units, which are multiples of about 200 bp oligomers.[25,28] There was a significant increase in the population of DNA-fragmented HT29 cells by rutamarin in a dose-dependent manner at 48 h of treatment [Figure 6]. In comparison to the untreated control, there was also a significant increase in the population of TUNEL-positive cells at rutamarin concentration of 14 μM and 28 μM [Figure 6]. The presence of DNA fragmentation in the TUNEL assay thus provides evidence that rutamarin induced apoptosis in the HT29 cells.
Figure 6.
Detection of DNA fragmentation in the HT29 cell line by the Terminal deoxynucleotidyl transferase (TdT) dUTP nick-end labeling assay (a) after 48 h of treatment by rutamarin in a dose-dependent manner and (b) represented in a bar graph. The density plots in (a) represent the Alexa Fluor fluorescence intensity for each concentration. The results are presented as the means ± standard deviation and the different letters (a-c) represent a significant difference compared to untreated control in 0.5% dimethyl sulfoxide, P < 0.05
Effect of rutamarin on the cell cycle distribution of HT29 cells
Deregulation of the cell cycle is one of the hallmarks of cancer. The cell cycle consists of interactions between proteins that process incoming internal and external signals which then decide whether the cell proliferates or differentiates.[26] At the cell cycle checkpoints, the cells are temporarily arrested to repair damaged cells or in the worst case, to induce apoptosis if the damage is irreparable.[29] In cancers cells, at least one of the checkpoints are lost.[26] Rutamarin caused G2-M and G0-G1 cell cycle arrest in the HT29 cell line along with a significant decrease in the accumulation of cells at the S phase after 72 h of treatment in a dose-dependent manner [Figure 7]. The percentage of cells in the G0-G1 phase increased significantly in comparison to the untreated cells from 65.54% to 75.26%, 76.20%, and 76.58%, with increasing concentrations of rutamarin, respectively.
Figure 7.
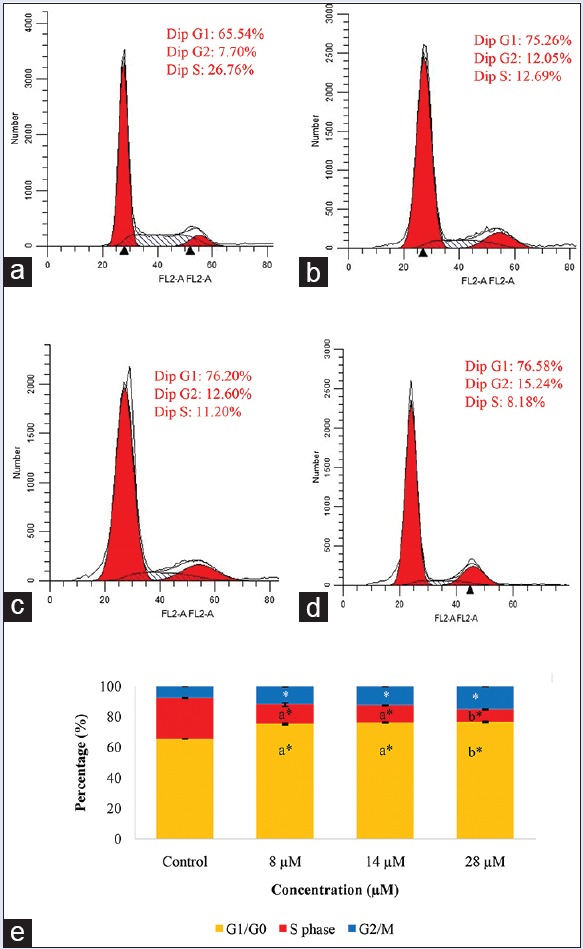
Cell cycle analysis of the HT29 cell line in (a) the untreated control in 0.5% dimethyl sulfoxide, in the presence of (b) 8 μM, (c) 14 μM and (d) 28 μM rutamarin at 72 h of treatment and (e) its representation in a bar graph. The results are expressed as the means ± standard deviation, the different letters (a-b) represent a significant difference between different concentrations of rutamarin, and the asterisk represents a significant difference compared to untreated control, P < 0.05
Similarly, in comparison to the untreated cells, the percentage of cells in G2-M phase increased significantly from 7.70% to 12.05%, 12.60%, and 15.24%, with increasing concentrations of rutamarin, respectively. At the G2/M phase checkpoint, the cells are arrested to repair the damaged DNA, to prevent segregation of defective chromosomes, or to activate apoptosis if the damage is too severe.[30,31,32] Hence, rutamarin may have inhibited the proliferation of the HT29 colon cancer cell line through cell cycle arrest at the G2-M and G0-G1 checkpoints.
Activation of caspases 3, 8, and 9
Caspases are key executioners of apoptosis.[28,33] Caspases can either be initiators, such as caspase 8 and caspase 9, or executioners, such as caspase 3. Caspase 8 is responsible for the activation of the extrinsic pathway of apoptosis through the binding of an extracellular ligand to its death receptors, such as Fas, TNF-R1, and DR4/5, whereas activated caspase 9 is responsible for the activation of the intrinsic pathway, which involves mitochondrial enzymes.[23] The activation of both pathways leads to the activation of a cascade of effector caspases, including caspase 3 which then leads to the morphological and biochemical hallmarks of apoptosis.[23,28,33]
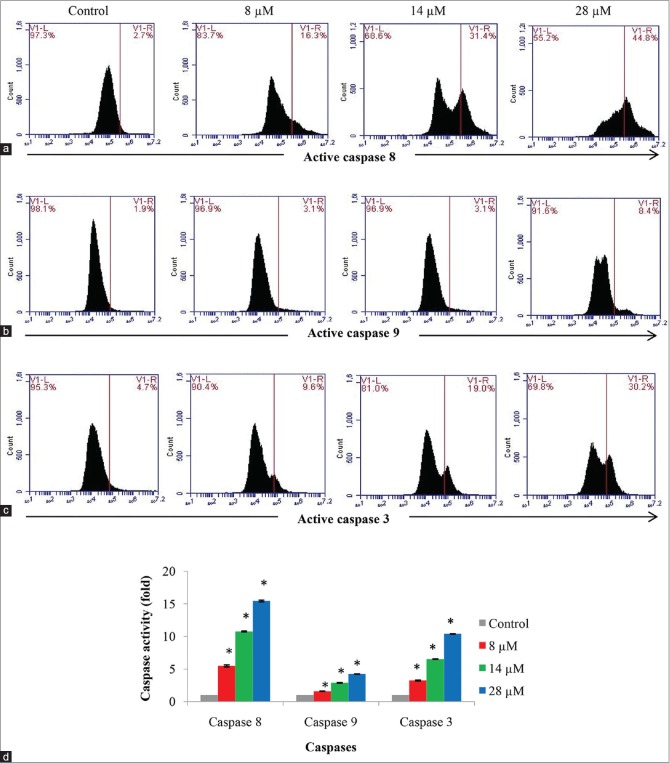
In [Figure 8a–d], caspases 8, 9, and 3 were significantly activated in a dose-dependent manner in the rutamarin-treated HT29 cell line compared to the untreated HT29 cells at 72 h of treatment. Interestingly, rutamarin-induced caspase 8 activation was up by 15-fold higher, whereas caspase 9 activation was only up by 4-fold higher than the untreated cells [Figure 8d]. Interestingly, a coumarin (kayeassamin A) isolated from Mammea siamensis was also reported to activate caspase 8 more than caspase 9.[34] This result may suggest structure and activity relation of coumarins. It is highly probable that coumarins activate the extrinsic more than the intrinsic pathway of apoptosis. Moreover, the activity of caspase 3 was 10-fold higher than the untreated cells [Figure 8d]. Based on the morphological and biochemical analysis of the rutamarin-treated HT29 cell line as well as the evaluation of caspase activity, it is confirmed that rutamarin mediated the induction of apoptosis in colon cancer cells. As the activity of caspase 8 is higher than caspase 9, apoptosis may have been primarily regulated through the extrinsic together with low levels of the intrinsic pathway.
Figure 8.
Flow cytometry analysis for active (a) caspases 8, (b) 9, and (c) 3 in the HT29 cell line after 72 h of treatment with different concentrations of rutamarin and (d) its representation in a bar chart. The results are presented as the means ± standard deviation, and the different letters (a-d) represent a significant difference compared to the untreated control in 0.5% dimethyl sulfoxide and between different concentrations of rutamarin, P < 0.05
CONCLUSIONS
Rutamarin, which is one of the chemical components of R. angustifolia, exhibited remarkable cytotoxicity against colon cancer cells. Rutamarin exerted no damage against the normal human colon cell line but possessed the ability to kill cancer cells at a dose comparable to that of cisplatin. Moreover, rutamarin triggered induction of apoptosis in HT29 colon cancer cells in a dose-dependent manner, based on the morphological and biochemical evidence of apoptosis. In addition, rutamarin-induced apoptosis may have primarily occurred through the extrinsic or death receptor pathway. Rutamarin-induced apoptosis in HT29 colon cancer cells also resulted in the cell cycle arrest at the G2/M and G0/G1 phase. The current findings therefore provide some insights into the molecular mechanisms of rutamarin-induced cell death. However, further studies on the apoptotic pathways are necessary to provide more convincing evidence. Regardless, rutamarin shows great promise as an anticancer agent.
Financial support and sponsorship
The research is supported by the High Impact Research MoE Grant UM.C/625/1/HIR/MoE/SC/02 from the Ministry of Education Malaysia. The scholarship to Shafinah Ahmad Suhaimi for financial assistance is provided by the Ministry of Education Malaysia as well as Universiti Sains Malaysia (USM).
Conflicts of interest
There are no conflicts of interest.
REFERENCES
- 1.Ferlay J, Soerjomataram I, Ervik M, Dikshit R, Eser S, Mathers C, et al. GLOBOCAN 2012 v1.0, Cancer Incidence and Mortality Worldwide: IARC CancerBase No. 11. 2013. [Last accessed on 2015 Mar 20]. Available from: http://www.globocan.iarc.fr .
- 2.Reddy YP, Chandrasekhar KB, Sadiq MJ. A study of Nigella sativa induced growth inhibition of MCF and HepG2 cell lines: An anti-neoplastic study along with its mechanism of action. Pharmacognosy Res. 2015;7:193–7. doi: 10.4103/0974-8490.150541. [DOI] [PMC free article] [PubMed] [Google Scholar]
- 3.Kong CK, Roslani AC, Law CW, Law SC, Arumugam K. Impact of socio-economic class on colorectal cancer patient outcomes in Kuala Lumpur and Kuching, Malaysia. Asian Pac J Cancer Prev. 2010;11:969–74. [PubMed] [Google Scholar]
- 4.Irwanto RR. Ruta angustifolia Pers. Leiden, Netherlands: Backhuys Publishers; 2001. [Google Scholar]
- 5.Wahyuni TS, Widyawaruyanti A, Lusida MI, Fuad A, Soetjipto, Fuchino H, et al. Inhibition of hepatitis C virus replication by chalepin and pseudane IX isolated from Ruta angustifolia leaves. Fitoterapia. 2014;99:276–83. doi: 10.1016/j.fitote.2014.10.011. [DOI] [PubMed] [Google Scholar]
- 6.Zhang Y, Zhang H, Yao XG, Shen H, Chen J, Li C, et al. (+)-Rutamarin as a dual inducer of both GLUT4 translocation and expression efficiently ameliorates glucose homeostasis in insulin-resistant mice. PLoS One. 2012;7:e31811. doi: 10.1371/journal.pone.0031811. [DOI] [PMC free article] [PubMed] [Google Scholar]
- 7.Xu B, Wang L, González-Molleda L, Wang Y, Xu J, Yuan Y. Antiviral activity of (+)-rutamarin against Kaposi's sarcoma-associated herpesvirus by inhibition of the catalytic activity of human topoisomerase II. Antimicrob Agents Chemother. 2014;58:563–73. doi: 10.1128/AAC.01259-13. [DOI] [PMC free article] [PubMed] [Google Scholar]
- 8.Phang CW, Karsani SA, Sethi G, Abd Malek SN. Flavokawain C inhibits cell cycle and promotes apoptosis, associated with endoplasmic reticulum stress and regulation of MAPKs and Akt signaling pathways in HCT 116 human colon carcinoma cells. PLoS One. 2016;11:e0148775. doi: 10.1371/journal.pone.0148775. [DOI] [PMC free article] [PubMed] [Google Scholar]
- 9.Del Castillo JB, Secundino M, Luis FR. Four aromatic derivatives from Ruta angustifolia. Phytochemistry. 1986;25:2209–10. [Google Scholar]
- 10.Orlita A, Sidwa-Gorycka M, Kumirska J, Malinski E, Siedlecka EM, Gajdus J, et al. Identification of Ruta graveolens L. metabolites accumulated in the presence of abiotic elicitors. Biotechnol Prog. 2008;24:128–33. doi: 10.1021/bp070261d. [DOI] [PubMed] [Google Scholar]
- 11.Wu TS, Shi LS, Wang JJ, Iou SC, Chang HC, Chen YP, et al. Cytotoxic and antiplatelet aggregation principles of Ruta graveolens. J Chin Chem Soc. 2003;50:171–8. [Google Scholar]
- 12.Kumar D, Mallick S, Vedasiromoni JR, Pal BC. Anti-leukemic activity of Dillenia indica L. fruit extract and quantification of betulinic acid by HPLC. Phytomedicine. 2010;17:431–5. doi: 10.1016/j.phymed.2009.07.010. [DOI] [PubMed] [Google Scholar]
- 13.Yang QY, Tian XY, Fang WS. Bioactive coumarins from Boenninghausenia sessilicarpa. J Asian Nat Prod Res. 2007;9:59–65. doi: 10.1080/10286020500382397. [DOI] [PubMed] [Google Scholar]
- 14.Joulain D, Laurent R, Fourniol J, Yaacob KB. Novel moskachan related compounds in the essential oil of Ruta angustifolia Pers. from Malaysia. J Essent Oil Res. 1991;3:355–7. [Google Scholar]
- 15.Kerche-Silva LE, Cavalcante DG, Danna CS, Gomes AS, Carrara IM, Cecchini AL, et al. Free-radical scavenging properties and cytotoxic activity evaluation of latex C-serum from Hevea brasiliensis RRIM 600. Free Radicals Antioxidants. 2017;7:107. [Google Scholar]
- 16.Wei QY, Ma JP, Cai YJ, Yang L, Liu ZL. Cytotoxic and apoptotic activities of diarylheptanoids and gingerol-related compounds from the rhizome of Chinese ginger. J Ethnopharmacol. 2005;102:177–84. doi: 10.1016/j.jep.2005.05.043. [DOI] [PubMed] [Google Scholar]
- 17.Chaya N, Terauchi K, Yamagata Y, Kinjo J, Okabe H. Antiproliferative constituents in plants 14. Coumarins and acridone alkaloids from Boenninghausenia japonica NAKAI. Biol Pharm Bull. 2004;27:1312–6. doi: 10.1248/bpb.27.1312. [DOI] [PubMed] [Google Scholar]
- 18.Sak K. Cytotoxicity of dietary flavonoids on different human cancer types. Pharmacogn Rev. 2014;8:122–46. doi: 10.4103/0973-7847.134247. [DOI] [PMC free article] [PubMed] [Google Scholar]
- 19.Pradhan D, Pradhan RK, Tripathy G, Pradhan S. Inhibition of proteasome activity by the dietary flavonoid Quercetin associated with growth inhibition in cultured breast cancer cells and xenografts. J Young Pharm. 2015;7:225. [Google Scholar]
- 20.Kasibhatla S, Tseng B. Why target apoptosis in cancer treatment? Mol Cancer Ther. 2003;2:573–80. [PubMed] [Google Scholar]
- 21.Duprez L, Wirawan E, Vanden Berghe T, Vandenabeele P. Major cell death pathways at a glance. Microbes Infect. 2009;11:1050–62. doi: 10.1016/j.micinf.2009.08.013. [DOI] [PubMed] [Google Scholar]
- 22.Ola MS, Nawaz M, Ahsan H. Role of Bcl-2 family proteins and caspases in the regulation of apoptosis. Mol Cell Biochem. 2011;351:41–58. doi: 10.1007/s11010-010-0709-x. [DOI] [PubMed] [Google Scholar]
- 23.Ouyang L, Shi Z, Zhao S, Wang FT, Zhou TT, Liu B, et al. Programmed cell death pathways in cancer: A review of apoptosis, autophagy and programmed necrosis. Cell Prolif. 2012;45:487–98. doi: 10.1111/j.1365-2184.2012.00845.x. [DOI] [PMC free article] [PubMed] [Google Scholar]
- 24.Wong RS. Apoptosis in cancer: From pathogenesis to treatment. J Exp Clin Cancer Res. 2011;30:87. doi: 10.1186/1756-9966-30-87. [DOI] [PMC free article] [PubMed] [Google Scholar]
- 25.Saraste A, Pulkki K. Morphologic and biochemical hallmarks of apoptosis. Cardiovasc Res. 2000;45:528–37. doi: 10.1016/s0008-6363(99)00384-3. [DOI] [PubMed] [Google Scholar]
- 26.Weinberg RA. p53 and apoptosis: Master guardian and executioner. 2nd ed. UK: Garland Science; 2013. [Google Scholar]
- 27.van Engeland M, Nieland LJ, Ramaekers FC, Schutte B, Reutelingsperger CP. Annexin V-affinity assay: A review on an apoptosis detection system based on phosphatidylserine exposure. Cytometry. 1998;31:1–9. doi: 10.1002/(sici)1097-0320(19980101)31:1<1::aid-cyto1>3.0.co;2-r. [DOI] [PubMed] [Google Scholar]
- 28.Maiese K, Chong ZZ, Shang YC, Wang S. Targeting disease through novel pathways of apoptosis and autophagy. Expert Opin Ther Targets. 2012;16:1203–14. doi: 10.1517/14728222.2012.719499. [DOI] [PMC free article] [PubMed] [Google Scholar]
- 29.Pietenpol JA, Stewart ZA. Cell cycle checkpoint signaling: Cell cycle arrest versus apoptosis. Toxicology. 2002;181:475–81. doi: 10.1016/s0300-483x(02)00460-2. [DOI] [PubMed] [Google Scholar]
- 30.Blagosklonny MV, Pardee AB. The restriction point of the cell cycle. Cell Cycle. 2002;1:103–10. [PubMed] [Google Scholar]
- 31.Huang M, Miao ZH, Zhu H, Cai YJ, Lu W, Ding J. Chk1 and Chk2 are differentially involved in homologous recombination repair and cell cycle arrest in response to DNA double-strand breaks induced by camptothecins. Mol Cancer Ther. 2008;7:1440–9. doi: 10.1158/1535-7163.MCT-07-2116. [DOI] [PubMed] [Google Scholar]
- 32.Molinari M. Cell cycle checkpoints and their inactivation in human cancer. Cell Prolif. 2000;33:261–74. doi: 10.1046/j.1365-2184.2000.00191.x. [DOI] [PMC free article] [PubMed] [Google Scholar]
- 33.Hengartner MO. The biochemistry of apoptosis. Nature. 2000;407:770–6. doi: 10.1038/35037710. [DOI] [PubMed] [Google Scholar]
- 34.Uto T, Tung NH, Thongjankaew P, Lhieochaiphant S, Shoyama Y. Kayeassamin a isolated from the flower of Mammea siamensis triggers apoptosis by activating caspase-3/-8 in HL-60 human leukemia cells. Pharmacognosy Res. 2016;8:244–8. doi: 10.4103/0974-8490.188884. [DOI] [PMC free article] [PubMed] [Google Scholar]


