Abstract
Objective:
This study evaluated in vitro cell viability by the colorimetric MTT stands for 3-(4,5-dimethylthiazol-2-yl)-2,5-diphenyltetrazolium bromide (3-(4, 5-dimethylthiazolyl-2)-2, 5-diphenyltetrazolium bromide) (3-(4, 5-dimethylthiazolyl-2)-2, 5-diphenyltetrazolium bromide) assay compared to image analysis by CellProfiler® software.
Materials and Methods:
Hepatoma (Hepa-1c1c7) and fibroblast (L929) cells were exposed to isolated substances, camptothecin, lycorine, tazettine, albomaculine, 3-epimacronine, trispheridine, galanthine and Padina gymnospora, Sargassum sp. methanolic extract, and Habranthus itaobinus Ravenna ethyl acetate in different concentrations. After MTT assay, cells were stained with Panotic dye kit. Cell images were obtained with an inverted microscope equipped with a digital camera. The images were analyzed by CellProfiler®.
Results:
No cytotoxicity at the highest concentration analyzed for 3-epimacronine, albomaculine, galanthine, trispheridine, P. gymnospora extract and Sargassum sp. extract where detected. Tazettine offered cytotoxicity only against the Hepa1c1c7 cell line. Lycorine, camptothecin, and H. itaobinus extract exhibited cytotoxic effects in both cell lines. The viability methods tested were correlated demonstrated by Bland–Atman test with normal distribution with mean difference between the two methods close to zero, bias value 3.0263. The error was within the limits of the confidence intervals and these values had a narrow difference. The correlation between the two methods was demonstrated by the linear regression plotted as R2.
Conclusion:
CellProfiler® image analysis presented similar results to the MTT assay in the identification of viable cells, and image analysis may assist part of biological analysis procedures. The presented methodology is inexpensive and reproducible.
SUMMARY
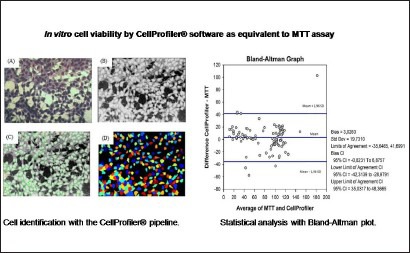
In vitro cell viability assessment with MTT (3-(4, 5-dimethylthiazolyl-2)-2, 5-diphenyltetrazolium bromide) assay may be replaced by image analysis by CellProfiler®.
The viability methods tested were correlated demonstrated by Bland-Atman test with normal distribution with mean difference between the two methods close to zero, bias value 3.0263. The correlation between the two methods was demonstrated by the linear regression plotted as R2.
Abbreviations: HPLC: High pressure liquid chromatography MTT: (3-(4, 5-dimethylthiazolyl-2)-2, 5-diphenyltetrazolium bromide) (3-(4, 5-dimethylthiazolyl-2)-2, 5-diphenyltetrazolium bromide)
Keywords: CellProfiler®, cell viability, Hepa-1c1c7, L929, image analysis, MTT
INTRODUCTION
The common techniques applied for determination of in vitro cell size, morphology and growth normally involve human manual work, which is imprecise and frequently subject to variability caused by the analyst himself or herself.[1] In addition, considering the evaluation necessity of a large amount of material and data, automatic image analysis is very desirable.[2] The use of accessible software for determination of cells morphology and viability allows accurate measurement where errors become standardized as it is performed automatically.[3] Automated image analysis has several advantages compared to manual analysis,[4,5] including speed, objectivity, quantitative and reproducibility.[4,5,6,7]
CellProfiler® software is freely available to download at www.cellprofiler.org. It is an automated image analysis for identification of cells and analyses converting the identified cells in digital images. After counting and recording the cells, it creates a wide spectrum of data such as cellular and complex morphologic analysis as for staining, size and morphology.[8] This automated method generates highly reproducible assays and performs cell selection and differentiation at a lower cost as it uses in turn, less reagents than traditional manual methods.[4] In addition, CellProfiler® optimizes the analysis time spent[4,5,9] and it possesses functionality and throughput, being also possible to integrate with other open-code software.[10] It also performs biological phenotypes measurements automatically and quantitatively from a number of images.[11] It is easy to be used by researchers who do not have great computer skills, good for implementation of methodology based on image analysis.[12] The program uses an algorithm to create a sequence of configurations to process the image according to the researcher's criteria.[8] It has been reported as a method considered easy, low cost, and efficient to detect necrosis and apoptosis.[13] CellProfiler® proved to be an effective facilitator of biological analyses, including the analysis of parameters in mouse retina cells[9] chromosome measurements,[14] a pilot study of cellular analysis in bird hemograms[15] and the identification of Chlamydia species, in a much shorter time.[16] Bray and collaborators[5] developed and used a pipeline for the identification of yeast colonies in agar plates, confirming the possibility to create adjustable pipelines in several biological experiments.
Evaluation and triage methods for artificial or natural substances having cytotoxic activity are relevant for antitumor treatment.[17,18] Several plants are constantly analyzed to verify their phytochemical composition and potential in pharmaceutical science[19]. MTT (3-(4, 5-dimethylthiazolyl-2)-2, 5-diphenyltetrazolium bromide) (3-(4, 5-dimethylthiazolyl-2)-2, 5-diphenyltetrazolium bromide) colorimetric assay is a very common tool for cytotoxicity evaluation as a mean to find new drugs to eliminate cancer cells. This was the methodology used by Samarghandian et al.,[20] against breast cancer cells (MCF-7); by Sibi and Rabina[21] against RAW 264.7 cells; by Siddiqui et al.,[22] for breast cancer cell lines; CT26 and by Mathew et al.,[23] against hepatocellular carcinoma. MTT is also used to verify protective effect as it evaluates cell viability in turns.[24]
Considering that 100 alkaloids structures have been isolated and elucidated from Amaryllidaceae family plant, with antiproliferative activity over eukaryotic cells by interfering with protein synthesis,[25] this work proposes to select isolated alkaloids from this family and to evaluate cytotoxicity comparing the traditional colorimetric MTT method with image data generated by CellProfiler®. Isolated alkaloids from the Amaryllidaceae family as licorine, 3- epimacronine, tazettine, trispheridine, albomauline, and galanthine. In addition, camptothecina, a well-known cytotoxic substance and tree extract, algae Padina gymnospora methanolic extract, Sargassum sp. algae methanolic extract, and a plant Habranthus itaobinus Ravenna ethyl acetate extract were also included for cytotoxicity evaluation.
MATERIALS AND METHODS
Cell Line and Reagents
Hepatoma cancer Hepa-1c1c7 cells (ATCC® CRL-2026) and fibroblast L929 cells (ATCC®CCL1TM) were kept on Dulbecco's Modified Eagle's Medium (DMEM, Sigma Aldrich, USA) with 3.7 g NaHCO3 and supplemented with 10% fetal bovine serum (FBS, Cripion, Brazil), 60 μgmL-1 penicillin, and 100 μgmL-1 streptomycin (Sigma-Aldrich, USA). The cells were maintained at 37°C in a humidified atmosphere with 5% carbon dioxide (CO2). Camptothecin and MTT (3-(4, 5-dimethylthiazolyl-2)-2, 5-diphenyltetrazolium bromide) were purchased from Sigma Aldrich®. Panotic kit staining was purchased from New-Prov Brazil. The isolated substances and extracts tested in this study were provided by Paulo Cezar Vieira from the Laboratory of Natural Products (Federal University of Espírito Santo and University Vila Velha, Brazil). Reagents and chemicals used were of analytical grade.
Cellular Treatment for Image Analysis and MTT Assay
Hepa-1c1c7 and fibroblast L929 cells were seeded at a density of 7 × 10⁴ cells mL-1 in 96-well plates and cultured for 24 hours with increasing concentrations of camptothecin (0.045-100 μM), Padina gymnospora algae methanolic extract (0.300-312.5 μgmL-1), Sargassum sp. Algae methanolic extract (0.300-312.5 μgmL-1), lycorine (0.1-83 μM), tazettine (0.03-30 μM), Habranthus itaobinus ethyl acetate extract (0.08-312.5 μgmL-1), albomaculine (0.75-46 μM), 3-epimacronine (3.03-19 μM), trispheridine (4.50-28 μM), and galanthine (0.88–56 μM). After 24-hour incubation, the medium was removed and the cells were stained either Panotic staining for the CellProfiler® analysis or MTT for the colorimetric viability assay.[26]
Image Analysis Preparation
The medium was removed and cell fixation and coloration were performed with Panotic kit solution I, II and III following the manufacturer instructions. As the cells were on plate, and not on slide, a volume of 50 μL for each solution was applied.
Thereafter, 10 photos were taken for each sample concentration with an inverted microscope (LGD3 model, Eikonal, Brazil). Cell analysis was performed using the CellProfiler® software for cell parameters.
Image Analysis and Mobile Identification
For each concentration evaluated, the same standard analysis was used for the pipeline (step by step) [Table 1]. The analysis only changed in identifying the primary-object item, minimum area, and maximum area, depending on the need of each concentration. The images were identified, analyzed, and quantified by CellProfiler® [Figure 1]. The recognized cells are illustrated by Figure 2, L929 cells (A), Hepa-1c1c7 cells (B).
Table 1.
Configuration of sequence pipeline in CellProfiler® software
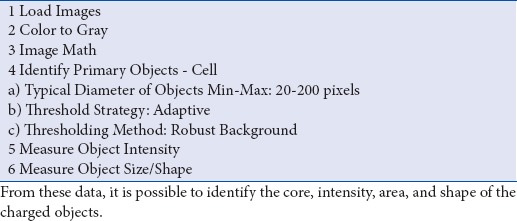
Figure 1.
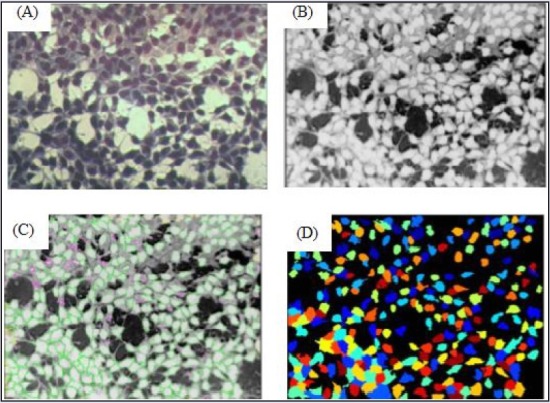
Cell identification with the CellProfiler® pipeline Figure 1: (A) The original image. (B) Image converted to grayscale. (C) In green, identified cells according to the established parameters (size and shape); in pink cells deleted (because are not within the parameters). (D) Cells identified from picture c, each colored point represents one identified cell
Figure 2.
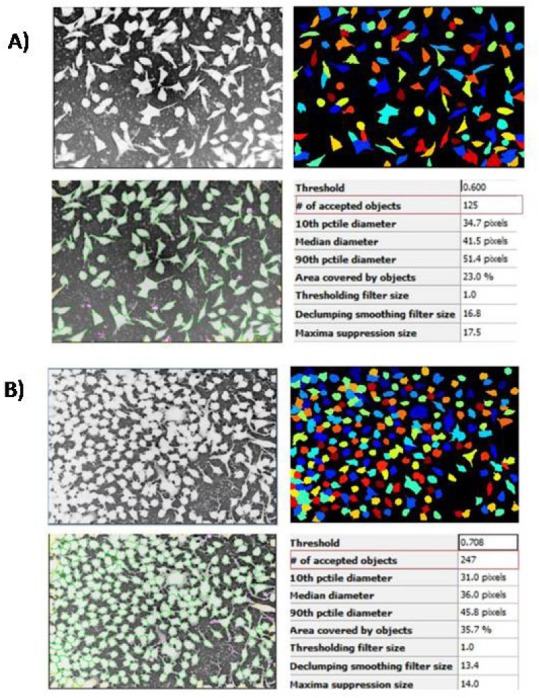
Identification and quantification of objects (cells) by CellProfiler® software. L929 cells (A), Hepa-1c1c7 cells (B)
Colorimetric cell viability assay
In vitro cytotoxic activity was evaluated by the colorimetric MTT assay.[26] Briefly, the MTT (3- (4,5-dimethylthiazol-2-yl)-2,5-diphenyl tetrazolium bromide) is cleaved into a blue colored product (formazan) by the mitochondrial enzyme succinate-dehydrogenase. Dissolution of the formazan crystal is performed by addition of 100μL dimethyl sulfoxide. The absorbance was determined at 595 nm using a microplate reader (Spectra Max 190, Molecular Devices, USA).
The Hepa-1c1c7 and L929 cells were plated in 96-well, flat-bottom plates at a concentration of 0.7 × 10⁵ cells mL-1, overnight incubated at 37°C at 5% CO2 in-air atmosphere. Dulbecco's modified Eagle's medium containing 10% fetal bovine serum was used for cell cultivation. The cells were exposed to different concentrations of the substances and extracts.
To calculate cell viability, the absorbance resulted from the DMSO is dimethyl sulfoxide (0.5%) control was used as 100% cell survived been comparing to the absorbance of samples tested as “x” and expressed as mean and standard deviation.
The cytotoxic substances have their half maximal inhibitory concentration IC50 estimated with Table Curve 2D® software.
Statistical Analysis
To evaluate the correlation between the two methods used, a Bland–Altman analysis was applied with Sigma Plot Systat Software Inc. To be considered as acceptable results for Bland–Altman analysis, the data must have a normal distribution and good correlation between the two methods.[27] An average close to zero indicates that methods were good correlated between them.
RESULTS AND DISCUSSION
Compounds that presented selectivity for cancer cells are very important in chemotherapy novel drug development. Camptothecin was identified as an alkaloid substance that efficiently impairs cancer cells growth.[28] It was isolated from Camptotheca acuminado a plant with China origin.[29,30] Li et al.[28] showed an IC50 of 0.56 μM for camptothecin in a human liver cancer line and Piao et al.[31] found an IC50 of 0.70 μM for the same lineage. In addition, Fronza et al.[32] showed an IC50 of 0.4 μM in the pancreatic cancer cell lines. The present study showed an IC50 of 0.47 μM for camptothecin in Hepa-1c1c7 and 0.7 μM in L929 cells similar to the data previously reported. Camptothecin was commercially acquired and was selected as standard to compare the other substances to be tested.
Among the isolated substances and considering the traditional MTT method for toxicity, lycorine presented IC50 for cancer cells Hepa1c1c7 of 2.88 μM (dp 0, 03) and for the normal fibroblasts L929 cells of 0.62 μM (dp 0.02). Tazettine presented cytotoxicity only against Hepa-1c1c7 (IC50 = 10.40 μM). Luo et al.[33] evaluated alkaloids cytotoxicity as 3-epimacronine, tazettine, trispheridine, and lycorine. They reported cytotoxic only for lycorine against leucocytes cancer cells HL60 with IC50 of 2,07 μM (dp 0,3). The results presented agree with the cytotoxicity for lycorine against Hepa1c1c7 cancer cells. Habrantus species from the Amaryllidaceae family are known as alkaloids produces that differentiate between them in the chemical structure. They have been reported as antitumor and cytotoxic.[34] In the present study, H. itaobinus presented IC50 of 0.78 μgmL-1 (dp 0.09) for Hepa 1c1c7 and 0.14 μgmL-1 (dp0.003) for L929 cells. The IC50 data here demonstrated that the cells evaluated are more sensible to the H. itaobinus than the cancer cells HL60 that presented IC50 of 11,5 μgmL-1 against H. brachyandrus reported by Jitsuno.[34] In addition, 3-epimacronine, albomaculine, galanthine, and trispheridine were tested against Hepa1c1c7 and normal cells L929 fibroblasts in the concentration of 19, 46, 56, 28 μM respectively. They did not present cytotoxicity in these concentrations. Bessa[25] also reported no cytotoxicity for albomaculine against mammal's cells.
Considering the algae extracts P. gymnospora did not present cytotoxicity in the concentration tested of 312.15 μgmL-1 with 99.40% (dp11.39) viability for L929. The positive cell proliferation activity could also be demonstrated for methanolic extract of these algae.[35] In addition, the methanolic extract of P. pavonia, brown algae, demonstrated low cytotoxicity for normal lung human cells MRC-5 of IC50 > 200 μgmL-1.[36] Sargassum sp. evaluated in a concentration of 312.15 μgmL-1 also had no cytotoxicity. However, Sargassum angustifolium presented cytotoxicity effect against T47D and HT 29 cell lines with a IC50 of 166.42 ± 26.7 and 190.24 ± 52.8 μgmL-1.[28] However, alginate isolated from Sargassum fulvellum demonstrated antitumor effect against murine tumor Sarcoma 180 (no cystic and solid form), and Erlich carcinoma.[36]
Cell viability was assessed by image analysis with CellProfiler® software and compared with data from cell viability determined by colorimetric MTT assay. The results are presented as percentage of cell survival [Table 2]. The data had normal distribution confirmed by histogram, and the mean difference between the two methods was close to zero, as shown by the bias value 3.0263. Moreover, 95% of the values were between the established concordances limits -35.6465 and 41.6991. The error was within the limits of the confidence intervals and these values had a narrow difference. The correlation between the two methods was demonstrated by the linear regression plotted as R2.
Table 2.
Cellular viability of tested substances at their maximum concentration tested

Comparing the methodologies, MTT and image analysis, the study presented significant and acceptable results in the Bland–Altman test. The data presented a normal distribution [Figure 3]. The histogram data confirmed the normality, and the graph showed no distortion or very long tails.[37] Altman and Bland[34] recommended that 95% of the figure points be within the difference of means in the standard deviation, and the closer to zero the difference of means is, the greater the agreement is. In this study, the difference between the averages was 3.0263, being very close to zero as recommended by the authors.
Figure 3.
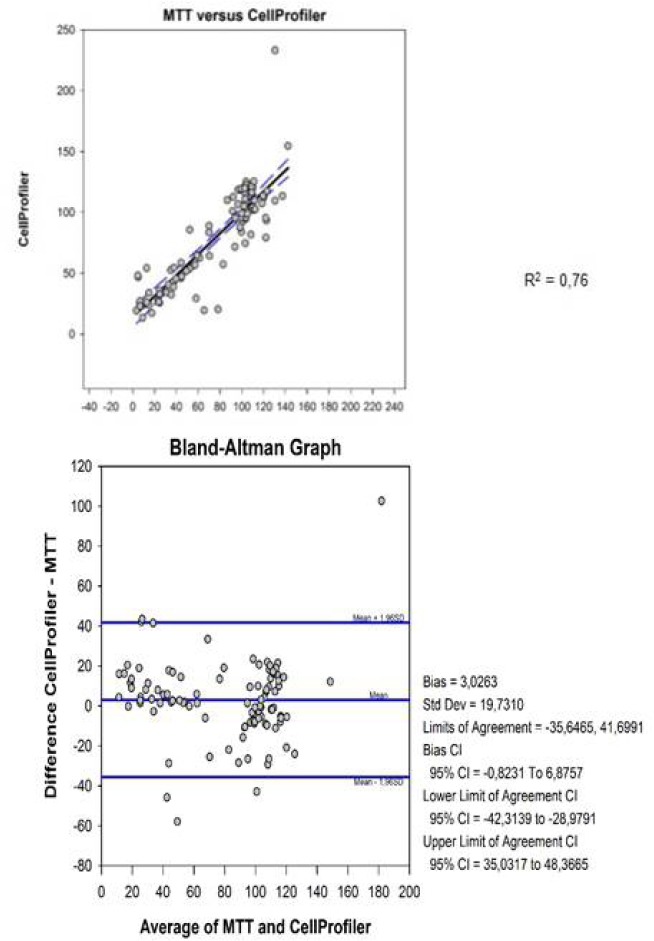
Statistical analysis with Bland-Altman plot Figure 3: This figure shows the correlation of cell viability as calculated by CellProfiler® and MTT assay
According to Giovarina,[37] the confidence interval (CI) checks how precise the estimates of the data are and allows one to estimate a possible sampling error. The larger the sample size is, the narrower the confidence interval and the greater the reliability will be for the data to correspond to the true values. The data presented in this study showed narrow CI values, between -35.6465 and 41.6991, suggesting that the values were approximately acceptable of the true value. Therefore, the data showed an acceptable standard statistical correspondence between the feasibility of the MTT method and analysis with CellProfiler®.
The correlation coefficient is an association measurement, not being appropriate to evaluate the concordance between methods.[38,39] The Bland–Altman method is the most adequate to assess this concordance [Figure 3].[40] According to the assessment of this study's data, the image analysis is promising in the analysis of cellular viability, presenting a statistical significance P< 0,5 among the obtained values.
CONCLUSIONS
Image analysis with CellProfiler® software proved to be a fast method to optimize cell analysis. This technique allowed the verification of cellular morphology and presented with little variation, good correlation with the gold standard test MTT. In addition, the image analyses were reproducible being an efficient method. The present study used only routine staining, a low-cost method to evaluate viability and cellular parameters. Without the need of a fluorescent staining or other techniques that elevate the final cost, image analysis is a convenient alternative to visual analysis. This study provided a quick, inexpensive, and efficient analysis. However, the scarcity of data on this subject denotes the importance of more studies to enhance this technique.
Ethical Approval
The authors did not use any human or animal participants in this study or preliminary studies.
Financial Support and Sponsorship
Nil
Conflicts of interest
There are no conflicts of interest
Acknowledgments
The authors are grateful to Fundação de Amparo à Pesquisa do Espírito Santo (FAPES, grant no. 550/2015 and 241/2016), Coordenação de Aperfeiçoamento de Pessoal de Nível Superior (CAPES, Project # 66294681), Conselho Nacional de Desenvolvimento Científico e Tecnológico (CNPq grants n° 472171/2013-5 and 401409/2014-7), and University Vila Velha for the financial support.
REFERENCES
- 1.Diem K, Magaret A, Klock A, Jin L, Zhu J, Corey L. Image analysis for accurately counting CD4+ and CD8+ T cells in human tissue. J Virol Methods. 2015;222:117–21. doi: 10.1016/j.jviromet.2015.06.004. [DOI] [PMC free article] [PubMed] [Google Scholar]
- 2.Uhlmann V, Singh S, Carpenter AE. CP-CHARM: segmentation-free image classification made accessible. BMC Bioinformatics. 2016;17:51. doi: 10.1186/s12859-016-0895-y. [DOI] [PMC free article] [PubMed] [Google Scholar]
- 3.Shamir L, Delaney JD, Orlov N, Eckley DM, Goldberg IG. Pattern recognition software and techniques for biological image analysis. PLoS Comput Biol. 2010;6:e1000974. doi: 10.1371/journal.pcbi.1000974. [DOI] [PMC free article] [PubMed] [Google Scholar]
- 4.Lamprecht MR, Sabatini DM, Carpenter AE. Cell Profiler: free, versatile software for automated biological image analysis. Biotechniques. 2007;42:71–5. doi: 10.2144/000112257. [DOI] [PubMed] [Google Scholar]
- 5.Bray MA, Vokes MS, Carpenter AE. Using CellProfiler for Automatic Identification and Measurement of Biological Objects in Images. Curr Protoc Mol Biol. 2015;109:17.1–13. doi: 10.1002/0471142727.mb1417s109. [DOI] [PMC free article] [PubMed] [Google Scholar]
- 6.Rexhepaj E, Agnarsdóttir M, Bergman J, Edqvist PH, Bergqvist M, Uhlén M, et al. A texture based pattern recognition approach to distinguish melanoma from non-melanoma cells in histopathological tissue microarray sections. PLoS One. 2013;8:e62070. doi: 10.1371/journal.pone.0062070. [DOI] [PMC free article] [PubMed] [Google Scholar]
- 7.Krajewska M, Smith LH, Rong J, Huang X, Hyer ML, Zeps N, et al. Image analysis algorithms for immunohistochemical assessment of cell death events and fibrosis in tissue sections. J Histochem Cytochem. 2009;57:649–63. doi: 10.1369/jhc.2009.952812. [DOI] [PMC free article] [PubMed] [Google Scholar]
- 8.Carpenter AE, Jones TR, Lamprecht MR, Clarke C, Kang IH, Friman O, et al. CellProfiler: image analysis software for identifying and quantifying cell phenotypes. Genome Biol. 2006;7:R100. doi: 10.1186/gb-2006-7-10-r100. [DOI] [PMC free article] [PubMed] [Google Scholar]
- 9.Boatright JH, Dalal N, Chrenek MA, Gardner C, Ziesel A, Jiang Y, et al. Methodologies for analysis of patterning in the mouse RPE sheet. Mol Vis. 2015;21:40–60. [PMC free article] [PubMed] [Google Scholar]
- 10.Kamentsky L, Jones TR, Fraser A, Bray MA, Logan DJ, Madden KL, et al. Improved structure, function and compatibility for CellProfiler: modular high-throughput image analysis software. Bio informatics. 2011;27:1179–80. doi: 10.1093/bioinformatics/btr095. [DOI] [PMC free article] [PubMed] [Google Scholar]
- 11.Tozetti PB, Lima EM, Nascimento AM, Endringer DC, Pinto FE, Andrade TU, et al. Morphometry to identify subtypes of leukocytes. Hematol Oncol Stem Cell Ther. 2014;7:69–75. doi: 10.1016/j.hemonc.2013.11.005. [DOI] [PubMed] [Google Scholar]
- 12.Jones TR, Kang IH, Wheeler DB, Lindquist RA, Papallo A, Sabatini DM, et al. CellProfiler Analyst: data exploration and analysis software for complex image-based screens. BMC Bioinformatics. 2008;9:482. doi: 10.1186/1471-2105-9-482. [DOI] [PMC free article] [PubMed] [Google Scholar]
- 13.Buzin AR, Pinto FE, Nieschke K, Mittag A, de Andrade TU, Endringer DC, et al. Replacement of specific markers for apoptosis and necrosis by nuclear morphology for affordable cytometry. J Immunol Methods. 2015;420:24–30. doi: 10.1016/j.jim.2015.03.011. [DOI] [PubMed] [Google Scholar]
- 14.González JE, Romero I, Gregoire E, Martin C, Lamadrid AI, Voisin P, et al. Biodosimetry estimation using the ratio of the longest: shortest length in the p remature chromosome condensation (PCC) method applying auto capture and automatic image analysis. J Radiat Res. 2014;55:862–5. doi: 10.1093/jrr/rru030. [DOI] [PMC free article] [PubMed] [Google Scholar]
- 15.Beaufrère H, Ammersbach M, Tully TN. Complete blood cell count in psittaciformes by using high-throughput image cytometry: a pilot study. J Avian Med Surg. 2013;27:211–7. doi: 10.1647/1082-6742-27.3.211. [DOI] [PubMed] [Google Scholar]
- 16.Osaka I, Hills JM, Kieweg SL, Shinogle HE, Moore DS, Hefty PS. An automated image-based method for rapid analysis of Chlamydia infection as a tool for screening antichlamydial agents. Antimicrob Agents Chemother. 2012;56:4184–8. doi: 10.1128/AAC.00427-12. [DOI] [PMC free article] [PubMed] [Google Scholar]
- 17.Mahavorasirikul W, Viyanant V, Chaijaroenkul W, Itharat A, Na-Bangchang K. Cytotoxic activity of Thai medicinal plants against human cholangiocarcinoma, laryngeal and hepatocarcinoma cells in vitro. BMC. Complement Altern Med. 2010;10:55. doi: 10.1186/1472-6882-10-55. [DOI] [PMC free article] [PubMed] [Google Scholar]
- 18.Ali MA, Abul Farah M, Al-Hemaid FM, Abou-Tarboush FM. In vitro cytotoxicity screening of wild plant extracts from Saudi Arabia on human breast adenocarcinoma cells. Genet Mol Res. 2014;13:3981–90. doi: 10.4238/2014.May.23.9. [DOI] [PubMed] [Google Scholar]
- 19.Mans DR, da Rocha AB, Schwartsmann G. Anti-cancer drug discovery and development in Brazil: targeted plant collection as a rational strategy to acquire candidate anti-cancer compounds. Oncologist. 2000;5:185–98. doi: 10.1634/theoncologist.5-3-185. [DOI] [PubMed] [Google Scholar]
- 20.Samarghandian S, Azimi-Nezhad M, Borji A, Hasanzadeh M, Jabbari F, Farkhondeh T, Samini M. Inhibitory and cytotoxic activities of chrysin on human breast adenocarcinoma cells by induction of apoptosis. Pharmacogn Mag. 2016;12(Suppl 4):S436–S440. doi: 10.4103/0973-1296.191453. [DOI] [PMC free article] [PubMed] [Google Scholar]
- 21.Sibi G, Rabina S. Inhibition of Pro-inflammatory mediators and cytokines by Chlorella Vulgaris extracts. Phcog Res. 2016;8:118–22. doi: 10.4103/0974-8490.172660. [DOI] [PMC free article] [PubMed] [Google Scholar]
- 22.Siddiqui M J, Hafizoh S N, Ismail Z, Sahib H B, Helal M, Abdul Majid A. Analysis of Total Proteins, Polysaccharides and Glycosaponins Contents of Orthosiphon stamineus Benth. Spray and Freeze Dried Methanol: Water(1:1) extract and its Contribution to Cytotoxic and Antiangiogenic Activities Phcog Res. 2009;1:320–6. [Google Scholar]
- 23.Mathew S, Faheem M, Suhail M, Fatima K, Archunan G, Begum N, et al. Updates on Traditional Medicinal Plants for Hepatocellular Carcinoma. Pharmacogn J. 2016;8:203–14. [Google Scholar]
- 24.Rathi S, Suthar M, Patel P, Bhaskar V, Rajgor N. In-vitro cytotoxic screening of Glycyrrhiza glabra L. (Fabaceae): A natural anticancer drug. Journal of Young Pharmacists. 2009;1:239. [Google Scholar]
- 25.Bessa CDPB. Estudo Quí mico e Biológico em alcaloides de Hippeastrum aulicum (KER GAWL.) HERB: uma espécie da família Amaryllidaceae. Chemistry. M Dissertation, Exact Sciences Center, Federal UniversityofEspírito Santo, Vitória, Brazil. 2015 [Google Scholar]
- 26.Mosmann T. Rapid colorimetric assay for cellular growth and survival: application to proliferation and cytotoxicity assays. J Immunol Methods. 1983;65:55–63. doi: 10.1016/0022-1759(83)90303-4. [DOI] [PubMed] [Google Scholar]
- 27.Bland JM, Altman DG. Measuring agreement in method comparison studies. Stat Methods Med Res. 1999;8:135–60. doi: 10.1177/096228029900800204. [DOI] [PubMed] [Google Scholar]
- 28.Li X, Zhao T, Cheng D, Chu C, Tong S, Yan J, et al. Synthesis and biological activity of some bile acid-based camptothecin analogues. Molecules. 2014;19:3761–76. doi: 10.3390/molecules19033761. [DOI] [PMC free article] [PubMed] [Google Scholar]
- 29.Li QY, Zu YG, Shi RZ, Yao LP. Review camptothecin: current perspectives. Curr Med Chem. 2006;13:2021–39. doi: 10.2174/092986706777585004. [DOI] [PubMed] [Google Scholar]
- 30.Zu YG, Li QY, Fu YJ, Wang W. Synthesis and cytotoxicity of water soluble quaternary salt derivatives of camptothecin. Bioorg Med Chem Lett. 2004;14:4023–6. doi: 10.1016/j.bmcl.2004.05.032. [DOI] [PubMed] [Google Scholar]
- 31.Piao D, Kim T, Zhang HY, Choi HG, Lee CS, Choi HJ, et al. DNA Topoisomerase Inhibitory Activity of Constituents from the Flowers of Inula japonica. Chem Pharm Bull (Tokyo) 2016;64:276–81. doi: 10.1248/cpb.c15-00780. [DOI] [PubMed] [Google Scholar]
- 32.Fronza M, Murillo R, ⊠lusarczyk S, Adams M, Hamburger M, Heinzmann B, et al. In vitro ytotoxic activity of abietane diterpenes from Peltodon longipes as well as Salvia miltiorrhiza and Salvia sahendica. Bioorg Med Chem. 2011;19:4876–81. doi: 10.1016/j.bmc.2011.06.067. [DOI] [PubMed] [Google Scholar]
- 33.Luo Z, Wang F, Zhang J, Li X, Zhang M, Hao X, et al. Cytotoxic alkaloids from the whole plants of Zephyranthes candida. J NatProd. 2012;75:2113–20. doi: 10.1021/np3005425. [DOI] [PMC free article] [PubMed] [Google Scholar]
- 34.Jitsuno M, Yokosuka A, Sakagami H, Mimaki Y. Chemical constituents of the bulbs of Habranthus brachyandrus and their cytotoxic activities. Chem Pharm Bull (Tokyo) 2009;57:1153–7. doi: 10.1248/cpb.57.1153. [DOI] [PubMed] [Google Scholar]
- 35.Baliano AP, Pimentel EF, Buzin AR, Vieira TZ, Romão W, Tose LV, et al. Brown seaweed Padina gymnospora is a prominent natural wound-care product. Braz. Pharmacog. 2016;26:714–19. [Google Scholar]
- 36.Fujihara M, Iijima N, Yamamoto I, Nagumo T. Purification and chemical and physical characterisation of an antitumour polysaccharide from the brown seaweed Sargassum fulvellum. Carb Research. 1984;125:97–106. [Google Scholar]
- 37.Giavarina D. Understanding Bland Altman analysis. Biochemia Medica. 2015;25:141–151. doi: 10.11613/BM.2015.015. [DOI] [PMC free article] [PubMed] [Google Scholar]
- 38.Altman DG, Bland JM. Measurement in medicine: The analysis of method comparison studies. Journal of the Royal Statistical Society. Series D (The Statistician) 1983;32:307–17. [Google Scholar]
- 39.Bland JM, Altman D. Statistical methods for assessing agreement between two methods of clinical measurement. Lancet. 1986;327:307–10. [PubMed] [Google Scholar]
- 40.Hirakata VN, Camey SA. “Análise de concordância entre métodos de Bland-Altman.”. Revista HCPA. 2009;29:261–68. [Google Scholar]


