Abstract
Key points
Cerebellar Purkinje cells (PCs) generate two types of action potentials, simple and complex spikes. Although they are generated by distinct mechanisms, interactions between the two spike types exist.
Zebrin staining produces alternating positive and negative stripes of PCs across most of the cerebellar cortex. Thus, here we compared simple spike–complex spike interactions both within and across zebrin populations.
Simple spike activity undergoes a complex modulation preceding and following a complex spike. The amplitudes of the pre‐ and post‐complex spike modulation phases were correlated across PCs. On average, the modulation was larger for PCs in zebrin positive regions.
Correlations between aspects of the complex spike waveform and simple spike activity were found, some of which varied between zebrin positive and negative PCs.
The implications of the results are discussed with regard to hypotheses that complex spikes are triggered by rises in simple spike activity for either motor learning or homeostatic functions.
Abstract
Purkinje cells (PCs) generate two types of action potentials, called simple and complex spikes (SSs and CSs). We first investigated the CS‐associated modulation of SS activity and its relationship to the zebrin status of the PC. The modulation pattern consisted of a pre‐CS rise in SS activity, and then, following the CS, a pause, a rebound, and finally a late inhibition of SS activity for both zebrin positive (Z+) and negative (Z−) cells, though the amplitudes of the phases were larger in Z+ cells. Moreover, the amplitudes of the pre‐CS rise with the late inhibitory phase of the modulation were correlated across PCs. In contrast, correlations between modulation phases across CSs of individual PCs were generally weak. Next, the relationship between CS spikelets and SS activity was investigated. The number of spikelets/CS correlated with the average SS firing rate only for Z+ cells. In contrast, correlations across CSs between spikelet numbers and the amplitudes of the SS modulation phases were generally weak. Division of spikelets into likely axonally propagated and non‐propagated groups (based on their interspikelet interval) showed that the correlation of spikelet number with SS firing rate primarily reflected a relationship with non‐propagated spikelets. In sum, the results show both zebrin‐related and non‐zebrin‐related physiological heterogeneity in SS–CS interactions among PCs, which suggests that the cerebellar cortex is more functionally diverse than is assumed by standard theories of cerebellar function.
Keywords: cerebellum, inferior olive, spikelet
Key points
Cerebellar Purkinje cells (PCs) generate two types of action potentials, simple and complex spikes. Although they are generated by distinct mechanisms, interactions between the two spike types exist.
Zebrin staining produces alternating positive and negative stripes of PCs across most of the cerebellar cortex. Thus, here we compared simple spike–complex spike interactions both within and across zebrin populations.
Simple spike activity undergoes a complex modulation preceding and following a complex spike. The amplitudes of the pre‐ and post‐complex spike modulation phases were correlated across PCs. On average, the modulation was larger for PCs in zebrin positive regions.
Correlations between aspects of the complex spike waveform and simple spike activity were found, some of which varied between zebrin positive and negative PCs.
The implications of the results are discussed with regard to hypotheses that complex spikes are triggered by rises in simple spike activity for either motor learning or homeostatic functions.
Abbreviations
- CS
complex spike
- FR
firing rate
- ISI
interspike interval
- LTD
long term depression
- LTP
long term potentiation
- PC
Purkinje cell
- SS
simple spike
- SD
standard deviation
- Z
zebrin
Knowledge of Purkinje cell (PC) spiking patterns is central to understanding cerebellar function, because this activity represents the entire output of the cerebellar cortex, and is the major synaptic control of the deep cerebellar nuclei (DCN) from which arise the large majority of cerebellar efferents. Traditionally, the simple spikes (SSs) and complex spikes (CSs) that PCs generate have been assigned largely independent roles with regard to this issue. SSs have been generally thought to be the primary conveyers of PC output, whereas CSs have been proposed to play a role in synaptic plasticity primarily and not to affect significantly PC output at the time of their occurrence (e.g. Ito, 2001). However, such a strict functional segregation may not be needed, and indeed, there are several plausible mechanisms that would allow CS activity to be a significant component of PC output (Lang et al. 2017). For example, when synchronized across PCs, CSs cause significant inhibition of DCN firing (Blenkinsop & Lang, 2011; Lang & Blenkinsop, 2011).
Moreover, SS and CS activity is often correlated, and thus modulation of ongoing SS activity is a second mechanism by which CSs can have immediate impact on PC output. Indeed, it is well‐known that SS and CS activity have short‐term interactions. Specifically, CSs are followed by a pause in SSs, which is often followed by further modulation of SS activity (Granit & Phillips, 1956; Bell & Grimm, 1969; Murphy & Sabah, 1970; Bloedel & Roberts, 1971; Latham & Paul, 1971; Burg & Rubia, 1972; Ebner & Bloedel, 1981a,b; McDevitt et al. 1982; Bloedel et al. 1983; Ebner et al. 1983; Mano et al. 1986; Sato et al. 1992). Pre‐CS changes in SS activity have also been reported (Miall et al. 1998; Burroughs et al. 2017).
Adding to the complexity of SS–CS interactions is that PC activity varies systematically across the cerebellar cortex. For example, spontaneous SS firing rates are lower in zebrin positive (Z+) than negative (Z−) regions of the cerebellar cortex. Moreover, the SS pause length and the strength of the rebound in SS activity after the pause differ between Z+ and Z− regions (Xiao et al. 2014; Zhou et al. 2014, 2015).
Thus, CS–SS interactions and how they vary within and between Z+ and Z− cerebellar regions are potentially important aspects of cerebellar physiology. Here, we provide a detailed quantitative characterization of CS‐associated modulation of SS activity, investigate how this modulation is correlated with CS waveform (i.e. spikelet numbers), and investigate how this modulation and its relationship to CS waveform vary within and between Z− and Z+ regions.
Methods
Ethical approval
Experiments were performed in accordance with the NIH's Guide for the Care and Use of Laboratory Animals and the UK Animals (Scientific Procedures) Act 1986. Experimental protocols were approved by the Institutional Animal Care and Use Committee of New York University School of Medicine and the University of Bristol Animal Welfare and Ethical Review Body.
Cerebellar extracellular recordings
Some aspects of the recordings used in the present paper have been reported in previous publications, and the details concerning the general surgical and recording procedures, histological procedures, mapping of cells to specific zebrin bands or physiologically defined zones, and the specific locations of the recorded cells can be found in those publications (Sugihara et al. 2007 b; Wise et al. 2010; Xiao et al. 2014).
In brief, recordings were made under ketamine–xylazine anaesthesia in either adult (∼250–200 gm) female Sprague–Dawley rats (breeders: Taconic Biosciences and Charles River) (experiments in which cells were localized to specific zebrin bands) or adult male Wistar rats (experiments in which cells were localized to physiologically defined zones). Animals had free access to food and water while housed in the vivarium. In all of the zebrin band experiments, anaesthesia was induced by an injection of ketamine (100 mg kg−1) and xylazine (8 mg kg−1) intraperitoneally. Supplemental anaesthetic was given as a continuous injection via a femoral catheter whose rate was gradually increased over the first hour of the experiment (final rates: ketamine, ∼260 μg kg−1 min−1; xylazine, ∼50 μg kg−1 min−1) to maintain a constant depth of anaesthesia, which was regularly assessed by paw pinch. SS recordings were made several hours after the start of the continuous i.v. infusion. In all of the physiologically defined zone experiments, anaesthesia was induced by an injection of ketamine (100 mg kg−1) and xylazine (5 mg kg−1) intraperitoneally. Anaesthetic depth was regularly assessed by paw pinch and supplemental doses of anaesthetic were given as needed.
In most of the zebrin band experiments, a single electrode arrangement was used to record CS and SS activity at the PC layer, as judged by electrode depth (∼250 μm), by the presence of both CSs and SSs, and by the predominant positive polarity of the CS. In these experiments histological controls were used to localize every PC to a specific zebrin band (Fig. 1 A), as described in detail previously (Xiao et al. 2014). For one analysis (see Fig. 6 C) multielectrode recordings of CS activity were obtained with electrodes implanted to the middle depths (100–150 μm) of the molecular layer where CS, but not SS, activity was observed (dendritic CSs). In these experiments localisation of PCs to specific bands was performed as described in the original paper (Sugihara et al. 2007 b). In the physiological zone experiments, recordings were all made at or near the PC layer, as judged by the same criteria as in the zebrin experiments. The localisation criteria are described in Wise et al. (2010). The zebrin band recordings were made at New York University, USA, whereas the zonal recordings were performed at University of Bristol, UK.
Figure 1. Localization of PCs and recordings of Z+ and Z− PC activity.
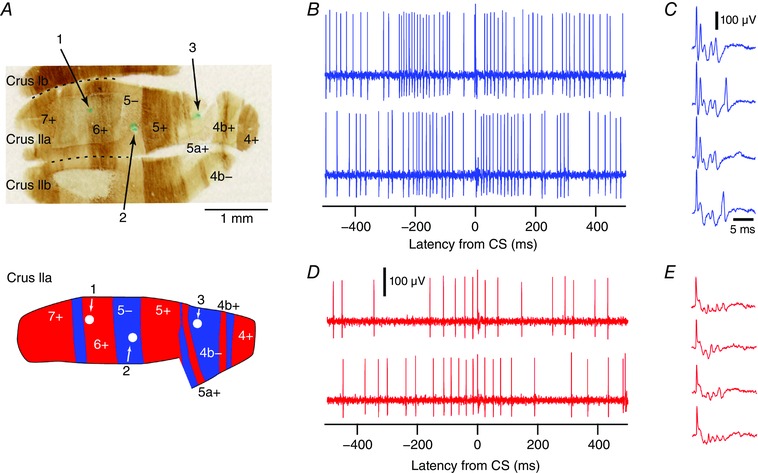
A, top, zebrin‐stained histological section through lobules crus Ib, IIa and IIb. Numbers on section indicate zebrin bands. Numbered arrows point to alcian blue injections that were made at three sites of PC recordings. Bottom, schematic diagram showing location of the three cells in zebrin bands 6+, 5− and 4b−. B–D, sample extracellular records from Z− (B and C) and Z+ (D and E) PCs. B and D, records chosen to show the standard pattern of SS modulation observed in CS triggered histograms for Z− and Z+ PCs (see Fig. 2). Records aligned to the onset of the CS (latency = 0 ms). C and E, sample CSs from the Z− and Z+ PCs in B and D, respectively, displayed at a faster time scale to show the spikelet content of the CS. The colour conventions used in this figure (Z−, blue and Z+, red) are also used in all subsequent figures. [Color figure can be viewed at wileyonlinelibrary.com]
Figure 6. Z− and Z+ PCs have similar total spikelet number distributions.
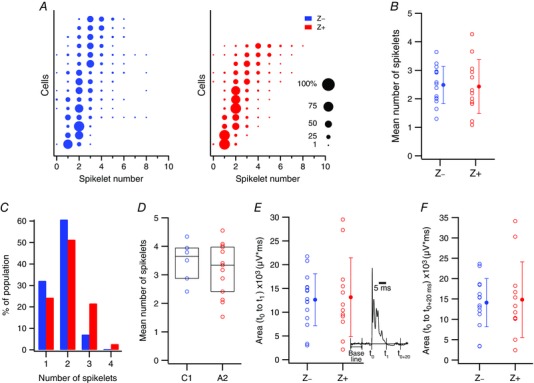
A, distribution of spikelets for each cell recorded at the PC layer and localized to a specific zebrin band. Each row of circles represents the spikelet distribution for a single PC. Circle areas are proportional to the percentage of CSs of a cell having a particular number of spikelets. The distributions are arranged from bottom to top according to their mean spikelet number. B, mean number of spikelets/CS for each PC (open circles). Filled circles show population averages. C, distribution of spikelet numbers for average CS waveforms of PCs recorded by electrodes implanted to the mid molecular layer (dendritic CSs). Z− data is plotted as the left bar and Z+ as the right bar for each spikelet number. D, the mean number of spikelets/CS is plotted for each C1 and A2 cell as a blue (Z−) or red (Z+) circle. Horizontal bar and box give population median and interquartile range. E and F, overall size of CS, as quantified using the area under the CS waveform from its onset (t 0) until its termination defined either as when the recording trace returned to baseline (t 1) (E) or 20 ms after the onset of the CS (t 0+20ms) (F). Cells are from the zebrin‐localized PC layer recordings. Individual PC data (unfilled circles) and population averages (filled circles) are plotted. Inset in E displays an averaged trace of CSs from a PC to show the various parameters that were used to quantify the shape of the CS waveform. [Color figure can be viewed at wileyonlinelibrary.com]
In all experiments rectal temperature was maintained at ∼37°C. To gain access to the cerebellum, animals were placed in a stereotaxic frame, and a craniotomy was performed to expose the posterior lobe. For the zebrin band experiments, at the conclusion of the recording session animals were immediately perfused under ketamine–xylazine anaesthesia with phosphate buffered saline (PBS) followed by 3% paraformaldehyde PBS solution to allow histological identification of the locations of the recorded cells. For the physiological zone experiments, at the conclusion of the experiment, all animals were humanely killed by an overdose of anaesthetic (pentobarbitone, 200 mg ml−1, i.p.) followed by dislocation of the neck.
Statistical analyses
To investigate SS–CS interactions in isolation of direct CS–CS interactions, CSs that were preceded by another CS within 500 ms were excluded from analyses looking at SS–CS interactions, because prior work has shown CS–CS interactions may occur for at least several hundred milliseconds. In particular, the waveform of the CS evoked by inferior olivary stimuli can be altered by a preceding CS at ISIs up to ∼150 ms (Campbell & Hesslow, 1986a). Moreover, climbing fibre responses show paired pulse depression that can last for at least 500 ms (Hashimoto & Kano, 1998). Lastly, based on interspike interval plots, CSs tend to occur either at ISIs of around ∼1 s or, less often, at short ISIs of around 100–200 ms, with intermediate ISIs being relatively rare, which suggests that CSs separated by short and long ISIs represent distinct groups, particularly as the level of synchronization differs between the two groups of CSs (Lang, 2001).
For the zebrin localized, somatically recorded PCs, both SSs and CSs were detected and sorted offline in Igor Pro (Wavemetrics, Lake Oswego, OR, USA). Cross‐correlation between the firing times of SSs and CSs was used to identify a post‐CS pause in SSs, which confirmed that the SSs and CSs were recorded from the same PC. The numbers of spikelets of somatically recorded CSs were counted from the individual spikes, because the high signal‐to‐noise ratio of these recordings allowed clear separation of spikelets from noise fluctuations (Fig. 1 C and E). To count spikelet numbers, all CS waveforms were high‐pass filtered at 300–400 Hz and automatically processed by a custom‐written procedure, which detected all deflections with a peak‐to‐peak level exceeding a pre‐defined threshold level. The counts were then manually verified, and necessary deletions and/or additions were made to adjust the final counts. The cells recorded from physiologically located zones were analysed in a similar manner, using CED 1401 analog‐to‐digital converter and Spike2 software (CED, Cambridge, UK).
Dendritic CSs were also sorted offline. The lower signal‐to‐noise ratio of these CSs precluded counting of spikelets from the individual CS waveforms; thus, spikelet numbers were determined from the average CS waveform of each PC as follows. All CS waveforms of PCs during 20 min of spontaneous activity were aligned to the time of the initial deflection and averaged. Each negative deflection of the waveform that crossed a threshold was counted as a spikelet, where the threshold was defined as 10× the standard deviation of the average waveform over an approximately 5 ms period near its end.
All distributions were tested for normality using the Kolmogorov–Smirnov goodness‐of‐fit test. For normally distributed populations, Student's t test for populations with different variances was used to assess significance (Wonnacott & Wonnacott, 1977); otherwise a non‐parametric test was used as indicated in the text. Values in the text are given as mean ± standard deviation (SD) unless otherwise stated. In the figures * indicates statistical significance (P < 0.05) and t indicates a trend toward significance (0.05 < P < 0.10).
Results
The main dataset consisted of PCs that were recorded at or near the PC layer and localized histologically to a specific zebrin band in crus IIa (n = 27 PCs total; 15 Z− and 12 Z+ cells; 8 animals). Between 1 and 3 Z+ and/or 1 and 3 Z− PCs were recorded from any one animal. Alcian blue dye injection at the recording site was used to identify the location of the PC (Fig. 1 A). Sample recordings of two such localized PCs are shown in Fig. 1 B–E.
SS firing rate modulation is associated with CS activity
To see the general contour of CS‐associated modulation of SS activity, the time surrounding each CS was divided into overlapping 50 ms windows (25 ms shift between successive windows). The relative change in SS activity, ΔFR/FRavg, in each window was then calculated for each PC as: (SS rate in window − average SS firing rate)/average SS firing rate. The population averages of ΔFR/FRavg were then plotted for the windows surrounding the CS with the value in each window plotted at its centre time (Fig. 2 A).
Figure 2. CS‐associated changes in SS activity.
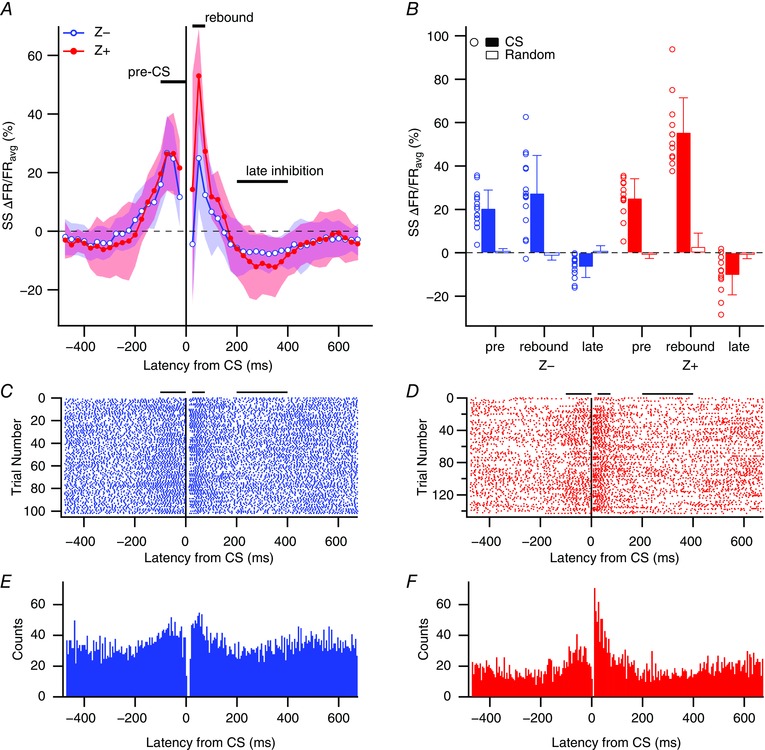
A, percentage change in SS firing rate from average firing rate (ΔFR/FRavg) for 50 ms windows relative to CS onset (t = 0 ms). Data points are the mean changes for the Z− (blue, unfilled circles) and Z+ (red, filled circles) populations at each time window, and are plotted at the centre time of the corresponding window. The lighter shaded regions show the SD about the means. The three main analysis periods (pre‐CS, rebound and late inhibition) are defined by horizontal lines in A. Note that the window from −25 to 25 ms was not plotted as it would contain a mix of pre‐ and post‐CS activity as well as the CS itself. B, plot of ΔFR/FRavg values for Z+ and Z− cells for the three epochs defined in A. Circles show individual cell values. Filled bars indicate the population average ΔFR/FRavg values for each epoch. Unfilled bars show population averages obtained using randomized spike trains in place of CS data. For each cell, a randomized spike train was generated with the same number of spikes as CSs for the cell. These random spikes were used to generate the individual cell spike‐triggered histograms of SS activity from which the ΔFR/FRavg values were calculated. Error bars indicate 1 SD in this and all subsequent figures. C and D, CS‐triggered rasters of SS activity for a Z− (C) and Z+ (D) PC. Horizontal bars above the rasters define the three analysis periods. E and F, CS‐triggered histograms of SS activity for the PCs whose rasters are shown in C and D. [Color figure can be viewed at wileyonlinelibrary.com]
The average modulation of SS activity associated with CSs showed a similar time course for the Z− and Z+ populations (Fig. 2 A). Prior to the CS, SS activity first decreased slightly (−400 to −200 ms) and then increased significantly during the 200 ms immediately preceding the CS. Following the CS, SS activity decreased during the initial 50 ms period (largely because the post‐CS pause in SS activity is included in this period), transiently rebounded, and then dipped below baseline levels for an extended, several hundred millisecond period.
Although the changes in SS rates of the Z− and Z+ populations followed a similar time course, there were differences in the amplitude of these changes (Fig. 2 A). For example, after peaking approximately 100 ms before the CS, SS rates remained near their peak levels in Z+ PCs in the −50 to 0 ms period, but dropped by about half in Z− PCs (Z− cells, latency −100 to −50 ms or −75 to −25 ms vs. −50 to 0 ms, P = 0.017). Also, the magnitude of the post‐CS modulation of SS activity was greater in the Z+ positive cells. These analyses were repeated using 200 ms as the minimum inter‐CS interval for including a CS in the analysis, and essentially similar results were obtained (data not shown), indicating that the exact choice of ISI for CS classification was not critical.
To simplify the presentation of the results, three specific epochs were defined based on the SS modulation observed in Fig. 2 A: (1) a pre‐CS period (−100 to 0 ms) where a rise in SS activity occurs; (2) a rebound period (25–75 ms) where there is again high SS activity, and (3) a late inhibition period (200–400 ms) where SS activity is depressed (Fig. 2 A). These times were chosen because they showed the largest ΔFR/FRavg values for the two populations. Figure 2 B plots the ΔFR/FRavg values for each epoch for each PC (circles) and the average of the population (filled bars). Finally, the population averages of ΔFR/FRavg from histograms using randomized CS data as the trigger events are plotted (unfilled bars; see figure legend for details on the generation of the random data). Comparison of the ΔFR/FRavg values obtained with CS activity and randomized spike trains shows that the modulation of SS activity for all three periods was significant for both Z− and Z+ PCs (Fig. 2 B and Table 1). Moreover, although the modulation pattern of Z− and Z+ PCs was qualitatively similar, the amplitude was larger for Z+ PCs on average, with the difference being statistically significant for the rebound period (Fig. 2 B and Table 1, rightmost column). Raster displays and CS‐triggered histograms from individual PCs show example Z− and Z+ PCs (Fig. 2 C–F). It is worth noting that although the Z− and Z+ populations showed significant modulation in all three time periods (and showed differences between themselves), the distributions of the two populations overlapped considerably.
Table 1.
ΔFR/FRavg in SS activity from baseline for periods surrounding CSs
| Z− | Z+ | ||||
|---|---|---|---|---|---|
| ΔFR/FRavg | ΔFR/FRavg | P | |||
| Time period and CS group | Avg ± SD (%) | P | Avg ± SD (%) | P | (Z− vs. Z+) |
| Pre‐CS | 20.5 ± 8.4 | 2.7 × 10⁻⁷ | 25.5 ± 9.0 | 5.2 × 10⁻⁸ | 0.18 |
| Rebound | 27.4 ± 17.4 | 2.0 × 10⁻⁵ | 55.5 ± 15.9 | 1.0 × 10⁻⁸ | 2.0 × 10⁻⁴ |
| Late Inhib. | −6.6 ± 4.9 | 1.8 × 10⁻⁴ | −10.3 ± 9.1 | 1.0 × 10⁻³ | 0.22 |
Comparison of ΔFR/FRavg values for different time periods. P‐values listed to the right of each ΔFR/FRavg are for comparison between CS and random spike trains. P‐values in rightmost column are for comparison of Z− and Z+ values.
Pre‐ and post‐CS modulation of SS activity correlated for PCs, but not for individual CSs
To examine whether there is any relationship between the SS activity leading up to the CS and that following it, the ΔFR/FRavg values for the pre‐CS period were correlated with those of the rebound and late inhibition periods (Fig. 3). Similarly directed relationships were found for both Z+ and Z− populations. In particular, the changes in activity in the pre‐CS and late inhibition periods were negatively correlated for both Z− and Z+ populations (Fig. 3 B and D). The correlation between activity in the pre‐CS and rebound periods was not significant for either of the two zebrin populations individually (Fig. 3 A and C); however, the relationship was similarly directed in both populations, and when they were combined, the correlation was significant (r = 0.51, P = 0.007); the correlation between pre‐CS and late inhibition periods for the combined population was significant as well (r = −0.60, P = 0.0009). The above analyses indicate that for both Z− and Z+ populations, PCs that have large SS increases before a CS also tend to have a larger rebound response followed by a greater decrease in SSs during the late inhibitory phase.
Figure 3. Correlation of pre‐ and post‐CS modulation of SS activity across PCs.
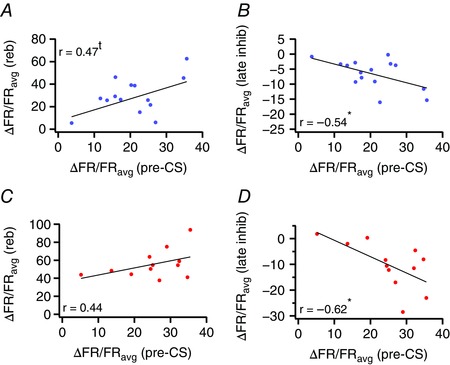
Scatter plots of the ΔFR/FRavg for the pre‐CS period vs. the rebound (A and C) and the late inhibition (B and D) periods show the correlation between changes in SS activity before and after the CS. Each point plots the average ΔFR/FRavg values from a single PC. Regression lines are least squares fits. *Statistical significance (P < 0.05); t indicates a trend toward significance (0.05 < P < 0.10). [Color figure can be viewed at wileyonlinelibrary.com]
Next, we investigated whether the modulation of pre‐ and post‐CS SS activity was correlated for the CSs of individual PCs. The correlation coefficient of the ΔFR/FRavg values of the pre‐CS period and post‐CS periods for individual CSs was calculated for each PC. In general, the r‐values were small for both Z+ and Z− PCs, even though the population average was statistically different from zero in one case (Fig. 4).
Figure 4. Spike by spike correlation of pre‐ and post‐CS modulation of SS activity.
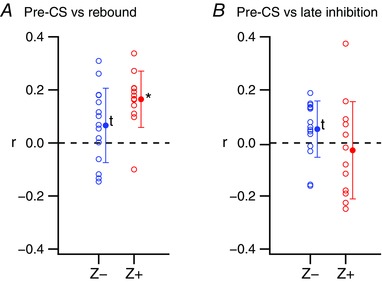
The ΔFR/FRavg in the pre‐ and post‐CS periods were correlated across all CSs for individual PCs. The individual PC r‐values (open circles) and population averages (filled circles) are plotted. A, correlation of ΔFR/FRavg values in the pre‐CS and rebound periods. B, correlation of ΔFR/FRavg values in the pre‐CS and late inhibition periods. *Statistical significance (P < 0.05); t indicates a trend toward significance (0.05 < P < 0.10). [Color figure can be viewed at wileyonlinelibrary.com]
In sum, the average magnitudes of the pre‐CS and the various post‐CS modulation phases are often correlated across the PC population, but the CS to CS fluctuations of SS activity before and after each CS in individual PCs are generally not related.
Bistability firing patterns cannot explain CS‐associated SS modulation
In certain instances PCs show a pattern of activity referred to as bistability in which there is an alternation of high SS firing rates (up state) with long pauses in SS activity (down state). Moreover, it has been reported that CSs can trigger jumps between these states (Loewenstein et al. 2005). Thus, we investigated whether bistability was present in the neurons we recorded and contributed to the SS modulation patterns we observed. The average duration of a pause in PCs exhibiting bistability is 1.5 s (Loewenstein et al. 2005). None of our neurons showed a single SS ISI of that length or greater. Figure 5 A shows, in raster format, ∼90 s of the spike trains from four PCs that were recorded. SSs are represented by the rows of vertical lines, and CSs by the circles above each row. Records 1 and 3 are typical trains and records 2 and 4 are from the Z− and Z+ cells showing the largest percentages of longer ISIs. In all records no ISI approaches 1.5 s. ISI histograms from the entire recordings of these four PCs confirm this and show the virtual absence of ISIs > 100 ms in most PCs (Fig. 5 B, cells 1 and 3) and their rarity even in the PCs with the highest percentage of longer ISIs (Figs 5 B, 2 and 4; note the change of scale for the y‐axis between the main and inset plots for all ISI plots).
Figure 5. Absence of bistability firing patterns in the recordings.
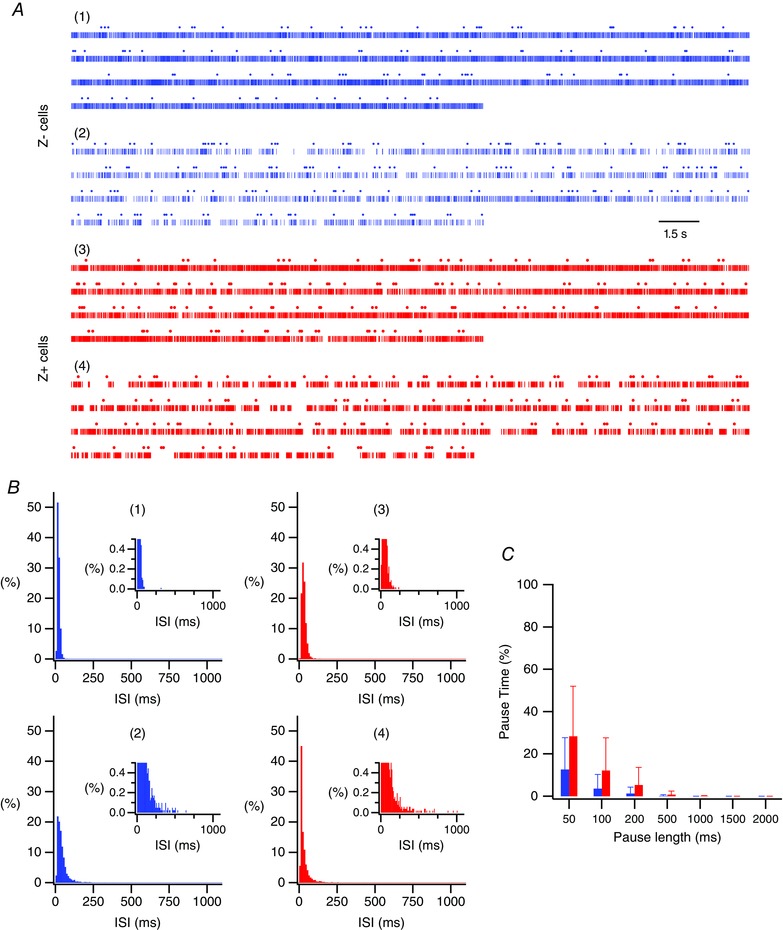
A, raster display of spike trains from four PCs. SSs plotted as vertical lines and CSs as small circles above the SS records. Records 1 and 3 show typical Z− and Z+ trains and records 2 and 4 show trains from the Z− and Z+ PCs showing the largest number of long ISIs. Note that even the longest ISIs are much shorter than 1.5 s. B, ISI histograms from cells 1–4 shown in A. Insets have an expanded y‐axis to show the counts of the longer ISIs. C, the percentage of the total recording time accounted for by ISIs of a specific duration or greater is plotted for ISIs of 50 ms or greater, as indicated on the x‐axis. Pause time percentages were calculated by summing all ISIs of the specified duration or longer and dividing by the recording time. Bars represent averages of the Z− (left bars at each pause length) and Z+ (right bars at each pause length) populations. [Color figure can be viewed at wileyonlinelibrary.com]
A recent study reported that PCs recorded from cool or damaged tissues have an increased frequency of bistable firing patterns, as indicated by a larger percentage time spent in long SS ISIs, which were defined as ISIs ≥ 500 ms (Zhou et al. 2015). Thus, as a further test of whether our cells showed behaviour suggestive of damaged tissue, the percentage of the total recording time accounted for by SS ISIs of a particular duration or greater was calculated for durations between 50 and 2000 ms (Fig. 5 C). These calculations showed that essentially no time was spent in long pauses (≥ 500 ms) by either Z+ or Z− PCs. Moreover, the long pause percentages for ISIs ≥ 500 ms in our population are far lower than those reported for PCs from damaged tissue, and in contrast, closely match the values reported for PCs recorded from healthy tissue (Zhou et al. 2015). Lastly, no significant difference was found between the Z− and Z+ populations at any of these pause lengths (P < 0.05, Wilcoxon–Mann–Whitney test). In sum, these results indicate that bistability was not a factor in explaining the SS modulations or the differences in these modulations between Z− and Z+ PCs that were observed.
Average number of spikelets/CS is the same for Z− and Z+ PCs in vivo
Some, but not all, previous studies have found a relationship between spikelet numbers and the levels of SS and/or CS activity (e.g. compare Mano, 1970; Gilbert, 1976; Burroughs et al. 2017). In addition, average spikelet numbers in Z− and Z+ PCs were reported to differ under in vitro conditions (Paukert et al. 2010). Thus, we investigated whether the characteristics of spikelets differed between Z− and Z+ PCs in vivo, whether SS activity correlated with any spikelet parameters, and whether these correlations varied between the zebrin populations.
In terms of basic spikelet parameters, the two populations were quite similar. PCs in both populations showed similarly wide ranges of spikelet numbers (Fig. 6 A; average range of spikelets for a PC, Z−: 5.00 ± 2.04, n = 15; Z+: 4.42 ± 1.88, n = 12). Furthermore, both populations were similarly heterogeneous in terms of the individual cell spikelet distributions, with some cells tending to generate CSs with predominantly one or two spikelets (Fig. 6 A, lower rows) and other cells having CSs with much higher numbers of spikelets (Fig. 6 A, upper rows), on average.
In terms of average number of spikelets per CS, no difference was found between the Z− and Z+ populations (Fig. 6 B; Z−: 2.49 ± 0.65; Z+: 2.43 ± 0.95; P = 0.87), in contrast to what was reported for in vitro conditions (Paukert et al. 2010). Moreover, individual Z− and Z+ PCs showed similar variability in spikelet numbers, as measured by the SD of each PC's spikelet distribution (Z−: 0.90 ± 0.29; Z+: 0.79 ± 0.28; P = 0.30). Because our finding of no difference in average number of spikelets per CS differs from the previously reported in vitro findings, we compared spikelet numbers for two further sets of PCs.
The first additional set comprised crus IIa PCs recorded for a previous study using a multielectrode approach in which PCs were localized to specific zebrin bands (n = 65 PCs total; 37 Z+ and 28 Z− cells; 6 animals) (Sugihara et al. 2007 b). This approach allowed comparison of Z− and Z+ PCs recorded simultaneously, and thus under identical conditions. In these experiments, spikelet content was characterized by first obtaining the average CS waveform of each PC and then determining the number of significant peaks in the average (see Methods for details). No statistically significant difference in peak number between Z− and Z+ PC populations was found for any of the six experiments (P > 0.05 all six cases) nor was one found when all PCs were grouped into single Z− and Z+ populations (Fig. 6 C; Z−: median 2; Z+: median, 2; P = 0.16, Wilcoxon–Mann–Whitney).
Next, to expand the territory from which recordings were made, and thus verify that the failure to find a difference in average spikelet numbers between Z− and Z+ PCs was not specific to crus IIa PCs, we used data from experiments performed in a second laboratory in which recordings were obtained from PCs that were localized to the C1 (largely Z−) and A2 (largely Z+) physiological zones of several additional lobules (n = 19 total; 13 A2 and 6 C1 cells; 12 animals, for specific break down by lobule, see Table 2). (For evidence supporting the validity of using the zonal identification as a surrogate for zebrin identity, see Xiao et al. 2014.) No significant differences were found between PCs in the C1 and A2 zones (Fig. 6 D; C1: 3.48 ± 0.72, median = 3.65, n = 6; A2: 3.18 ± 0.93, median = 3.34, n = 13; P = 0.64, Wilcoxon–Mann–Whitney), consistent with there being no difference in spikelet numbers for Z− and Z+ PCs.
Table 2.
Spatial distribution of the recorded cells
| A. | Zebrin band | Somatic | Dendritic |
|---|---|---|---|
| Crus IIa 4− | 1 | 3 | |
| Crus IIa 4b+ | 1 | — | |
| Crus IIa 4b− | 2 | 4 | |
| Crus IIa 5a+ | 3 | — | |
| Crus IIa 5a− | 2 | — | |
| Crus IIa 5+ | 4 | 20 | |
| Crus IIa 5− | 10 | 13 | |
| Crus IIa 6+ | 4 | 15 | |
| Crus IIa 6− | — | 8 | |
| Crus IIa 7+ | — | 2 | |
| Sum | 27 | 65 |
| B. | Physiological zone | Somatic |
|---|---|---|
| Crus II A2 | 8 | |
| Crus IIb A2 | 1 | |
| Paramedian A2 | 4 | |
| Paramedian C1 | 2 | |
| Copula Pyramidis C1 | 4 | |
| Sum | 19 |
A: the zebrin bands for all PCs were histologically identified. Some of the cells were recorded at the PC layer (Somatic); others were recorded at the mid‐molecular layer (Dendritic). B: the zonal locations of an additional sample of PCs were physiologically determined. All cells were somatically recorded. The A2 zone comprises mainly Z+ bands while the C1 zone comprises mainly Z− bands.
Finally, the area under the CS waveform was used as a more general parameter to investigate differences in CS waveform. This area was calculated from the onset of the CS (t 0) to either the time when the recording trace first returns to baseline (t 1) or to 20 ms after t 0 (t 0+20ms) (Fig. 6 E inset). Using the latter interval, a difference was found in vitro (Paukert et al. 2010); however, in vivo neither measure showed a significant difference between Z− and Z+ PCs (P > 0.05; Fig. 6 E and F).
Variations in spikelet numbers are primarily related to variations in presumed non‐propagated spikelet numbers
Only some spikelets are propagated as axonic action potentials (Ito & Simpson, 1971; Khaliq & Raman, 2005; Monsivais et al. 2005), raising the issues of whether variations in spikelet numbers are related to a particular class (propagated vs. non‐propagated) of spikelet and of whether zebrin‐related differences exist in this variation between PCs.
We could not directly measure the number of axonal spikes resulting from each CS; however, the probability that a spikelet leads to an axonal spike is a function of its interspikelet interval from the preceding spikelet: longer interspikelet intervals are associated with increased probability of propagation (Khaliq & Raman, 2005; Monsivais et al. 2005). Specifically, spikelets that occur at an interspikelet interval of ≥ 2.4 ms have a ≥ 50 % chance of being propagated (Monsivais et al. 2005). Thus, the interspikelet interval of 2.4 ms was used to classify spikelets as likely propagated or not.
Using this criterion, the mean numbers of likely propagated and of non‐propagated spikelets did not differ between the Z− and Z+ populations (Fig. 7). Note that the plotted values for total (All) and likely propagated spikelets do not include the initial spike of the CS, which is always propagated as well. Thus, including the initial spike, on average, just over two axonic spikes are triggered by each CS for both Z− and Z+ PCs.
Figure 7. The numbers of total (All), likely non‐propagated (Non‐prop), and likely propagated (Prop) spikelets are similar for Z− and Z+ PCs.
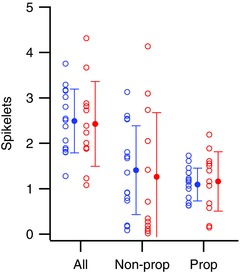
Open circles indicate average number of spikelets for individual PCs. Filled circles indicate population averages. [Color figure can be viewed at wileyonlinelibrary.com]
Spikelet numbers vary between PCs (note the shift of the spikelet number distributions from top to bottom in Fig. 6 A for both Z− and Z+ populations) and from spike to spike for individual cells. Thus, we next analysed whether these variations were primarily due to changes in likely propagated and/or non‐propagated numbers of spikelets. Plots of average total (All) spikelets vs. either non‐propagated or propagated spikelets were made for Z− (Fig. 8 A and B) and Z+ (Fig. 8 C and D) populations. For both Z− and Z+ populations, a strong positive correlation was observed between total and non‐propagated spikelet numbers. In contrast, a weaker negative correlation was seen between total and propagated spikelet numbers that was statistically significant only for the Z− population. Thus, PCs with greater numbers of spikelets have CSs with more non‐propagated spikelets on average, and, at least among Z− PCs, reduced numbers of propagated spikelets.
Figure 8. Variations in total spikelet numbers between PCs are correlated with variations in the number of likely non‐propagated spikelets.
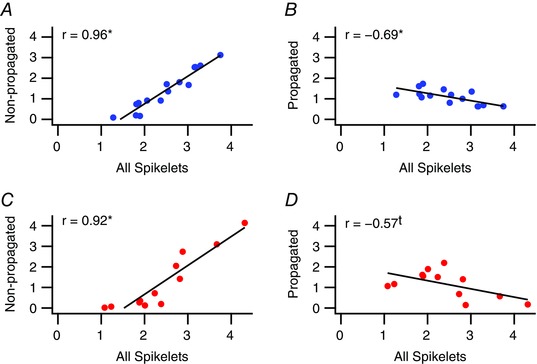
Scatterplots of the average total number of spikelets of a PC vs. the average number of likely non‐propagated (A and C) and likely propagated (B and D) spikelets. *Statistical significance (P < 0.05); t indicates a trend toward significance (0.05 < P < 0.10). [Color figure can be viewed at wileyonlinelibrary.com]
Next, we investigated whether similar correlations held across the CSs of individual PCs. A high correlation of total and non‐propagated spikelet numbers was found for the CSs of individual PCs for both Z− and Z+ PCs (Fig. 9, Non vs. All). In contrast, the average correlation between propagated and total spikelets was much weaker, although still significantly different from zero (Fig. 9, Prop vs. All). Note that the few PCs showing large correlations between total and propagated spikelets were those PCs in which almost all spikelets were classified as propagated. Significant negative correlations were found between propagated and non‐propagated spikelets in both Z− and Z+ cells (P < 0.05).
Figure 9. Spike by spike variations in total spikelet numbers primarily are correlated with variations in the number of likely non‐propagated spikelets.
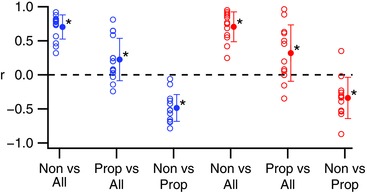
Open circles show r‐values for individual cells. Filled circles show population averages. Types of spikelets being correlated are indicated on x‐axis. [Color figure can be viewed at wileyonlinelibrary.com]
Z−, but not Z+, PCs show a relationship between spikelet numbers and average SS firing rate
To assess the relationship between spikelet number and SS firing rate, the average number of spikelets/CS was plotted as a function of SS rate for the Z+ and Z− populations. When considering all spikelets, the Z+ population showed a significant negative correlation (Fig. 10 Aa; P < 0.05). This correlation appears to be due to variation of the non‐propagated spikelets with SS rate, as a significant negative correlation was found for this relationship as well (Fig. 10 Ac; P < 0.05), whereas the number of likely propagated spikelets was not significantly correlated with SS rate (Fig. 10 Ab; P > 0.05). In contrast, the Z− population showed no significant correlation between SS rates and all, propagated, or non‐propagated spikelet numbers (Fig. 10 B).
Figure 10. Spikelet numbers are negatively correlated with average SS firing rate for Z+ but not Z− PCs.
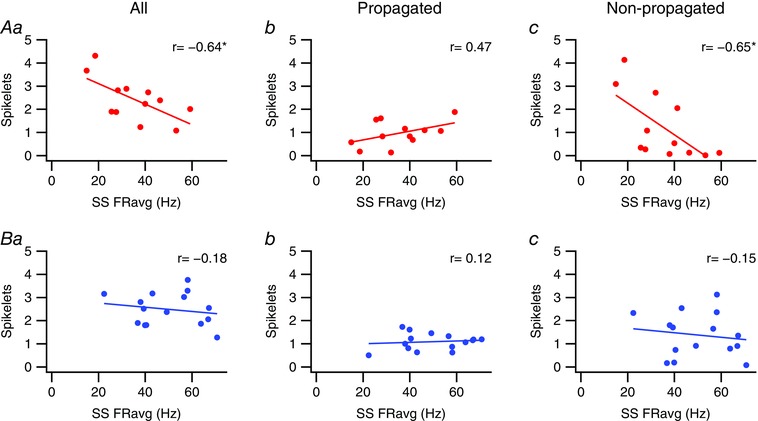
Scatter plots of average SS firing rate for Z+ (A) and Z− (B) PCs vs. their average number of total, likely propagated, and likely non‐propagated spikelets. *Statistical significance (P < 0.05). [Color figure can be viewed at wileyonlinelibrary.com]
Relationship of spikelets to the CS‐associated modulation of SS activity
We next investigated whether spikelet numbers were related to changes in SS activity during the pre‐CS, rebound, and late inhibition periods. For each PC, the number of spikelets in each of its CSs was correlated with the ΔFR/FRavg for each of the three time periods surrounding the corresponding CSs (Fig. 11). When considering all spikelets, significant correlations were found for the pre‐CS and late inhibition periods for Z− but not Z+ cells (Fig. 11 Aa and Ba, data plotted at latencies of −50 ms and 300 ms). For the Z− cells, the correlation of total spikelet number and pre‐CS activity seemed to be due to variations in propagated spikelets, as these spikelets correlated with the pre‐CS ΔFR/FRavg, whereas the non‐propagated ones did not (Fig. 11 Ab vs. Ac, −50 ms latency). Although total spikelet number did not correlate with changes in SS activity for Z+ cells, the number of propagated spikelets was significantly correlated with SS activity leading up to the CS (Fig. 11 Bb, −50 ms) and the number of non‐propagated spikelets was correlated with the decrease in SS levels in the late inhibition period (Fig. 11 Bc, 300 ms).
Figure 11. CS‐associated modulation of SS activity is sometimes correlated with spikelet numbers.
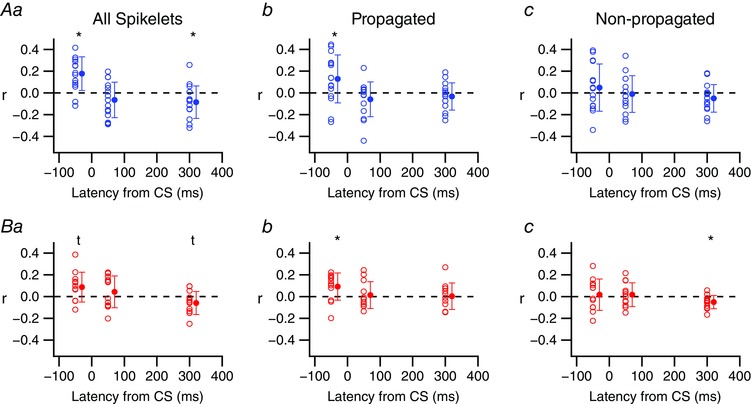
Plots of the CS by CS correlation of spikelet number with the ΔFR/FRavg for the pre‐CS (−50 ms), rebound (50 ms) and late inhibition (300 ms) periods. Unfilled circles show individual PC r‐values. Filled circles are population averages. *Statistical significance (P < 0.05); t indicates a trend toward significance (0.05 < P < 0.10). [Color figure can be viewed at wileyonlinelibrary.com]
Discussion
In this paper we describe several new aspects of the modulation of SS activity associated with CSs. In particular, we show that the SS rates during the pre‐ and post‐CS phases of the modulation may be well correlated with each other across a PC population, but are generally not correlated for the CSs of individual PCs. We also identified several physiological parameters related to the interaction of CS and SS activity, including the zebrin status of the PC and spikelet numbers. The implications of these results for several hypotheses related to cerebellar physiology are discussed below.
Pre‐CS associated modulation of SS activity
While a number of studies of post‐CS modulation of SS activity exist, to our knowledge there has been only one report of pre‐CS modulation of SS activity (Miall et al. 1998) prior to our recent study (Burroughs et al. 2017). The study of Miall et al. (1998) reported an increase in SS activity between 100 and 150 ms before the occurrence of a CS. The specificity of this interval was viewed as important because it was ‘close to the estimated visuomotor feedback delay’, and thus would match the timing needed for an error signal to allow adaptive plasticity. The data used in that paper were from PCs that were mostly located in lobules of the anterior lobe (Keating & Thach, 1995), making it likely that Z− PCs formed the majority of their population, based on the predominance of Z+ territory in the anterior lobe. Thus, the transient pre‐CS rise in SS activity observed in that study is generally consistent with what we observed for Z− PCs, whose SS activity is high at 150–100 ms preceding the CS and then drops toward baseline in the 50 ms just prior to the CS.
However, we found that Z+ PCs, in contrast to Z− PCs, show a more sustained increase in SS activity up to the time of the CS, and thus do not exhibit a narrow time window of increased SS activity. This implies that the SS increase in Z+ PCs would not be specifically matched to the feedback delay of an error signal generated during a motor task. Therefore, our data are inconsistent with the idea that excessive SS activity triggers a corrective CS at a precisely timed delay as a rule governing plasticity throughout the cerebellar cortex, though we cannot rule out the possibility for Z− regions.
Does the CS‐associated modulation of SS activity reflect the workings of a homeostatic mechanism?
The question of whether the SS modulation phases are related to, or are independent of, each other for individual CSs bears on the question of whether CS activity is a homeostatic mechanism that acts to maintain SS activity at a specific baseline rate (Mauk & Donegan, 1997; Miall et al. 1998; Cerminara & Rawson, 2004; Bengtsson & Hesslow, 2006; Zhou et al. 2014; De Zeeuw & Ten Brinke, 2015). That is, rises in SS activity have been proposed to cause a disinhibition of the inferior olive, via increased inhibition of the GABAergic nucleo‐olivary neurons, which would result in an increase in CS activity, which in turn would act to reduce SS levels. Consistent with this idea manipulations of SS activity do produce correlated changes in CS activity (Marshall & Lang, 2009; Chaumont et al. 2013), and manipulations of inferior olivary activity produce inverse changes in SS levels (Colin et al. 1980; Rawson & Tilokskulchai, 1981; Montarolo et al. 1982; Demer et al. 1985; Savio & Tempia, 1985; Cerminara & Rawson, 2004). However, in these studies the SS levels of large populations of neighbouring PCs or inferior olivary neurons were simultaneously modified, which is unlikely to be the case in most physiological situations. Thus, the action of this feedback loop under physiological conditions remains to be demonstrated.
Moreover, if the homeostasis idea is correct on a single cell level, there should be a strong relationship between the SS activity before and after each CS of individual PCs. However, we observed only weak, generally not significant correlations between the amplitudes of the pre‐ and post‐CS modulation phases of individual CSs. Furthermore, in most PCs, following a CS, SS activity generally went through a period during which it undershot its baseline level (late inhibition period) rather than returning to it, as would be predicted by the homeostasis hypothesis. Thus, the CS‐associated modulations in SS activity seem unlikely to reflect the workings of a homeostatic mechanism.
Instead, we suggest that CS‐associated SS modulation is an important aspect of the communication between PCs and their targets, principally the DCN. Consistent with this suggestion, is the fact that although CS activity appears to cause a short‐latency inhibition of cerebellar nuclear activity by its direct action, the timing of additional aspects of the DCN responses to CS activity appear to reflect the multiphasic pattern of simple spike modulation we describe here (Tang, Blenkinsop, Suh and Lang, unpublished data). Finally, even if the homeostasis hypothesis is not correct, it may still be the case that SS activity is in some way regulated by the feedback loop through the inferior olive, though for reasons other than maintaining a specific SS baseline firing rate.
Variations in non‐propagated spikelet numbers are the main determinant of spikelet number
The CS has often been viewed as an all‐or‐none event. The variation in CS waveform we describe here is at odds with this conception. Indeed, the variability of the CS waveform has been noted in a number of studies (Mano, 1970; Gilbert, 1976; Campbell & Hesslow, 1986b, 1986a,b; Piochon et al. 2007, 2010; Lang et al. 2014; Burroughs et al. 2017), and the limits of viewing the CS as simply an all‐or‐none event are being increasingly recognized (Najafi & Medina, 2013; Lang et al. 2017), which raises the issue of the function of this variability.
Some evidence suggests that spikelet number may be a parameter of synaptic plasticity (Mathy et al. 2009; Rasmussen et al. 2013; Yang & Lisberger, 2014). If these studies are correct, our result that in most PCs variations in total spikelet number are most strongly correlated with the number of likely non‐propagated spikelets suggests that plasticity is modulated primarily by varying this type of spikelet. This would potentially allow dissociation of the CS's role in modulating plasticity from its role in directly altering PC output. Moreover, the present finding that CSs of both zebrin populations have similar numbers of spikelets, on average, would indicate that while individual PCs may differ significantly in the plasticity their inputs are undergoing, on a population level the plasticity occurring in Z− and Z+ PCs is similar (at least to the extent that spikelet number determines the degree and type of plasticity).
In contrast to the variation in their non‐propagated spikelet numbers, PCs all had, on average, approximately one likely propagated spikelet per CS (i.e. two axonic spikes if the initial spike of the CS is included). The relative constancy of the number of propagated spikelets across PCs within each zebrin‐defined population, and the lack of difference between the Z− and Z+ populations, suggests that PCs are relatively homogeneous in terms of the average axonic output generated by the CS itself. However, note that most PCs exhibited a range of propagated spikelets, so the individual CSs of a PC could still vary in their effect on DCN neurons as a function of propagated spikelet number.
No zebrin‐related differences in average spikelet numbers in vivo
Z+ PCs have been reported to have more spikelets/CS on average than Z− PCs under in vitro conditions (Paukert et al. 2010). Such a difference would be potentially important for cerebellar function. However, under in vivo conditions we found no significant difference in average spikelet numbers between Z− and Z+ PCs. Several factors may underlie the differing results.
One is the use of GABA‐A receptor antagonists in the in vitro slice preparation, because basket and stellate cell activity reduces CS duration (Eccles et al. 1966) and because activation of these interneurons is reported to cause a greater inhibition of PCs in Z+ bands (Gao et al. 2006). Thus, the lack of GABAergic activity in the slice preparation may have resulted in a greater disinhibition of Z+ than Z− PCs, leading to a relatively greater increase in the duration of CSs in Z+ PCs, and thus the observation of differential spikelet numbers (Z+ > Z−). It is also possible that the use of ketamine anaesthesia in the present study may have prevented observation of spikelet differences, because ketamine blocks PC NMDA receptors, whose activity affects spikelet numbers (Piochon et al. 2007, 2010). However, the expression of NMDA receptors does not vary between Z− and Z+ regions (Hawkes, 2014). Moreover, many other zebrin‐related differences in PC firing patterns are similar in awake and ketamine anaesthetized animals (Xiao et al. 2014; Zhou et al. 2014).
Recording location is yet another possible explanation, as the in vitro study recorded vermis lobule VIII PCs (Paukert et al. 2010), whereas our zebrin‐identified PCs were mainly from crus IIA. However, our zonally identified populations included PCs from several additional lobules and, again, no difference in spikelet numbers was found. Thus, the failure to find a zebrin‐related spikelet difference in crus IIA and other lobules suggests, at the least, that a zebrin‐related difference in spikelet numbers is not a general pattern across the cerebellar cortex.
Zebrin‐related differences in the relationship between spikelet number and SS firing rates
As we reported previously, spikelet numbers seem to be correlated with some aspects of the CS‐associated modulation of SS activity (Burroughs et al. 2017). Here we showed that this is true for individual CSs from single Z− PCs for the pre‐CS and late inhibition phases of the modulation. Z+ PCs showed similar trends but as a population no statistically significant relationship was found. However, in all cases the correlations were relatively low, suggesting that there must be other factors that help determine the variations in SS activity at times surrounding the CS.
In contrast, a significant difference was found between Z− and Z+ PCs for the relationship between baseline SS rates and spikelets, with Z− PCs showing no correlation and Z+ PCs showing a significant negative relationship for both all spikelets and likely non‐propagated spikelets. It is not clear what exactly drives this relationship, and a number of possibilities exist. It may simply be that PCs whose CSs display greater numbers of spikelets undergo LTD to a greater extent (Mathy et al. 2009) and thus receive weaker excitatory drive, leading to lower firing rates. Alternatively, it could reflect a heterogeneity among Z+ PCs in membrane properties that is not found in Z− PCs. Regardless, this finding represents another difference in the operational principles governing Z− and Z+ PCs whose functional consequences need to be explored.
Additional information
Competing interests
The authors declare that they have no competing interests.
Author contributions
Conception or design: E.J.L., I.S., N.L.C. and R.A.; acquisition, analysis and interpretation of data: A.B., A.K.W., C.Y.S., E.J.L., I.S., J.X., L.J., N.L.C., R.A., S.P.M. and T.T.; drafting of work: EJL. All authors revised the article critically for important intellectual content. All authors have approved the final version of the manuscript and agree to be accountable for all aspects of the work. All persons designated as authors qualify for authorship, and all those who qualify for authorship are listed.
Funding
This work was supported by grants to E.J.L. from the National Science Foundation (IOS‐1051858) and the National Institute of Neurological Disorders (R21 NS095089); to I.S. from the Japan Society for the Promotion of Science (JSPS) (Grants‐in‐Aid for Scientific Research‐KAKENHI, 16K07025), and to N.L.C. and R.A. from the Medical Research Council UK (G1100626) and Wellcome Trust.
References
- Bell CC & Grimm RJ (1969). Discharge properties of Purkinje cells recorded on single and double microelectrodes. J Neurophysiol 32, 1044–1055. [DOI] [PubMed] [Google Scholar]
- Bengtsson F & Hesslow G (2006). Cerebellar control of the inferior olive. Cerebellum 5, 7–14. [DOI] [PubMed] [Google Scholar]
- Blenkinsop TA & Lang EJ (2011). Synaptic action of the olivocerebellar system on cerebellar nuclear spike activity. J Neurosci 31, 14708–14720. [DOI] [PMC free article] [PubMed] [Google Scholar]
- Bloedel JR, Ebner TJ & Yu Q (1983). Increased responsiveness of Purkinje cells associated with climbing fiber inputs to neighboring neurons. J Neurophysiol 50, 220–239. [DOI] [PubMed] [Google Scholar]
- Bloedel JR & Roberts WJ (1971). Action of climbing fibers in cerebellar cortex of the cat. J Neurophysiol 34, 17–31. [DOI] [PubMed] [Google Scholar]
- Burg D & Rubia FJ (1972). Inhibition of cerebellar Purkinje cells by climbing fiber input. Pflügers Arch 337, 367–372. [DOI] [PubMed] [Google Scholar]
- Burroughs A, Wise AK, Xiao J, Houghton C, Tang T, Suh CY, Lang EJ, Apps R & Cerminara NL (2017). The dynamic relationship between cerebellar Purkinje cell simple spikes and the spikelet number of complex spikes. J Physiol 595, 283–299. [DOI] [PMC free article] [PubMed] [Google Scholar]
- Campbell NC & Hesslow G (1986a). The secondary spikes of climbing fibre responses recorded from Purkinje cell somata in cat cerebellum. J Physiol 377, 207–224. [DOI] [PMC free article] [PubMed] [Google Scholar]
- Campbell NC & Hesslow G (1986b). The secondary spikes of climbing fibre responses recorded from Purkinje cell axons in cat cerebellum. J Physiol 377, 225–235. [DOI] [PMC free article] [PubMed] [Google Scholar]
- Cerminara NL & Rawson JA (2004). Evidence that climbing fibers control an intrinsic spike generator in cerebellar Purkinje cells. J Neurosci 24, 4510–4517. [DOI] [PMC free article] [PubMed] [Google Scholar]
- Chaumont J, Guyon N, Valera AM, Dugue GP, Popa D, Marcaggi P, Gautheron V, Reibel‐Foisset S, Dieudonne S, Stephan A, Barrot M, Cassel JC, Dupont JL, Doussau F, Poulain B, Selimi F, Lena C & Isope P (2013). Clusters of cerebellar Purkinje cells control their afferent climbing fiber discharge. Proc Natl Acad Sci USA 110, 16223–16228. [DOI] [PMC free article] [PubMed] [Google Scholar]
- Colin F, Manil J & Desclin JC (1980). The olivocerebellar system. I. Delayed and slow inhibitory effects: an overlooked salient feature of cerebellar climbing fibers. Brain Res 187, 3–27. [DOI] [PubMed] [Google Scholar]
- De Zeeuw CI & Ten Brinke MM (2015). Motor learning and the cerebellum. Cold Spring Harb Perspect Biol 7, a021683. [DOI] [PMC free article] [PubMed] [Google Scholar]
- Demer JL, Echelman DA & Robinson DA (1985). Effects of electrical stimulation and reversible lesions of the olivocerebellar pathway on Purkinje cell activity in the flocculus of the cat. Brain Res 346, 22–31. [DOI] [PubMed] [Google Scholar]
- Ebner TJ & Bloedel JR (1981a). Temporal patterning in simple spike discharge of Purkinje cells and Its relationship to climbing fiber activity. J Neurophysiol 45, 933–947. [DOI] [PubMed] [Google Scholar]
- Ebner TJ & Bloedel JR (1981b). Role of climbing fiber afferent input in determining responsiveness of Purkinje cells to mossy fiber inputs. J Neurophysiol 45, 962–971. [DOI] [PubMed] [Google Scholar]
- Ebner TJ, Yu Q & Bloedel JR (1983). Increase in Purkinje cell gain associated with naturally activated climbing fiber input. J Neurophysiol 50, 205–219. [DOI] [PubMed] [Google Scholar]
- Eccles JC, Llinás R, Sasaki K & Voorhoeve PE (1966). Interaction experiments on the responses evoked in Purkinje cells by climbing fibres. J Physiol 182, 297–315. [DOI] [PMC free article] [PubMed] [Google Scholar]
- Gao W, Chen G, Reinert KC & Ebner TJ (2006). Cerebellar cortical molecular layer inhibition is organized in parasagittal zones. J Neurosci 26, 8377–8387. [DOI] [PMC free article] [PubMed] [Google Scholar]
- Gilbert PF (1976). Simple spike frequency and the number of secondary spikes in the complex spike of the cerebellar Purkinje cell. Brain Res 114, 334–338. [DOI] [PubMed] [Google Scholar]
- Granit R & Phillips CG (1956). Excitatory and inhibitory processes acting upon individual Purkinje cells of the cerebellum in cats. J Physiol 133, 520–547. [DOI] [PMC free article] [PubMed] [Google Scholar]
- Hashimoto K & Kano M (1998). Presynaptic origin of paired‐pulse depression at climbing fibre‐Purkinje cell synapses in the rat cerebellum. J Physiol 506, 391–405. [DOI] [PMC free article] [PubMed] [Google Scholar]
- Hawkes R (2014). Purkinje cell stripes and long‐term depression at the parallel fiber‐Purkinje cell synapse. Front Syst Neurosci 8, 41. [DOI] [PMC free article] [PubMed] [Google Scholar]
- Ito M (2001). Cerebellar long‐term depression: characterization, signal transduction, and functional roles. Physiol Rev 81, 1143–1195. [DOI] [PubMed] [Google Scholar]
- Ito M & Simpson JI (1971). Discharges in Purkinje cell axons during climbing fiber activation. Brain Res 31, 215–219. [DOI] [PubMed] [Google Scholar]
- Keating JG & Thach WT (1995). Nonclock behavior of inferior olive neurons: interspike interval of Purkinje cell complex spike discharge in the awake behaving monkey is random. J Neurophysiol 73, 1329–1340. [DOI] [PubMed] [Google Scholar]
- Khaliq ZM & Raman IM (2005). Axonal propagation of simple and complex spikes in cerebellar Purkinje neurons. J Neurosci 25, 454–463. [DOI] [PMC free article] [PubMed] [Google Scholar]
- Lang EJ (2001). Organization of olivocerebellar activity in the absence of excitatory glutamatergic input. J Neurosci 21, 1663–1675. [DOI] [PMC free article] [PubMed] [Google Scholar]
- Lang EJ, Apps R, Bengtsson F, Cerminara NL, De Zeeuw CI, Ebner TJ, Heck DH, Jaeger D, Jorntell H, Kawato M, Otis TS, Ozyildirim O, Popa LS, Reeves AM, Schweighofer N, Sugihara I & Xiao J (2017). The roles of the olivocerebellar pathway in motor learning and motor control. A consensus paper. Cerebellum 16, 230–252. [DOI] [PMC free article] [PubMed] [Google Scholar]
- Lang EJ & Blenkinsop TA (2011). Control of cerebellar nuclear cells: a direct role for complex spikes? Cerebellum 10, 694–701. [DOI] [PMC free article] [PubMed] [Google Scholar]
- Lang EJ, Tang T, Suh CY, Xiao J, Kotsurovskyy Y, Blenkinsop TA, Marshall SP & Sugihara I (2014). Modulation of Purkinje cell complex spike waveform by synchrony levels in the olivocerebellar system. Front Syst Neurosci 8, 210. [DOI] [PMC free article] [PubMed] [Google Scholar]
- Latham A & Paul DH (1971). Spontaneous activity of cerebellar Purkinje cells and their responses to impulses in climbing fibres. J Physiol 213, 135–156. [DOI] [PMC free article] [PubMed] [Google Scholar]
- Loewenstein Y, Mahon S, Chadderton P, Kitamura K, Sompolinsky H, Yarom Y & Hausser M (2005). Bistability of cerebellar Purkinje cells modulated by sensory stimulation. Nat Neurosci 8, 202–211. [DOI] [PubMed] [Google Scholar]
- Mano N (1970). Changes of simple and complex spike activity of cerebellar Purkinje cells with sleep and waking. Science 170, 1325–1327. [DOI] [PubMed] [Google Scholar]
- Mano N, Kanazawa I & Yamamoto K (1986). Complex‐spike activity of cerebellar Purkinje cells related to wrist tracking movement in monkey. J Neurophysiol 56, 137–158. [DOI] [PubMed] [Google Scholar]
- Marshall SP & Lang EJ (2009). Local changes in the excitability of the cerebellar cortex produce spatially restricted changes in complex spike synchrony. J Neurosci 29, 14352–14362. [DOI] [PMC free article] [PubMed] [Google Scholar]
- Mathy A, Ho SS, Davie JT, Duguid IC, Clark BA & Hausser M (2009). Encoding of oscillations by axonal bursts in inferior olive neurons. Neuron 62, 388–399. [DOI] [PMC free article] [PubMed] [Google Scholar]
- Mauk MD & Donegan NH (1997). A model of Pavlovian eyelid conditioning based on the synaptic organization of the cerebellum. Learn Mem 4, 130–158. [DOI] [PubMed] [Google Scholar]
- McDevitt CJ, Ebner TJ & Bloedel JR (1982). The changes in Purkinje cell simple spike activity following spontaneous climbing fiber inputs. Brain Res 237, 484–491. [DOI] [PubMed] [Google Scholar]
- Miall RC, Keating JG, Malkmus M & Thach WT (1998). Simple spike activity predicts occurrence of complex spikes in cerebellar Purkinje cells. Nat Neurosci 1, 13–15. [DOI] [PubMed] [Google Scholar]
- Monsivais P, Clark BA, Roth A & Häusser M (2005). Determinants of action potential propagation in cerebellar Purkinje cell axons. J Neurosci 25, 464–472. [DOI] [PMC free article] [PubMed] [Google Scholar]
- Montarolo PG, Palestini M & Strata P (1982). The inhibitory effect of the olivocerebellar input on the cerebellar Purkinje cells in the rat. J Physiol 332, 187–202. [DOI] [PMC free article] [PubMed] [Google Scholar]
- Murphy JT & Sabah NH (1970). The inhibitory effect of climbing fiber activation on cerebellar purkinje cells. Brain Res 19, 486–490. [DOI] [PubMed] [Google Scholar]
- Najafi F & Medina JF (2013). Beyond "all‐or‐nothing" climbing fibers: graded representation of teaching signals in Purkinje cells. Front Neural Circuits 7, 115. [DOI] [PMC free article] [PubMed] [Google Scholar]
- Paukert M, Huang YH, Tanaka K, Rothstein JD & Bergles DE (2010). Zones of enhanced glutamate release from climbing fibers in the mammalian cerebellum. J Neurosci 30, 7290–7299. [DOI] [PMC free article] [PubMed] [Google Scholar]
- Piochon C, Irinopoulou T, Brusciano D, Bailly Y, Mariani J & Levenes C (2007). NMDA receptor contribution to the climbing fiber response in the adult mouse Purkinje cell. J Neurosci 27, 10797–10809. [DOI] [PMC free article] [PubMed] [Google Scholar]
- Piochon C, Levenes C, Ohtsuki G & Hansel C (2010). Purkinje cell NMDA receptors assume a key role in synaptic gain control in the mature cerebellum. J Neurosci 30, 15330–15335. [DOI] [PMC free article] [PubMed] [Google Scholar]
- Rasmussen A, Jirenhed DA, Zucca R, Johansson F, Svensson P & Hesslow G (2013). Number of spikes in climbing fibers determines the direction of cerebellar learning. J Neurosci 33, 13436–13440. [DOI] [PMC free article] [PubMed] [Google Scholar]
- Rawson JA & Tilokskulchai K (1981). Suppression of simple spike discharges of cerebellar Purkinje cells by impulses in climbing fibre afferents. Neurosci Lett 25, 125–130. [DOI] [PubMed] [Google Scholar]
- Sato Y, Miura A, Fushiki H & Kawasaki T (1992). Short‐term modulation of cerebellar Purkinje cell activity after spontaneous climbing fiber input. J Neurophysiol 68, 2051–2062. [DOI] [PubMed] [Google Scholar]
- Savio T & Tempia F (1985). On the Purkinje cell activity increase induced by suppression of inferior olive activity. Exp Brain Res 57, 456–463. [DOI] [PubMed] [Google Scholar]
- Sugihara I, Marshall SP & Lang EJ (2007). Relationship of complex spike synchrony to the lobular and longitudinal aldolase C compartments in crus IIA of the cerebellar cortex. J Comp Neurol 501, 13–29. [DOI] [PubMed] [Google Scholar]
- Wise AK, Cerminara NL, Marple‐Horvat DE & Apps R (2010). Mechanisms of synchronous activity in cerebellar Purkinje cells. J Physiol 588, 2373–2390. [DOI] [PMC free article] [PubMed] [Google Scholar]
- Wonnacott TH & Wonnacott RJ (1977). Introductory Statistics, 3rd edn John Wiley & Sons, New York. [Google Scholar]
- Xiao J, Cerminara NL, Kotsurovskyy Y, Aoki H, Burroughs A, Wise AK, Luo Y, Marshall SP, Sugihara I, Apps R & Lang EJ (2014). Systematic regional variations in Purkinje cell spiking patterns. PLoS One 9, e105633. [DOI] [PMC free article] [PubMed] [Google Scholar]
- Yang Y & Lisberger SG (2014). Purkinje‐cell plasticity and cerebellar motor learning are graded by complex‐spike duration. Nature 510, 529–532. [DOI] [PMC free article] [PubMed] [Google Scholar]
- Zhou H, Lin Z, Voges K, Ju C, Gao Z, Bosman LW, Ruigrok TJH, Hoebeek FE, De Zeeuw CI & Schonewille M (2014). Cerebellar modules operate at different frequencies. Elife 3, e02536. [DOI] [PMC free article] [PubMed] [Google Scholar]
- Zhou H, Voges K, Lin Z, Ju C & Schonewille M (2015). Differential Purkinje cell simple spike activity and pausing behavior related to cerebellar modules. J Neurophysiol 113, 2524–2536. [DOI] [PMC free article] [PubMed] [Google Scholar]


