

Abstract
Key points
Accumulation of skeletal muscle extracellular matrix is an unfavourable characteristic of many muscle diseases, muscle injury and sarcopenia.
The extent of cross‐talk between fibroblasts, as the source of matrix protein, and satellite cells in humans is unknown. We studied this in human muscle biopsies and cell‐culture studies.
We observed a strong stimulation of myogenesis by human fibroblasts in cell culture.
In biopsies collected 30 days after a muscle injury protocol, fibroblast number increased to four times control levels, where fibroblasts were found to be preferentially located immediately surrounding regenerating muscle fibres.
These novel findings indicate an important role for fibroblasts in supporting the regeneration of muscle fibres, potentially through direct stimulation of satellite cell differentiation and fusion, and contribute to understanding of cell–cell cross‐talk during physiological and pathological muscle remodelling.
Abstract
Accumulation of skeletal muscle extracellular matrix is an unfavourable characteristic of many muscle diseases, muscle injury and sarcopenia. In addition to the indispensable role satellite cells play in muscle regeneration, there is emerging evidence in rodents for a regulatory influence on fibroblast activity. However, the influence of fibroblasts on satellite cells and muscle regeneration in humans is unknown. The purpose of this study was to investigate this in vitro and during in vivo regeneration in humans. Following a muscle injury protocol in young healthy men (n = 7), the number of fibroblasts (TCF7L2+), satellite cells (Pax7+), differentiating myogenic cells (myogenin+) and regenerating fibres (neonatal/embryonic myosin+) was determined from biopsy cross‐sections. Fibroblasts and myogenic precursor cells (MPCs) were also isolated from human skeletal muscle (n = 4) and co‐cultured using different cell ratios, with the two cell populations either in direct contact with each other or separated by a permeable membrane. MPC proliferation, differentiation and fusion were assessed from cells stained for BrdU, desmin and myogenin. On biopsy cross‐sections, fibroblast number was seen to increase, along with myogenic cell number, by d7 and increase further by d30, where fibroblasts were observed to be preferentially located immediately surrounding regenerating muscle fibres. In vitro, the presence of fibroblasts in direct contact with MPCs was found to moderately stimulate MPC proliferation and strongly stimulate both MPC differentiation and MPC fusion. It thus appears, in humans, that fibroblasts exert a strong positive regulatory influence on MPC activity, in line with observations during in vivo skeletal muscle regeneration.
Keywords: co‐culture, myogenesis, satellite cells, skeletal muscle derived fibroblasts, skeletal muscle regeneration
Key points
Accumulation of skeletal muscle extracellular matrix is an unfavourable characteristic of many muscle diseases, muscle injury and sarcopenia.
The extent of cross‐talk between fibroblasts, as the source of matrix protein, and satellite cells in humans is unknown. We studied this in human muscle biopsies and cell‐culture studies.
We observed a strong stimulation of myogenesis by human fibroblasts in cell culture.
In biopsies collected 30 days after a muscle injury protocol, fibroblast number increased to four times control levels, where fibroblasts were found to be preferentially located immediately surrounding regenerating muscle fibres.
These novel findings indicate an important role for fibroblasts in supporting the regeneration of muscle fibres, potentially through direct stimulation of satellite cell differentiation and fusion, and contribute to understanding of cell–cell cross‐talk during physiological and pathological muscle remodelling.
Abbreviations
- ES
electrical stimulation
- HUVEC
human umbilical vascular endothelial cell
- MPC
myogenic precursor cell
- MHCn/e
neonatal/embryonic myosin heavy chain
Introduction
In response to skeletal muscle injury, a sequenced early de‐adhesion and later rebuilding and strengthening of the entire muscle extracellular matrix is initiated (Mackey et al. 2011; Hyldahl et al. 2015), providing an environment in which necrotic myofibres can be removed and myogenesis can take place. The timely resolution of this transient matrix is important for successful restoration of the muscle and for avoiding chronic injury situations where fibrotic and adipogenic activity dominate (Mann et al. 2011). While there is strong evidence for an essential role for satellite cells, the resident stem cells of skeletal muscle, in the repair of skeletal muscle following injury (Lepper et al. 2011), increasing evidence also points to an important role for other cell types in orchestrating various stages of the repair process through delivery of paracrine signals. For example, the regulatory effects of pro‐inflammatory and anti‐inflammatory macrophages on the stimulation of myogenic cell proliferation and differentiation, respectively, have been shown to demonstrate a specific time pattern order in regenerating human skeletal muscle (Saclier et al. 2013).
Much less studied is the role of fibroblasts, the main cell type of muscle connective tissue. Fibroblasts are often considered negative players in the adaptation of skeletal muscle since they are implicated in the formation of transient fibrosis that occurs following muscle injury, and, where repair is not successful, in the formation of resilient scar tissue, in addition to the gradual accumulation of muscle connective tissue that may occur with ageing (Kragstrup et al. 2011). Partial genetic ablation of fibroblasts in the mouse, however, has been shown to result in inferior regeneration of injured muscle, which was associated with premature differentiation of satellite cells (Murphy et al. 2011). This provides evidence not only for an important role for fibroblasts in the successful restoration of skeletal muscle after injury but also for cell–cell interaction between satellite cells and fibroblasts during the repair process. This interaction appears to be two‐way, with myogenic cells, or their conditioned medium, exerting a suppressive effect on the expression of various collagen types in fibroblasts in co‐culture experiments (Fry et al. 2014, 2017). The influence of fibroblasts on the activity of myogenic cells has not yet been studied in human skeletal muscle‐derived cells, however, so it is not certain that findings in the mouse can be extrapolated to human muscle injury.
While the time course of the satellite cell response to large‐scale regeneration in human skeletal muscle has been documented, with peak numbers observed about 7–8 days following injury and a residual elevation evident 30 days following injury (Crameri et al. 2007; Mackey et al. 2011, 2016), the fibroblast content of human skeletal muscle both at rest and during regeneration remains unknown. In light of this, the purpose of this study was (1) to determine simultaneous changes in the content of satellite cells and fibroblasts during regeneration of human skeletal muscle, where we hypothesised that both cell populations would increase in parallel and that this increase would be concentrated around focal areas of necrosis and regeneration, and (2) to investigate fibroblast–myogenic cell interaction in vitro using cells isolated from human skeletal muscle, where we hypothesised that fibroblasts would alter the kinetics of myogenesis.
Methods
Ethical approval
The human in vivo study was approved by The Regional Scientific Ethics Committees of Copenhagen in Denmark (Ref: HD‐2008‐074). All procedures conformed to the Declaration of Helsinki and the subjects gave written informed consent before participation. For the in vitro study, human myogenic precursor cells were isolated from normal adult skeletal muscle samples according to French legislation (protocol registered at the Agence de la Biomedecine in 2007 ‘Interrelations entre les cellules souches adultes du muscle strié squelettique et les macrophages’ and Cochin Hospital Cell Bank, Paris, agreement no. DC‐2009‐944).
In vivo regeneration study
The muscle biopsies analysed in this study are a subset of biopsies collected for a larger study on muscle regeneration (Mackey et al. 2016). Briefly, the experiment consisted of a muscle injury protocol, where the quadriceps muscles were subjected to 200 forced lengthening contractions induced by electrical stimulation (ES). Muscle biopsies were collected from the vastus lateralis, under local anaesthetic (1% lidocaine: Amgros I/S, Copenhagen, Denmark), using the percutaneous needle biopsy technique of Bergström (1975) with 5–6 mm biopsy needles and manual suction. On removal, fascicles were aligned in parallel, embedded in Tissue‐Tek (Sakura Finetek Europe, Zoeterwoude, The Netherlands), and frozen in isopentane, pre‐cooled by liquid nitrogen, and stored at −80°C. Muscle biopsies were sampled from the vastus lateralis muscle on the day of ES and on days 2, 7 and 30 after ES. For this study, seven subjects were selected from haematoxylin and eosin stained cross‐sections as those displaying large‐scale necrosis (infiltration of myofibres) on day 7 and on‐going regeneration (presence of small fibres containing central nuclei) on day 30. The sample series for each subject thus includes a control sample and samples from the injured muscle on days 2, 7 and 30. New sections (10 μm) were cut for this study and stored at −80°C until being stained.
Immunohistochemistry of biopsy sections
The anti‐TCF4 antibody used to label fibroblasts in this study recognises transcription factor 7‐like 2 (TCF7L2), and not transcription factor 4 (TCF‐4) which is also known as immunoglobulin transcription factor 2 (ITF‐2). Cells labelled with this antibody will therefore be referred to as TCF7L2+ cells. After fixation in 5% formaldehyde (Histofix, Histolab, Gothenburg, Sweden), the three primary antibodies mouse anti‐pax7 (cat. no. Pax7, Developmental Studies Hybridoma Bank, Iowa, IA, USA), rabbit anti‐TCF7L2 (‘TCF4’, cat. no. 2569, Cell Signalling Technology Europe, B.V., Leiden, The Netherlands) and goat anti‐collagen IV (cat. no. AB769, Merck Millipore, Darmstadt, Germany) were applied to the sections together and incubated overnight. This was followed by three secondary antibodies Alexa Fluor 488 donkey anti‐mouse (cat. no. ab150109, Abcam, Cambridge, UK), Alexa Fluor 568 donkey anti‐rabbit (cat. no. ab175693, Abcam), and Alexa Fluor 680 donkey anti‐goat (Molecular Probes cat. no. A‐21084, Invitrogen A/S, Taastrup, Denmark) and lastly DAPI. Using the same staining protocol, the Pax7 primary antibody was substituted with (1) a mouse anti‐myogenin antibody (F5d, Developmental Studies Hybridoma Bank) or (2) a mouse anti‐CD68 antibody (cat. no. M0718, Dako Denmark A/S, Glostrup, Denmark) or (3) a combination of mouse anti‐embryonic myosin (F1.652; Developmental Studies Hybridoma Bank) and mouse anti‐neonatal myosin (NCL‐MHCn; Novocastra, Leica Microsystems A/S, Ballerup, Denmark). For the last of these, the tissue was not fixed until just prior to DAPI nuclear staining, since we have observed markedly reduced staining signal of these immature myosins on fixed tissue. To determine whether TCF7L2 cells are related to haematopoietic cells, sections were double‐stained for TCF7L2 and CD45 (leukocyte common antigen, cat. no. M070129‐2, Dako).
Microscopy and cell quantification
Images covering an area of 0.57 mm2 were captured using a digital camera (Olympus DP71, Olympus Deutschland GmbH, Hamburg, Germany), mounted on a BX51 microscope (Olympus), controlled by cellSens Standard software (Olympus, Olympus Soft Imaging Solutions, GmbH, Münster, Germany). From the Pax7 sections, a mean (±SD) area of 1.35 ± 0.43 mm2, containing 296 ± 101 fibres, was imaged. Fibroblasts were defined as TCF7L2+ nuclei clearly located outside the myofibre basement membrane (collagen IV) in the muscle endomysium (and not perimysium or vessels), and were marked on images using the Fiji software (ImageJ, version 2, U.S. National Institutes of Health, Bethesda, MD, USA) with the aid of the plug‐in ObjectJ (version 1.03q). (Weakly stained cells inside the myofibre basement membrane were sometimes observed on day 7 but not included in the counting.) In each image field, the number of muscle fibres, fibroblasts and Pax7+ (or myogenin+) cells was counted. Sample images of the staining for each time point are presented in Fig. 1. The area of tissue assessed was also determined to allow cell number to be expressed relative to tissue area as well as fibre number. On day 7, the number of fibres that appeared damaged was also counted. These fibres were defined as being heavily infiltrated with cells, and/or shrunken or swollen in size. The number of fibroblasts immediately surrounding fibres that were damaged or containing one or more myogenin+ cells was determined and the remaining fibroblasts were considered to be surrounding ‘normal’ fibres, for comparison. The percentage of fibres with one or more central nuclei or neonatal/embryonic myosin heavy chain (MHCn/e) positivity was determined for the day 30 samples. The number of fibroblasts immediately surrounding a fibre with central nuclei was also determined and the same procedure was used for MHCn/e+ fibres. The number of fibroblasts surrounding fibres either containing central nuclei or MHCn/e staining was subtracted from the total number of fibroblasts to give the value for fibroblasts surrounding ‘normal’ fibres.
Figure 1. Immunohistochemical staining of satellite cells and fibroblasts in human regenerating muscle.

Immunohistochemical staining of fibroblasts (TCF7L2), satellite cells (Pax7) and basement membrane (collagen IV) on cross‐sections of biopsies used in this study. Single channel images of Pax7 and TCF7L2 are displayed alongside a merged image of TCF7L2 and collagen IV, and, lastly, a merged image of all three labels with Hoechst rendering the nuclei blue. Scale bars = 100 μm.
Fibroblast–myogenic precursor cell co‐culture
Human myogenic precursor cells (MPCs) were isolated from normal adult skeletal muscle samples and cultured as previously described (Saclier et al. 2013) in HAMF12 medium (Gibco, Waltham, MA, USA), containing 15% fetal bovine serum (FBS). Cells were sorted before the first passage with anti‐CD56 magnetic beads (cat. no. 130‐050‐401, Miltenyi Biotec SAS, Paris, France), according to the manufacturer's instructions. Both positive and negative fractions were recovered. The purity of the cells was assessed for CD56 expression (cat. no. 555518, BD Pharmingen) by flow cytometry (FC500 Beckman Coulter cytometer). The CD56‐negative cell fraction was negative for CD31 and CD45, in contrast to human umbilical vascular endothelial cells (HUVECs) and macrophages, respectively, cultured as described previously (Christov et al. 2007; Saclier et al. 2013), and shown in Fig. 2. In addition, the CD56‐negative fraction cells were negative for desmin labelling and positive for TCF7L2, and therefore contained mainly fibroblastic cells (Fig. 2). Co‐culture experiments were performed under two conditions of cell contact. In the ‘direct’ cell co‐cultures, MPCs were cultured together with fibroblasts on the same coverslip, as opposed to the ‘indirect’ co‐culture, where MPCs and fibroblasts were separated by a well insert (0.4 μm pore size). In addition, different MPC/fibroblast ratios were tested by two approaches with either the total number of cells per well or the number of MPCs being held constant. For cell proliferation experiments, in the cell constant condition 30,000 cells in total were added to each well for each of the different cell ratios, resulting in progressively fewer MPCs (from 30,000 to 5000) as the fibroblast number increased. This was in contrast to the MPC constant condition where 12 000 MPCs were added to each well regardless of fibroblast cell number (from 0 to 60,000). For differentiation experiments, in the cell constant condition 40,000 cells in total were added to each well (MPC number from 40,000 to 6500), while in the MPC constant condition 20,000 MPCs were added to each well (fibroblast number ranged from 0 to 100,000). Classic myogenesis experiments were performed to evaluate proliferation, differentiation and fusion. For proliferation, cells were plated on day 0, with addition of BrdU on day 1 and fixation of cells on day 2. For differentiation, cells were plated on day 0, fibroblasts were added on day 4 along with a switch to differentiation medium (HAMF12 medium containing 2% horse serum), and cells were fixed for analysis on day 8.
Figure 2. Characterization of CD56neg fraction from human muscle cell cultures.
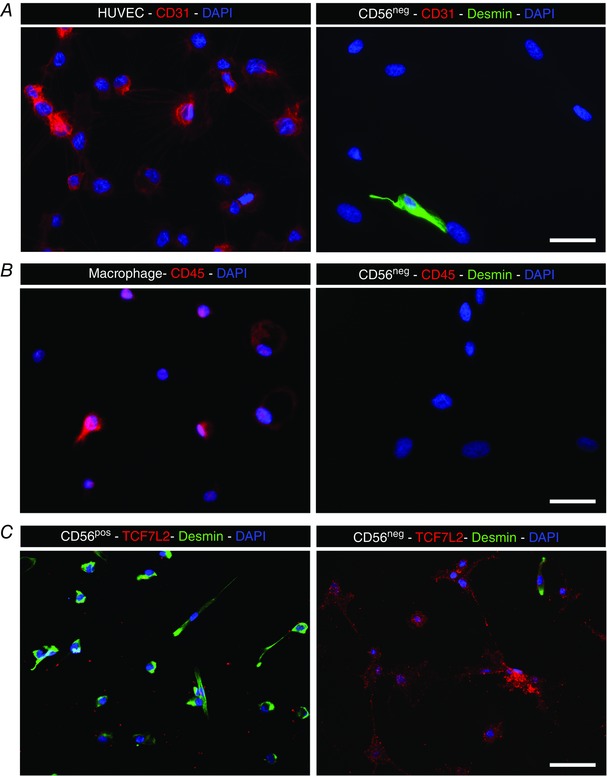
A, endothelial cells (HUVECs) were CD31‐positive (red), while CD56neg cells did not show immunoreactivity for CD31. B, macrophages were CD45‐positive, while the CD56neg cell fraction was negative for CD45. C, CD56pos myogenic cells showed immunoreactivity for desmin (green) but not for TCF7L2 (red), while CD56neg cells did express TCF7L2 (red) and not desmin (green). A–C, note that CD56neg cells showed extremely rare occasional desmin labelling (green). Scale bars = 25 μm (A, B) and 50 μm (C).
Immunocytochemistry and image analysis
Proliferation cells were stained with desmin and BrdU (Fig. 3), and the number of BrdU+ desmin+ cells was determined and expressed relative to the total number of desmin+ cells. Differentiation cells were stained with desmin and myogenin, and the number of myogenin+ desmin+ cells was determined and expressed relative to the total number of desmin+ cells. Fusion index was determined by the number of nuclei present in multinucleated cells relative to the total number of nuclei in the cell culture. About 10 pictures each of 4 different primary cell cultures were analysed (accounting for more than 200 cells in each experiment).
Figure 3. Co‐cultures of CD56pos with CD56neg muscle cells.
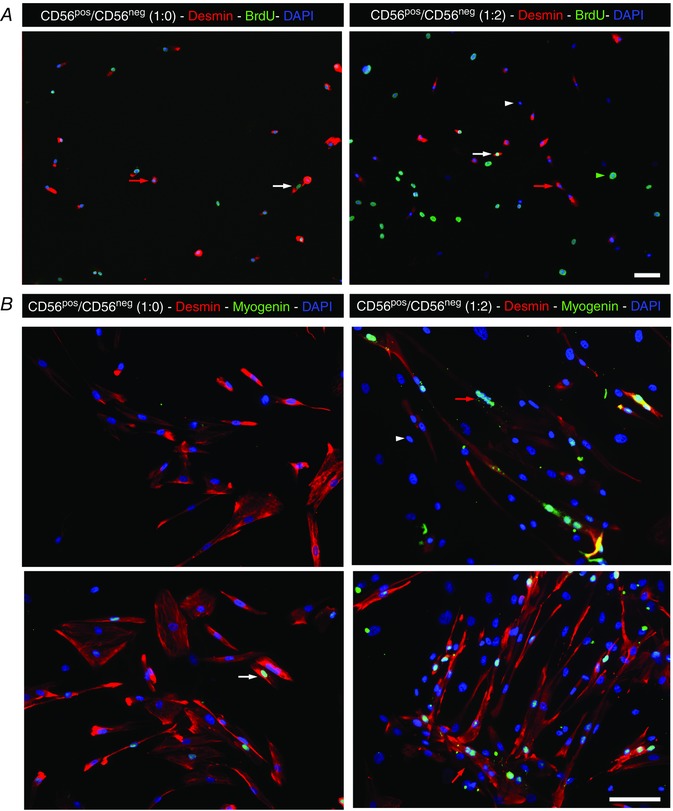
CD56pos myogenic cells were cultured alone (left panel) or with CD56neg cells at a ratio of 1:2 (right panel). In A, cells were cultured in growing conditions and were labelled for BrdU (green) to evaluate cycling cells and for desmin (red). White arrows indicate cycling desminpos cells, while red arrows indicate non cycling desminpos cells. White arrowhead indicates a non‐cycling desminneg cell and green arrowhead indicates a non‐cycling desminneg cell. In B, cells were cultured for differentiation and were labelled for myogenin (green) to evaluate myogenic differentiation and for desmin (red). The upper and the lower panels represent two different primary cultures. White arrow indicates a differentiated desminpos cell, while red arrows indicate myotubes formed by desminpos cells. Desminneg cells were never positive for myogenin (white arrowhead). Scale bars = 50 μm.
Statistics
Data were analysed using version 6.0c of GraphPad Prism for Mac OS X software (GraphPad Software, San Diego, CA, USA). Changes over time in satellite cell and fibroblast cell number were investigated by repeated measures ANOVA and the Holm–Sidak's multiple comparisons test. The myogenin data and the day 30 comparisons were tested using the Friedman test, with Dunn's multiple comparisons post hoc test. Spearman's correlation was used to investigate relationships between variables. For the direct co‐culture in vitro data, a one‐way ANOVA with Bonferroni's multiple comparison test was used, and the indirect data were tested by unpaired two‐tailed t test. Data are presented as means ± SEM, unless otherwise stated.
Results
Profile of fibroblast staining
TCF7L2 demonstrated nuclear staining of some cells located between muscle fibres. In addition, it appeared that some cells within necrotic muscle fibres displayed faint immunoreactivity for TCF7L2, as did the damaged fibre cytosol. No co‐labelling of TCF7L2+ cells and either CD68+ or CD45+ cells was observed (Fig. 4), indicating that fibroblasts identified with this marker are not related to haematopoietic cells.
Figure 4. Differential staining of fibroblasts and cells of haematopoietic origin.
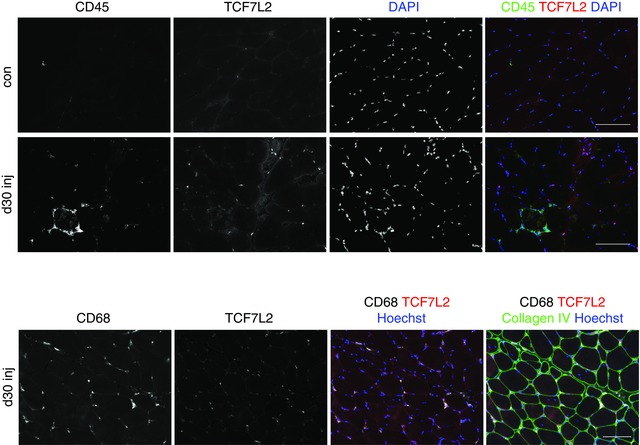
Immunohistochemical staining of fibroblasts (TCF7L2) and haematopoietic cells (CD45) on cross‐sections of biopsies collected at 30 days after injury. Single channel images are displayed alongside a merged image with Hoechst rendering the nuclei blue. The lower series of images shows macrophage staining (CD68) instead of CD45. No overlap was observed between TCF7L2 and either CD45 or CD68, indicating separate cell populations. Scale bars = 100 μm.
In vivo muscle regeneration
In the control muscle, the number of satellite cells was 0.074 ± 0.004 cells per fibre and the number of fibroblasts 0.13 ± 0.017 cells per fibre (Fig. 5). Corresponding values expressed relative to area of tissue were 15 ± 0.65 satellite cells mm2 and 26 ± 3.14 fibroblasts mm2 (Fig. 5). This resulted in a ratio of fibroblasts to satellite cells of 1.8 ± 0.2, with fibroblasts outnumbering satellite cells at all time points investigated (Fig. 6). Changes over time were found for both the number of satellite cells (encompassing MPCs) and the number of fibroblasts, when expressed relative to area of tissue analysed or the number of fibres included in the enumeration. Increases were observed from baseline on day 7 and day 30 for both cell types, and specifically for fibroblasts the day 30 values were found to be greater than the day 7 values (Fig. 5 B and D). Day 30 fibroblast values were 0.45 ± 0.05 cells per fibre and 104 ± 6.23 cells mm2, 4 times control levels (Fig. 5 B and D). Corresponding values for satellite cells were 0.18 ± 0.03 cells per fibre and 40 ± 4.18 cells mm2, still substantially elevated from control samples (Fig. 5 A and C). The ratio of fibroblasts to satellite cells on day 30 was greater than control and day 7 values, peaking at a ratio of 2.7 ± 0.3 (Fig. 6).
Figure 5. Changes in the number of satellite cells and fibroblasts in vivo during regeneration in humans.
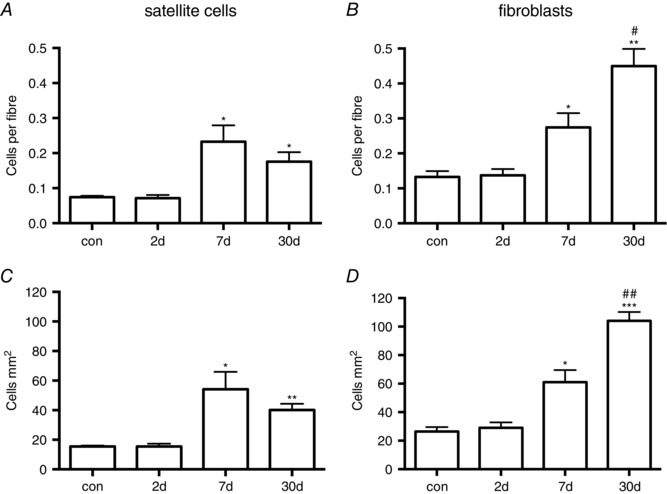
Following muscle injury and in control (con) uninjured muscle, the number of satellite cells (A, C) and fibroblasts (B, D) was determined on cross‐sections of muscle biopsies. Values were expressed relative to the number of fibres (A, B) and the area of tissue (C, D) included in the analysis. * P < 0.05, ** P < 0.01, *** P < 0.001 vs. con. # P < 0.05, ## P < 0.01 vs. day 7.
Figure 6. Ratio of fibroblasts to satellite cells in vivo during regeneration.
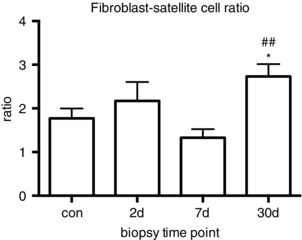
The ratio of fibroblasts to satellite cells was determined (from the data presented in Fig. 1) in control (con) and regenerating muscle. * P < 0.05 vs. con. ## P < 0.01 vs. day 7.
No myogenin+ nuclei were found in any of the control samples. Three myogenin+ nuclei in total were found in the day 2 samples, while all biopsies at day 7 and day 30 contained myogenin+ nuclei. The number of myogenin+ nuclei per fibre increased from baseline at day 7 to 0.48 ± 0.11 (Fig. 7). Expressed in another way, 22 ± 5% of fibres contained one or more myogenin+ nuclei, where it was observed that 52 ± 9% of fibroblasts were located immediately around these fibres, which was not significantly different from the proportion of fibroblasts surrounding fibres without myogenin+ nuclei (48 ± 9%). The proportion of fibres that had a damaged appearance at day 7 was 25 ± 4%. A significant correlation was found between the proportion of damaged fibres and the number of fibroblasts (Spearman's r = 0.92, P = 0.003) at this time point, although no difference was detected between the proportion of fibroblasts located immediately around these fibres (57 ± 6%) versus surrounding undamaged fibres (43 ± 6%).
Figure 7. Changes in the number of myogenin+ cells during regeneration.
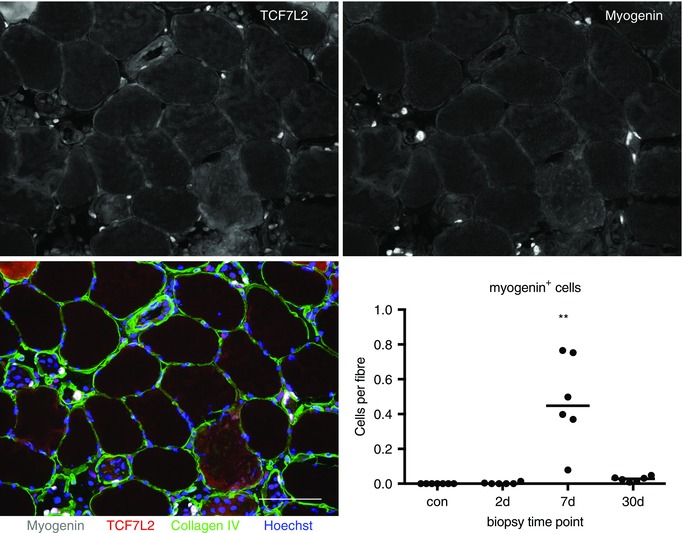
The number of myogenin+ cells was determined on cross‐sections of biopsies stained for fibroblasts (TCF7L2), myogenin, collagen IV and Hoechst, as shown for one of the 7 day samples analysed in this study. Single channel images are displayed for TCF7L2 and myogenin, and the four‐channel merged image; scale bar = 100 μm. A similar number of fibroblasts was observed to be located around fibres with, vs. fibres without, myogenin+ cells. For the enumeration of myogenin cells, individual (and median) values are displayed; ** P < 0.01, vs. con.
Thirty days following injury, 11 ± 2% of fibres contained one or more centrally located nuclei. No relationship between this variable and the number of fibroblasts was observed (Spearman's r = 0.18, P = 0.694). A very low number of myogenin+ nuclei was found at this time point: 0.027 ± 0.006 per fibre, while a mean of 42 ± 6% (range 22–68%) of fibres were positive for embryonic or neonatal myosin (8 ± 2% of fibres contained both central nuclei and embryonic or neonatal myosin). A significant correlation (Spearman's r = 0.82, P = 0.034) was observed for this proportion of regenerating fibres and the number of fibroblasts at this time point (Fig. 8 A). In addition, it was observed that 75 ± 5% of fibroblasts were situated immediately around fibres demonstrating positive immunoreactivity for embryonic or neonatal myosin (Fig. 8 B). These values were significantly greater than the proportion of fibroblasts (22 ± 4%) found around normal fibres. A similar pattern was seen for the proportion of fibroblasts (78 ± 4%) found immediately around fibres containing central nuclei or demonstrating positive immunoreactivity for embryonic or neonatal myosin.
Figure 8. Relationship between fibroblast number and regenerating fibres.
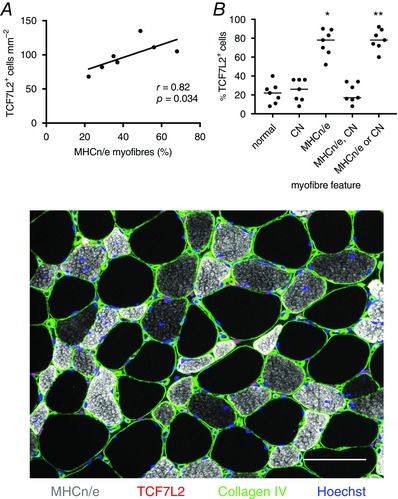
At day 30 a positive relationship between the number of fibroblasts and the proportion of regenerating (MHCn/e+) fibres was observed (A). The percentage of fibroblasts located immediately around MHCn/e+ fibres, fibres containing central nuclei (CN), or both (MHCn/e, CN) or either (MHCn/e or CN) was determined, where a clear preferential association with regenerating vs. normal fibres was found (B). Some, but not all, of the fibres with central nuclei were also positive for MHCn/e, as can be seen in the immunohistochemical image. (100% of fibroblasts is accounted for in ‘normal’ and ‘MHCn/e or CN’.) Individual data are shown, with the line representing the median; * P < 0.05 vs. normal. These data were determined from immunohistochemically stained cross‐sections of regenerating human muscle biopsies, as shown in the lower figure. Fibroblasts are visible as pink nuclei situated between muscle fibres, outside the fibre basement membrane (collagen IV, green). The presence of neonatal and embryonic myosins (MHCn/e+, grey) indicates ongoing muscle fibre regeneration, where fibres are often characterised as being smaller than normal fibres (unstained, black) and containing central nuclei. Scale bar = 100 μm.
Fibroblast–myogenic precursor cell co‐culture
No differences in proliferation, differentiation or fusion were observed between MPC/fibroblast ratios for the indirect co‐culture experiments (cells separated by permeable membrane), either under cell constant or MPC constant conditions (Fig. 9, mid‐right and far right columns). Several differences were found in conditions where the cells were in direct contact with each other (Fig. 9, far left and mid‐left columns). For proliferation (Fig. 9, upper row) only one condition showed a greater proportion of proliferating (BrdU+) myogenic cells, i.e. a 1:5 ratio of MPC/fibroblasts versus MPCs alone (1:0 ratio), where the absolute number of MPCs was held constant, i.e. for the highest cell density tested (72,000 cells at seeding). Similar proliferation values were observed across the different ratios where total cell number was constant. For differentiation, significant increases in the proportion of myogenin+ cells were observed with increasing numbers of fibroblasts present (Fig. 9, middle row). This was apparent in both the cell constant condition with 1:2 and 1:5 MPC/fibroblast ratios being elevated versus MPCs alone (1:0 ratio), and even more apparent in the MPC constant condition, where differences versus MPCs alone were detected for 1:1, 1:2 and 1:5 ratios. Fusion index was also enhanced for the 1:2 and 1:5 ratios in the MPC constant but not cell constant condition (Fig. 9, lower row). Note that with increasing numbers of fibroblasts in the cell constant condition, the number of myogenic cells is reduced accordingly, which in itself will limit the fusion index in particular.
Figure 9. Fibroblast–myogenic precursor cell interaction in vitro .
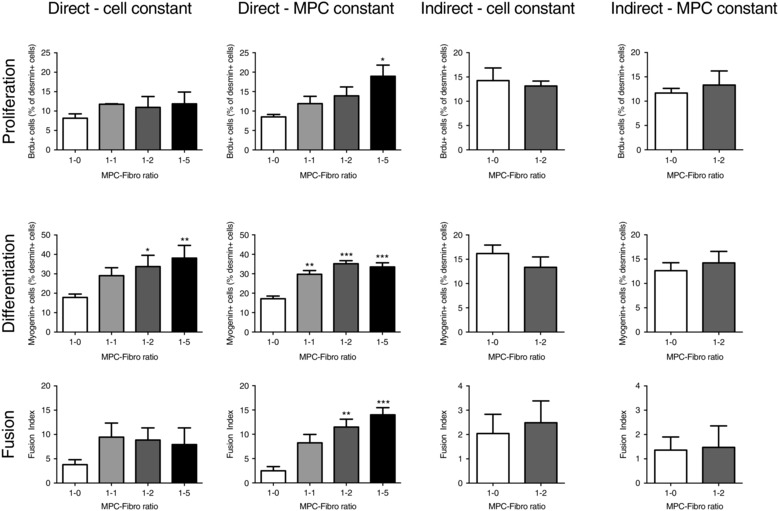
The effects of co‐culturing human fibroblasts and myogenic precursor cells (MPCs) together, either when in direct contact (‘direct’) with other or separated by a permeable membrane (‘indirect’). The experiment was performed with total cell number constant (‘cell constant’) or MPC cell number constant (‘MPC constant’). Indices of proliferation, differentiation and fusion are displayed. * P < 0.05, ** P < 0.01, *** P < 0.001 vs. MPC‐Fibro ratio 1:0.
Discussion
The main findings of this study were that human skeletal muscle‐derived fibroblasts exert a strong stimulatory influence on human myogenic precursors in vitro, which was in line with a preferential association of fibroblasts with regenerating human muscle fibres in vivo. These findings suggest a novel role for muscle fibroblasts in contributing to the complete maturation of human myofibres undergoing repair after injury.
The restoration of muscle after injury is a dynamic process requiring coordinated actions from various cell populations. The time course of satellite cell expansion, peaking on day 7 at above 3 times baseline levels, is in line with their role in the formation of myotubes after myofibre necrosis (Grounds, 2014), although it should be noted that limited data on human muscle regeneration prevent direct comparison with the time course in animals. Day 7 was also the time point where the highest number of myogenin+ cells was detected (0.48 cells per fibre), greatly exceeding Pax7 values (0.18 cells per fibre). Given that Pax7 and myogenin are mutually exclusive and demonstrate reciprocal inhibition (Olguin & Olwin, 2004; Olguin et al. 2007), it can be argued that summation of the Pax7 and myogenin values gives a more accurate account of total myogenic cell content of the muscle. This revealed 9 times baseline levels of myogenic cell content, providing further support for the use of this model of electrical stimulation to study myogenic cell activity in humans. At our latest time point, 30 days, the elevated satellite cell values fit with the high proportion of immature myofibres (evidenced by the high proportion of fibres expressing neonatal or embryonic myosin) present at this time point, indicating that myofibre regeneration is not yet complete. Alongside these data on human myogenic cell activity, we document for the first time the muscle content of fibroblasts during in vivo human muscle regeneration and show a marked increase on day 7 and a further expansion by day 30, representing 4 times control levels. This time course is in accordance with previous studies documenting a prolonged remodelling of the muscle extracellular matrix while the last stages of myofibre restoration occur. For example, we and others have observed elevated gene expression levels of various matrix proteins in muscle biopsies 4 weeks after inducing muscle injury in healthy young individuals (Mackey et al. 2011; Hyldahl et al. 2015). Clearly the greater number of fibroblasts at this stage as the likely source of new matrix proteins could be explained by this demand for continued matrix remodelling. However, on finding a strong positive relationship between fibroblast content and the proportion of fibres expressing neonatal or embryonic myosin, we determined the proportion of fibroblasts located immediately surrounding these regenerating myofibres and found a clear preferential association. These data provide strong support for a role for fibroblasts in the maturation of myofibres during regeneration after injury.
To explore a direct fibroblast–myoblast interaction, we then set up co‐culture experiments using human muscle‐derived fibroblasts and myoblasts, where we observed a strong stimulatory effect of fibroblasts on both myogenic differentiation and fusion (Fig. 9). A moderate positive effect of fibroblasts was also seen on myogenic cell proliferation, but only for the high‐density 1:5 ratio of MPCs to fibroblasts, which is far below from the ratio observed in vivo (Fig. 4), indicating that stimulation of MPC proliferation is not the main property of fibroblasts. Since Pax7 number was seen to peak in vivo at 7 days after injury and no increase was observed at 2 days, it can be speculated that the bulk of satellite cell proliferation in vivo has occurred at a time point between days 2 and 7. Interestingly, no change in the muscle content of fibroblasts could be detected on day 2, so it is unlikely that fibroblasts are the initial activators of satellite cells following muscle injury of the type induced in this study.
For myogenic differentiation, on the other hand, a clear positive regulatory role for fibroblast contact was detected at the 1:1 MPC/fibroblast ratio, the lowest fibroblast number tested, as well as with increasing numbers of fibroblasts (1:2 and 1:5 ratios). A similar pattern was observed for fusion. This occurred under cell constant and MPC constant conditions at almost all cell ratios (except, as expected, for the fusion index in the cell constant ratio where MPC number is strongly reduced, preventing high fusion events), further supporting the idea of a strong stimulatory role for fibroblast contact in regulating myogenesis. These in vitro data are in accordance with the in vivo observation of the greatest numbers of myogenin+ cells seen on day 7 in the regenerating muscle biopsies, as well as a doubling in fibroblast number. However, in vivo, fibroblasts were not preferentially associated with fibres containing myogenin+ cells at day 7, but were clearly associated with regenerating myofibres later on, at day 30. We have previously observed an association of anti‐inflammatory macrophages with fibres containing myogenin+ at day 7 (Saclier et al. 2013), suggesting that this macrophage phenotype may be more important than fibroblasts for the initial switch to myogenic differentiation, while the importance of fibroblasts increases at the later stages of myotube formation and myofibre maturation lasting several weeks after myogenic differentiation had occurred. The cellular mechanism underlying these cell–cell communication observations, however, remains to be determined.
These stimulatory effects on in vitro myogenesis were only observed when the two cell populations were in direct contact with each other. When they were separated by a permeable membrane, allowing only for chemical exchange and no physical contact between the two cell populations, no effect of fibroblasts was found on any stage of myogenesis, further highlighting the importance of direct cell–cell contact for the myogenesis processes. With regard to the actual MPC/fibroblast ratios tested, even though significant changes in cell ratio were observed over time during in vivo regeneration, the mean ratio did not deviate much from 2, meaning that at any given moment during the regeneration of human skeletal muscle there are twice as many fibroblasts as satellite cells. This value corresponds to the 1:2 ratio of MPCs to fibroblasts used in the in vitro studies, where significant changes were observed for differentiation and fusion, providing further support for the in vitro findings being relevant for human muscle adaptation in vivo.
Evidence for fibroblasts exerting an influence on myogenic cells is sparse, but a study on partially fibroblast‐depleted mice recovering from barium chloride‐induced muscle injury reported premature activation and differentiation of satellite cells in the muscles lacking fibroblasts (Murphy et al. 2011), indicating an important function for fibroblasts in regulating myogenic activity during regeneration. Fibro/adipogenic progenitors, from which skeletal muscle fibroblasts are believed to be derived, have been shown to promote myogenic cell differentiation in co‐culture (Joe et al. 2010), which our data support. Relating our findings to the fibroblast depletion data is difficult given the differences between humans and mice in the nature of muscle injury models employed. In relating the stimulatory effect of fibroblasts on myogenesis in vitro to the biology of the satellite cell niche in vivo, our findings strongly indicate that fibroblasts exert their influence through direct cell–cell contact. Yet it is not known in vivo if fibroblasts and satellite cells can establish direct contact across the muscle fibre basement membrane. An alternative form of communication may be via secretion of exosomes. It has recently been shown that satellite cells secrete exosomes containing miR‐206, which regulates extracellular matrix production in fibroblasts (Fry et al. 2017), and thus supports the possibility of paracrine cell–cell signalling across the basement membrane. While we did not find any evidence to support this type of signalling across a permeable membrane, we did not examine signalling from myoblasts to fibroblasts, so it may be that fibroblast communication to myoblasts does not occur by exosome secretion but rather by direct cell–cell contact.
In considering strengths and limitations of the methodological approaches employed in this paper, the identification of fibroblasts on biopsy sections by immunoreactivity for TCF7L2 deserves some attention. In a mouse study identifying TCF7L2 as a robust marker for muscle connective tissue fibroblasts, TCF7L2 expression was also observed to some extent in myogenic cells in vitro and at low levels in some fetal myonuclei in vivo, as well as at near background levels in the cytosol of some muscle fibres in newborn mice (Mathew et al. 2011). It is therefore possible that the faintly TCF7L2+ cells observed inside the necrotic fibres in our biopsy sections may have been myogenic cells, although it is possible they were fibroblasts. Given that these cells were not included in our TCF7L2 counting (since location outside the myofibre basement membrane was a criterion), the number of fibroblasts we report here many be an underestimation of the total number of fibroblasts in regenerating human muscle. Further work to investigate the time course of appearance and disappearance of fibroblasts inside regenerating skeletal muscle fibres would greatly contribute to understanding the interplay between cell types under such conditions. With regard to the in vitro experiments, the CD56 magnetic sorting technique employed to separate human myogenic from non‐myogenic cells has also been used by others, where the negative fraction has been shown to predominantly comprise cells expressing fibroblast markers, such as TE‐7, and that were negative for desmin (Agley et al. 2013), as we also observed. While we cannot completely rule out the presence of other non‐myogenic cells (e.g. pericytes), or indeed very rare myogenic cells, in our fibroblast fraction, it is clear that the predominant cell type present is the fibroblast and therefore that the strong influence observed on myogenesis originates in these muscle‐derived fibroblasts.
In conclusion, we present evidence for a regulatory role for human muscle fibroblasts in muscle regeneration in favour of myogenic cell differentiation and fusion. These findings add fibroblasts to the multitude of cell types that together orchestrate regenerative events to result in complete restoration of muscle after injury, especially in the later stages of myofibre maturation. Furthermore, these observations provide a basis for future work investigating the molecular mechanisms underlying the role of fibroblasts during muscle regeneration.
Additional information
Competing interests
The authors declare that they have no competing interests.
Author contributions
AM and MK designed the in vivo regeneration study. AM performed all biopsy analyses and drafted the manuscript. MM and BC designed and carried out the in vitro studies. AM, BC and MK contributed to data interpretation and manuscript writing. All authors have read and approved the final manuscript.
Funding
Funding is gratefully acknowledged from the Lundbeck Foundation (R198‐2015‐207), Nordea Foundation (Healthy Aging grant), Agence Nationale de la Recherche Genopat In‐A‐Fib and EU FP7 Endostem (no. 241440).
Acknowledgements
The Pax7, F5d and F1.652 monoclonal antibodies, developed by A. Kawakami, W.E. Wright and Helen M. Blau, respectively, were obtained from the Developmental Studies Hybridoma Bank, created by the NICHD of the NIH and maintained at The University of Iowa, Department of Biology, Iowa City, IA, USA.
Linked articles This article is highlighted by a Perspective by Mendias. To read this Perspective, visit https://doi.org/10.1113/JP274403.
This is an Editor's Choice article from the 1 August 2017 issue.
References
- Agley CC, Rowlerson AM, Velloso CP, Lazarus NR & Harridge SD (2013). Human skeletal muscle fibroblasts, but not myogenic cells, readily undergo adipogenic differentiation. J Cell Sci 126, 5610–5625. [DOI] [PubMed] [Google Scholar]
- Bergström J (1975). Percutaneous needle biopsy of skeletal muscle in physiological and clinical research. Scand J Clin Lab Invest 35, 609–616. [PubMed] [Google Scholar]
- Christov C, Chretien F, Abou‐Khalil R, Bassez G, Vallet G, Authier FJ, Bassaglia Y, Shinin V, Tajbakhsh S, Chazaud B & Gherardi RK (2007). Muscle satellite cells and endothelial cells: close neighbors and privileged partners. Mol Biol Cell 18, 1397–1409. [DOI] [PMC free article] [PubMed] [Google Scholar]
- Crameri RM, Aagaard P, Qvortrup K, Langberg H, Olesen J & Kjaer M (2007). Myofibre damage in human skeletal muscle: effects of electrical stimulation vs voluntary contraction. J Physiol 583, 365–380. [DOI] [PMC free article] [PubMed] [Google Scholar]
- Fry CS, Kirby TJ, Kosmac K, McCarthy JJ & Peterson CA (2017). Myogenic progenitor cells control extracellular matrix production by fibroblasts during skeletal muscle hypertrophy. Cell Stem Cell 20, 1–14. [DOI] [PMC free article] [PubMed] [Google Scholar]
- Fry CS, Lee JD, Jackson JR, Kirby TJ, Stasko SA, Liu H, Dupont‐Versteegden EE, McCarthy JJ & Peterson CA (2014). Regulation of the muscle fiber microenvironment by activated satellite cells during hypertrophy. FASEB J 28, 1654–1665. [DOI] [PMC free article] [PubMed] [Google Scholar]
- Grounds MD (2014). The need to more precisely define aspects of skeletal muscle regeneration. Int J Biochem Cell Biol 56, 56–65. [DOI] [PubMed] [Google Scholar]
- Hyldahl RD, Nelson B, Xin L, Welling T, Groscost L, Hubal MJ, Chipkin S, Clarkson PM & Parcell AC (2015). Extracellular matrix remodeling and its contribution to protective adaptation following lengthening contractions in human muscle. FASEB J 29, 2894–2904. [DOI] [PubMed] [Google Scholar]
- Joe AW, Yi L, Natarajan A, Le Grand F, So L, Wang J, Rudnicki MA & Rossi FM (2010). Muscle injury activates resident fibro/adipogenic progenitors that facilitate myogenesis. Nat Cell Biol 12, 153–163. [DOI] [PMC free article] [PubMed] [Google Scholar]
- Kragstrup TW, Kjaer M & Mackey AL (2011). Structural, biochemical, cellular, and functional changes in skeletal muscle extracellular matrix with aging. Scand J Med Sci Sports 21, 749–757. [DOI] [PubMed] [Google Scholar]
- Lepper C, Partridge TA & Fan CM (2011). An absolute requirement for Pax7‐positive satellite cells in acute injury‐induced skeletal muscle regeneration. Development 138, 3639–3646. [DOI] [PMC free article] [PubMed] [Google Scholar]
- Mackey AL, Brandstetter S, Schjerling P, Bojsen‐Moller J, Qvortrup K, Pedersen MM, Doessing S, Kjaer M, Magnusson SP & Langberg H (2011). Sequenced response of extracellular matrix deadhesion and fibrotic regulators after muscle damage is involved in protection against future injury in human skeletal muscle. FASEB J 25, 1943–1959. [DOI] [PMC free article] [PubMed] [Google Scholar]
- Mackey AL, Rasmussen LK, Kadi F, Schjerling P, Helmark IC, Ponsot E, Aagaard P, Durigan JL & Kjaer M (2016). Activation of satellite cells and the regeneration of human skeletal muscle are expedited by ingestion of nonsteroidal anti‐inflammatory medication. FASEB J 30, 2266–2281. [DOI] [PMC free article] [PubMed] [Google Scholar]
- Mann CJ, Perdiguero E, Kharraz Y, Aguilar S, Pessina P, Serrano AL & Munoz‐Canoves P (2011). Aberrant repair and fibrosis development in skeletal muscle. Skelet Muscle 1, 21. [DOI] [PMC free article] [PubMed] [Google Scholar]
- Mathew SJ, Hansen JM, Merrell AJ, Murphy MM, Lawson JA, Hutcheson DA, Hansen MS, Angus‐Hill M & Kardon G (2011). Connective tissue fibroblasts and Tcf4 regulate myogenesis. Development 138, 371–384. [DOI] [PMC free article] [PubMed] [Google Scholar]
- Murphy MM, Lawson JA, Mathew SJ, Hutcheson DA & Kardon G (2011). Satellite cells, connective tissue fibroblasts and their interactions are crucial for muscle regeneration. Development 138, 3625–3637. [DOI] [PMC free article] [PubMed] [Google Scholar]
- Olguin HC & Olwin BB (2004). Pax‐7 up‐regulation inhibits myogenesis and cell cycle progression in satellite cells: a potential mechanism for self‐renewal. Dev Biol 275, 375–388. [DOI] [PMC free article] [PubMed] [Google Scholar]
- Olguin HC, Yang Z, Tapscott SJ & Olwin BB (2007). Reciprocal inhibition between Pax7 and muscle regulatory factors modulates myogenic cell fate determination. J Cell Biol 177, 769–779. [DOI] [PMC free article] [PubMed] [Google Scholar]
- Saclier M, Yacoub‐Youssef H, Mackey AL, Arnold L, Ardjoune H, Magnan M, Sailhan F, Chelly J, Pavlath GK, Mounier R, Kjaer M & Chazaud B (2013). Differentially activated macrophages orchestrate myogenic precursor cell fate during human skeletal muscle regeneration. Stem Cells 31, 384–396. [DOI] [PubMed] [Google Scholar]