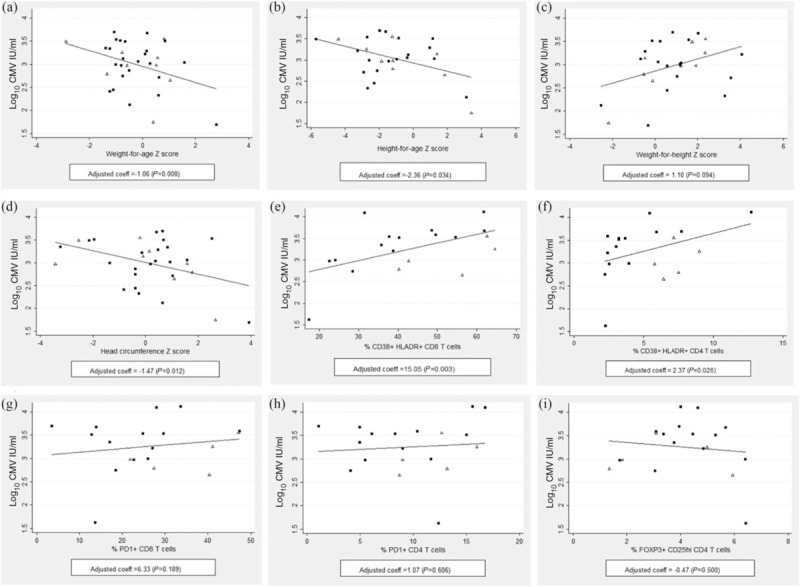
Fig. 2.
Relationship between CMV viraemia and anthropometry outcomes and T-cell phenotypes.

(a–d) Scatter plots with a linear regression line indicating the relationship between CMV viral load and infant weight-for-age, head circumference-for-age, height-for-age and weight-for-height Z-scores (N = 33). Following the Dunn–Šidák correction for multiple comparisons, significance was considered at P < 0.025. (e–i) Scatter plots with a linear regression line showing for the relationship between CMV viral load and T-cell phenotypes (N = 19). Following the Dunn–Šidák correction for multiple comparisons, significance was considered at P < 0.017. For all plots, the correlation coefficient is shown in a multivariable regression model following adjustments for age, gender and HIV exposure. For all plots, HUU infants are indicated as open triangles and HEU infants as filled squares. CMV, cytomegalovirus.
