

Here, Sarkar et al. report that PRKCI expression, which is a key feature of high-grade serous ovarian carcinoma (HGSOC), is also up-regulated in serous tubal intraepithelial carcinoma (STIC) and early fallopian tube (FT) lesions. Using a transgenic mouse model of ovarian cancer overexpressing PRKCI, they show that PRKCI is a deregulated ovarian cancer-specific oncogene and plays a role in early stages of cancer development.
Keywords: PRKCI, YAP, ovarian cancer
Abstract
A key feature of high-grade serous ovarian carcinoma (HGSOC) is frequent amplification of the 3q26 locus harboring PRKC-ι (PRKCI). Here, we show that PRKCI is also expressed in early fallopian tube lesions, called serous tubal intraepithelial carcinoma. Transgenic mouse studies establish PRKCI as an ovarian cancer-specific oncogene. Mechanistically, we show that the oncogenic activity of PRKCI relates in part to the up-regulation of TNFα to promote an immune-suppressive tumor microenvironment characterized by an abundance of myeloid-derived suppressor cells and inhibition of cytotoxic T-cell infiltration. Furthermore, system-level and functional analyses identify YAP1 as a downstream effector in tumor progression. In human ovarian cancers, high PRKCI expression also correlates with high expression of TNFα and YAP1 and low infiltration of cytotoxic T cells. The PRKCI–YAP1 regulation of the tumor immunity provides a therapeutic strategy for highly lethal ovarian cancer.
Epithelial ovarian cancer is the deadliest gynecological malignancy across the globe. High-grade serous ovarian carcinoma (HGSOC) is the most common and most aggressive subtype and is associated with the highest mortality rate. The 5-yr survival rate for HGSOC drops drastically from stage I to stage III/IV, with poor clinical outcomes attributed to widespread intraperitoneal dissemination and limited effective therapies for advanced disease.
Prevalent somatic copy number alteration is a prominent feature of the HGSOC genome (The Cancer Genome Atlas Research Network 2011). Amplification of the 3q26 locus is one of the most common alterations, observed in >70% of HGSOC cases. The minimal common amplified region of the 3q26 locus (containing 20 genes) across multiple tumor types includes PRKC-ι (PRKCI) (Hagerstrand et al. 2013), a gene encoding a serine threonine kinase belonging to the atypical protein kinase C (aPKC) family. Overexpression of PRKCI has been reported in lung (Regala et al. 2005a), pancreas (Scotti et al. 2010), stomach (Takagawa et al. 2010), colon (Murray et al. 2004), liver (Du et al. 2009), bile duct (Li et al. 2008), breast (Kojima et al. 2008), prostate (Ishiguro et al. 2009), and head and neck (Ginos et al. 2004) cancers. PRKCI is a putative oncogene in colon and lung cancer models, as its abrogation reduces tumorigenesis in genetically engineered mouse models of these diseases. Moreover, loss-of-function studies have shown that PRKCI maintains the tumor-initiating capacity of ovarian cancer cells (Wang et al. 2013). PRKCI amplification is associated with poor prognosis in ovarian cancers (Weichert et al. 2003; Eder et al. 2005; Zhang et al. 2006). However, definitive evidence that PRKCI is an ovarian cancer oncogene has not been reported.
Here we establish that PRKCI overexpression is an early event in human ovarian cancer, and enforced expression in the fallopian tube (FT) epithelium (FTE) can drive tumorigenesis in a transgenic mouse model, implicating PRKCI as a bona fide ovarian cancer oncogene. Mechanistically, PRKCI overexpression engenders an immune-suppressive tumor microenvironment with poor infiltration of cytotoxic T cells. We demonstrate that PRKCI promotes immune suppression via YAP1, which activates expression of proinflammatory cytokines, including TNFα.
Results
PRKCI up-regulation is an early and common event in ovarian neoplasms
Analysis of the HGSOC TCGA (The Cancer Genome Atlas) data set (see the Materials and Methods) revealed that 78% of samples (n = 409) harbor increased PRKCI somatic copy number with a significant positive correlation (rho = 0.46; P-value = 6 × 10⁻²³, Spearman correlation) between PRKCI transcript abundance and somatic copy number alterations (Fig. 1A). In a second independent ovarian cancer cohort, fluorescence in situ hybridization (FISH) confirmed PRKCI chromosomal locus amplification in 14 of 31 (45%) primary serous ovarian adenocarcinoma samples compared with no amplification detected in mucinous (five samples) and endometrial (two samples) carcinomas (Supplemental Fig. S1A). Correspondingly, in a third independent cohort, tumor tissue microarray (TMA) analyses documented PRKCI protein overexpression in serous ovarian carcinoma relative to normal ovarian tissue (Supplemental Fig. S1B,C). Specifically, blinded scoring by two expert pathologists concluded that 42 of 66 (64%) tumor cores exhibited high PRKCI expression (score: 2+ to 3+), and the majority of these high PRKCI-expressing tumors (29 of 42, 69%) was classified as serous subtype. Notably, all tumor cores graded as 3+ for PRKCI expression were classified as serous subtype.
Figure 1.
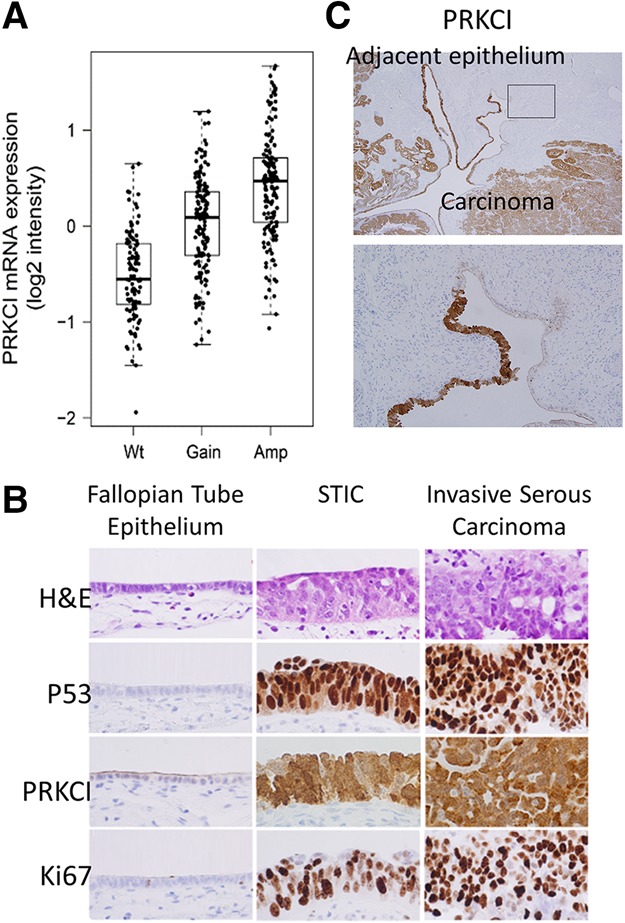
The PRKCI gene is amplified and overexpressed in serous ovarian carcinoma. (A) Ovarian serous carcinoma TCGA data analysis shows an increase in PRKCI mRNA expression concordant with the gain of an additional DNA copy (gain) and/or multiple copies (amplification). (B) PRKCI expression pattern in different pathological features of the morphological continuum from a normal FTE to invasive serous carcinoma by immunohistochemistry. Normal FTE, containing both secretory and ciliated cells, is typically immunonegative for TP53, Ki-67, and PRKCI. Upon progression to serous tubal intraepithelial carcinoma (STIC), there is an acquisition of PRKCI immunoreactivity similar to TP53. These cells also acquire a proliferative advantage, as evidenced by Ki-67 expression. High levels of PRKCI, TP53, and Ki-67 typically persist after STIC develops into invasive serous carcinoma. (C) PRKCI is expressed in adjacent histologically benign FTEs (showing no signs of proliferation) similar to TP53 immunoreactivity in continuum with ovarian carcinoma.
Interestingly, increased PRKCI expression was also observed in serous tubal intraepithelial carcinoma (STIC) (Fig. 1B,C), which is considered a candidate precursor lesion for HGSOC (Jones and Drapkin 2013). It is worth noting that the high PRKCI expression in STICs adjacent to a serous carcinoma mirrors the pattern of TP53 inactivation, a known early event in ovarian tumorigenesis, raising the possibility of a cooperative role of PRKCI and TP53 in the early evolution of ovarian cancer.
Whole-genome duplication is frequently observed in the late stages of HGSOC progression. We found that 111 of 170 (65%) TCGA HGSOC samples without genome duplication harbor somatic copy number alterations of PRKCI locus, further supporting the hypothesis that PRKCI amplification occurs early in HGSOC (Supplemental Fig. S1D). Together, these data support the view that high PRKCI expression may drive the genesis of HGSOC.
Enforced PRKCI expression cooperates with loss of Tp53 and Pten tumor suppressors in the transformation of the FTE
Early PRKCI expression in human STICs prompted development of a transgenic mouse model with a doxycycline-inducible system, enabling targeted expression of PRKCI in the FT secretory epithelium (FTSE). Specifically, we engineered tetO_LSL-PRKCI (iPRKCI) mice, which enables control of PRKCI expression in a temporal and spatial manner under the control of a tet operator with a lox–stop–lox cassette (Ying et al. 2012). This allele was combined with the Pax8_rtta and tetO_Cre (Pax8-Cre) transgenes to enable doxycycline-inducible PRKCI expression specifically in the FTSE (Supplemental Fig. S2A). Normally, Pax8 expression is not detected in either the mouse or human ovarian surface epithelium or the ciliated cells of the FT (Perets et al. 2013).
Thus, in this Pax8-Cre;iPRKCI model, doxycycline induced PRKCI expression in the FTE but not in the ovarian surface epithelium (Supplemental Fig. S2B). Histological analysis of the FTs of Pax8-Cre;iPRKCI mice identified accumulation of vacuolated structures and abnormal shape of the FTE (Supplemental Fig. S3A); however, tumor formation was not observed in these mice over a 40-wk course of doxycycline treatment, portending the need for additional genetic events to effect malignant transformation. Along these lines, it is notable that, while inactivation of the TP53 and PTEN pathway (including PIK3CA and AKT1/2/3 amplification or PTEN deletion) is frequently observed in human serous ovarian cancer (The Cancer Genome Atlas Research Network 2011; Kim et al. 2012), mouse models sustaining homozygous deletion of these tumor suppressors in the FTE generate STICs but fail to produce carcinomas of the ovary, FT, or peritoneum (Perets et al. 2013). These observations prompted the generation of mice possessing pax8-Cre;iPRKCI;PtenL/L;Tp53L/L (TPP) alleles (Supplemental Fig. S2C).
Murine female cohorts harboring Tp53L/L;PtenL/L;Pax8-Cre (TP) alleles with or without iPRKCI were administered doxycycline at weaning until euthanized. Doxycycline treatment induced Cre expression, which mediated deletion of Tp53L/L and PtenL/L alleles, and high PRKCI expression in mice harboring the iPRKCI allele. The doxycycline-treated TPP mice exhibited shorter overall survival compared with mice without doxycycline induction (P-value < 0.0001) (Fig. 2A). Similarly, doxycycline-treated TP mice exhibited overall better survival (P-value < 0.0026) relative to doxycycline-treated TPP mice (Fig. 2A). Three of 14 TP mice and seven of 31 TPP mice developed sarcomas on hindlimbs or forelimbs. All four of the 31 TPP mice that were euthanized due to poor health conditions exhibited STIC formation.
Figure 2.
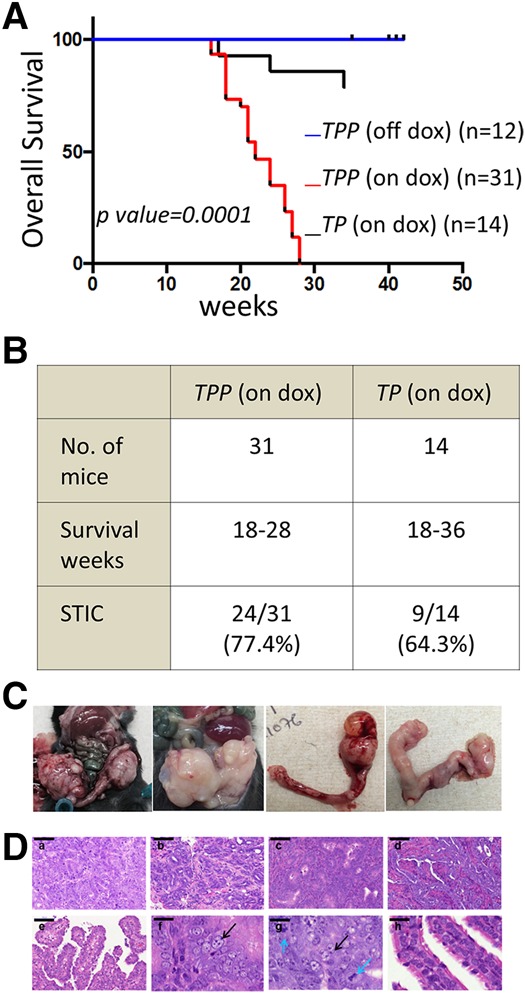
Transgenic PRKCI expression drives tumor formation in mice. (A) Kaplan-Meier analysis showing decreased overall survival of TPP mice when treated with doxycycline compared with untreated TPP mice or TP mice treated with doxycycline. (B) Phenotype summary of TPP and TP mice on doxycycline. (C) Gross anatomy of tumors in doxycycline-treated TPP mice. (D, panels a–e) H&E-stained cross-sections of tumors from TPP mice on doxycycline. Bar, 100 mm. (Panels f–g) Atypical nucleus morphology is marked with black arrows and the mitotic body is marked with blue arrows. Bar, 20 mm. (Panel h) Nuclei of normal FT. Bar, 20 mm.
Specifically, 13 of 31 TPP mice developed FT or ovarian tumors (Fig. 2B–D). In contrast, none of the 14 TP mice formed any FT or ovarian tumors, although nine of these 14 mice exhibited STIC formation (Fig. 2B). Since the Pax8 promoter drives gene expression in not only the FT but also the endometrium and liver (Perets et al. 2013), endometrial and liver tumor development was observed in some mice (Supplemental Fig. S3B).
The majority of TPP mice (24 of 31, 77%) developed STIC lesions characterized by large cells, loss of epithelial architecture, and marked nuclear atypia in their FT fimbriae (Fig. 3A). STIC lesions stained positive for PRKCI and exhibited an expansion of the PAX8-expressing secretory cells of the FT (Fig. 3B). In addition, STICs also expressed PAX2, a marker detected in HGSOC. Similar to human STICs, murine STICs exhibited proliferative activity (Ki-67) consistent with a transformed FT phenotype (Fig. 1B). Advanced malignant FT lesions of TPP mice displayed characteristic features of serous carcinoma, including marked nuclear atypia and increased proliferative index (Ki-67) as well as positive PAX8 and PAX2 staining (Fig. 3B), similar to human ovarian serous carcinoma (Fig. 1B; Tong et al. 2007; Xiang and Kong 2013). Together, the development of ovarian serous carcinomas as a result of PAX8-directed PRKCI overexpression in a Tp53L/L;PtenL/L genetic background provides strong genetic evidence that PRKCI serves as a bona fide ovarian cancer oncogene.
Figure 3.
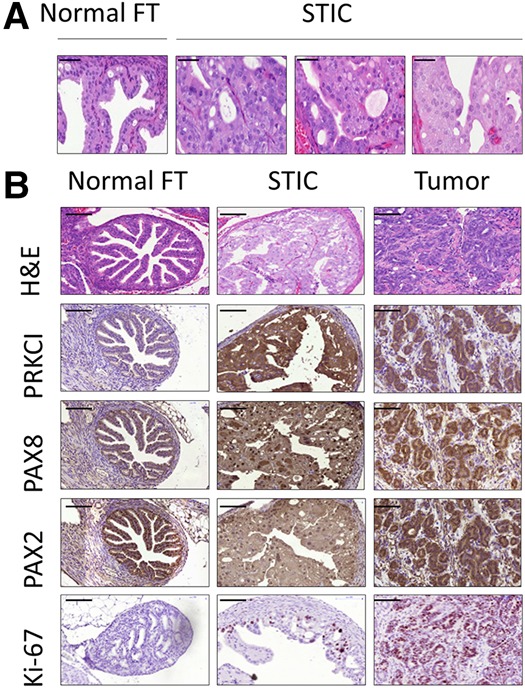
PRKCI overexpression transforms the FTE. (A) H&E-stained cross-sections of FTs from wild-type and TPP (on doxycycline) mice showing the transformation of the FTE. Bar, 50 mm. (B) Immunostaining for PRKCI, PAX8, PAX2, and Ki-67 showed increased expression in STIC lesions and tumors compared with normal FTs. Bar, 100 mm.
PRKCI promotes an immune-suppressive tumor microenvironment
To elucidate the mechanistic actions of PRKCI in ovarian cancer pathogenesis, the transcriptional profiles of five malignant tumors and three normal FT and ovarian tissues derived from wild-type mice (treated with doxycycline to control for the effect of doxycycline on gene transcription) were compared. We observed up-regulation of 712 genes and down-regulation of 1166 genes in tumors relative to normal FTs (fold change 1.7; q-value < 0.05) (Supplemental Table S1A,B). Gene set analysis of the up-regulated genes enriched for immune response-associated pathways (Supplemental Fig. S4A; Supplemental Table S1C) raised the possibility of a role for PRKCI in regulating tumor immune microenvironment.
A comparison of the infiltrating immune cells in tumors of TPP mice and FTs and ovaries from TP mice (Supplemental Fig. S4B) exhibited a significant increase in tumor-suppressive myeloid-derived suppressor cells (MDSCs), particularly the Ly6G+ granulocytic MDSCs, and a decrease in CD8+ T cells (Fig. 4A) in tumors. Consistently, elevated expression of proinflammatory molecules such as TNFα, S100A8/A9, IL6, IL1b, CSF3, and PTGS2 (Grivennikov et al. 2010) was observed in the tumors (Supplemental Table S1A). Reduced NK cell infiltration was also observed, suggesting that PRKCI may also impact innate immune response in the tumor microenvironment, possibly through increased MDSCs (Fig. 4A; Li et al. 2009). PRKCI expression was unchanged in splenic CD8+ T cells from iPRKCI mice with or without doxycycline treatment, thereby ruling out the possibility that the low CD8+ T-cell count in vivo was due to misexpression of the PRKCI transgene (Supplemental Fig. S4C). Similar percentages of both MDSCs and CD8+ T cells were observed when ovarian/FT tumors were grouped based on the presence of a secondary liver tumor in the mice (Supplemental Fig. S4D), suggesting that the presence of second tumor types had no detectable effect on the immune profile of the ovarian or FT cancer microenvironment.
Figure 4.
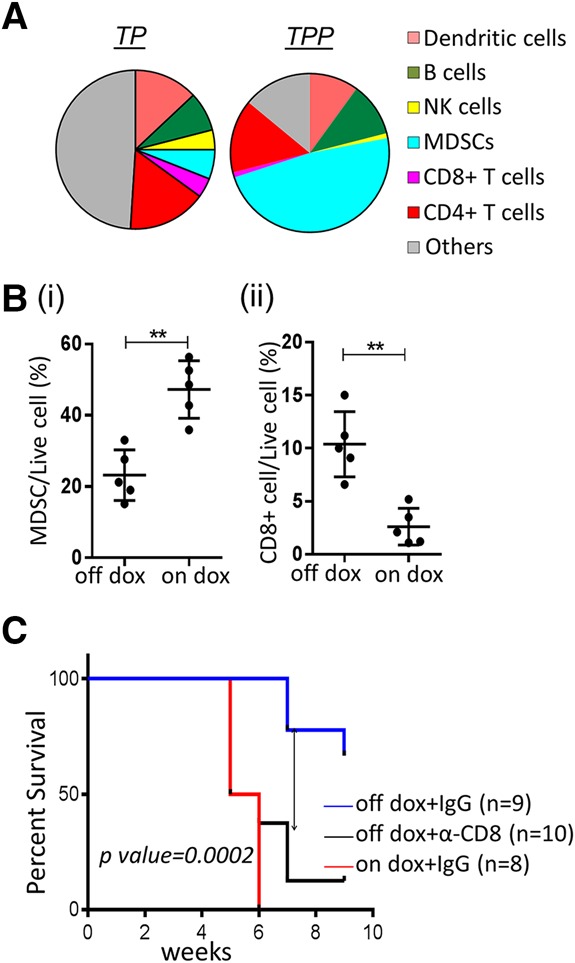
PRKCI promotes an immune-suppressive environment in tumors. (A) Pie chart representing immune profiles of TPP tumors and ovaries/FTs of TP mice (on doxycycline), showing increased MDSC and decreased T-cell infiltration in tumors. (B,C) Cells from a TPP tumor-derived cell line (named 333) were injected intraperitoneally into syngeneic mice (TPP mice lacking the Cre allele). (B) Immune profile of syngeneic tumors showing decreased MDSCs (panel i) and increased CD8+ T cells (panel ii) upon doxycycline withdrawal of established tumors. (C) Kaplan Meier plot showing decreased tumor-free survival of α-CD8 antibody-injected mice compared with isotype-matched control IgG antibody in the absence of doxycycline. Control IgG-injected mice on doxycycline (PRKCI-induced) show tumor-free survival comparable with α-CD8 antibody-injected mice.
Furthermore, tumorigenesis assays in syngeneic mice with a TPP tumor-derived cell line (named 333) supported the role of PRKCI in promoting an immune-suppressive microenvironment independent of any systemic effect. Following intraperitoneal injection of 333 cells into syngeneic female mice (lacking the Cre transgene), malignant tumors arose between 6 and 8 wk after initiation of doxycycline treatment (70% penetrance), compared with no tumors in mice without doxycycline treatment (P-value < 0.007) (Supplemental Fig. S4E). Modulation of PRKCI in mice harboring similar-sized established tumors (as determined by in vivo luciferase imaging) enabled us to better assess the role of PRKCI in shaping the tumor microenvironment. Continued doxycycline treatment (for an additional 10 d) fueled additional tumor growth, whereas those withdrawn from doxycycline maintained their original size (but did not regress significantly). The proliferative index (Ki67) decreased significantly in tumors taken off doxycycline compared with those kept on it (Supplemental Fig. S4F). Immune profiling revealed that tumors from doxycycline-withdrawn mice had lower MDSC and higher CD8+ T-cell counts compared with tumors from mice with continued doxycycline treatment, findings that mirror the spontaneously arising tumors of the TPP model (Fig. 4B). Tumors of varying sizes were examined to minimize the influence of tumor size on the immune profile; i.e., the mean sizes between the “doxycycline on” and the “doxycycline off” groups were not significantly different (Supplemental Fig. S5A). Tumors arising from 333 cells expressing PRKCI ectopically exhibited no significant difference in MDSC or CD8+ T-cell infiltration in the presence or absence of doxycycline, suggesting that doxycycline did not influence the tumor microenvironment (Supplemental Fig. S5B,C). Thus, PRKCI may promote tumorigenesis partly by promoting a tumor microenvironment characterized by abundant MDSCs and minimal CD8+ T cells.
MDSC and CD8+ T-cell depletion further confirmed this hypothesis. Specifically, α-Gr1 antibody injection (Supplemental Fig. S5D,E) reduced tumor formation (P-value < 0.04) in syngeneic mice injected with 333 cells and treated with doxycycline (PRKCI-induced) when compared with IgG control. Inversely, α-CD8 antibody injection (Supplemental Fig. S5F) in syngeneic mice injected with 333 cells and kept off doxycycline (no PRKCI induction) formed tumors in nine of 10 mice, while α-IgG treatment showed very minimal growth in two of nine mice (P-value < 0.0001) (Fig. 4C; Supplemental Fig. S5G). Tumor latency in α-CD8 antibody-treated mice (no PRKCI induction) was comparable with α-IgG-treated mice with continued PRKCI expression (on doxycycline) (P-value = ns). Thus, lack of PRKCI expression can be rescued partly by CD8+ T-cell depletion to promote tumor formation.
The clinical relevance of these data is supported by comparable PRKCI transcript levels in murine cell lines and HGSOC samples in the TCGA data set (Supplemental Fig. S5H). Specifically, PRKCI expression was induced 1.8-fold to 2.1-fold by doxycycline in 333, 291, and 387 cells In the TCGA data set, the median PRKCI expression for all ovarian tumor samples was 2.8-fold relative to median expression of eight normal FT samples derived from healthy donors previously identified to be negative for BRCA1 epigenetic silencing. Furthermore, 25% of samples expressed 3.9-fold more PRKCI than normal tissues. Thus, the levels of PRKCI expression in our models compares well with those observed in human ovarian cancers.
PRKCI activates TNFα-mediated migration of MDSCs
To understand the mechanisms underlying PRKCI-mediated recruitment of MDSCs into the tumor microenvironment, we profiled the conditioned medium from 333 cells treated with or without doxycycline (data not shown). PRKCI expression tracked with elevated expression of a set of cytokines, of which TNFα, IL6, IL10, and IL1β have been associated with MDSC accumulation in the tumor microenvironment. We further analyzed the mRNA expression of these cytokines by quantitative RT–PCR in tumor-derived cell lines 333, 291, and 387 in vitro. PRKCI induction by doxycycline increased expression of TNFα consistently and most significantly across all cell lines tested (Supplemental Fig. S6A). Enzyme-linked immunosorbent assay (ELISA) with cell supernatant from 333, 291, 387, and 709 tumor-derived cell lines also exhibited increased TNFα expression in association with PRKCI expression in all tumor-derived cell lines tested (Fig. 5A). Since ELISA for IL6, IL1β, and IL10 also did not increase significantly across all tumor-derived cell lines tested (data not shown), we further analyzed the role of TNFα in MDSC modulation in our system. In the in vivo setting, elevated TNFα expression was detected in the FTE of doxycycline-treated Pax8-Cre;iPRKCI mice as well as in STICs and malignant tumors of doxycycline-treated TPP mice (Supplemental Fig. S6B).
Figure 5.
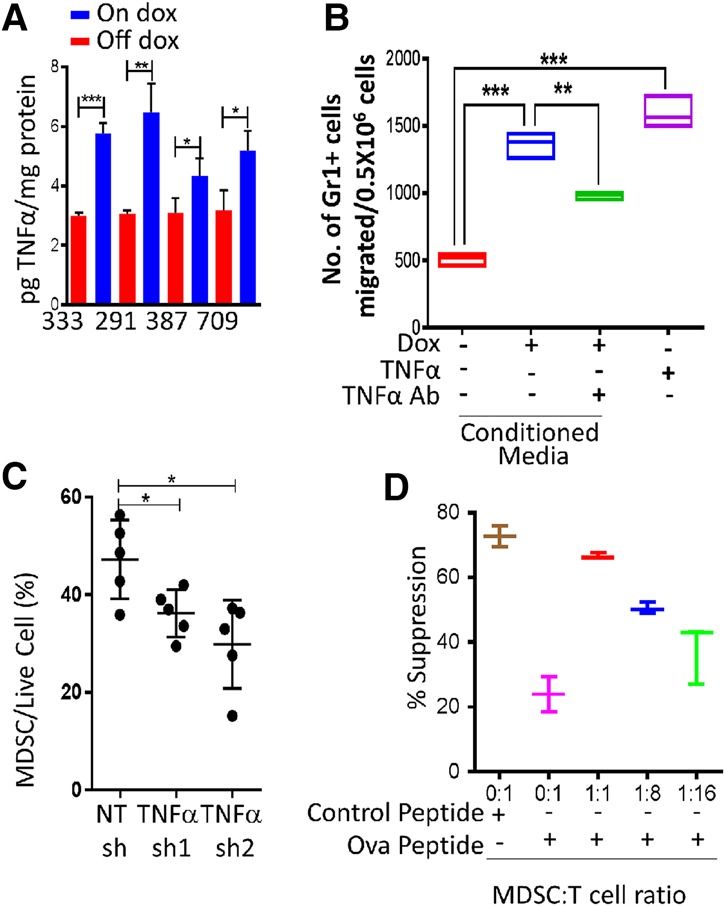
PRKCI regulates MDSC migration through the expression of TNFα. (A) TNFα ELISAs performed with conditioned media from tumor-derived cell lines 333, 291, 387, and 709 show secretion of TNFα upon PRKCI induction. Data were normalized to total protein in the supernatant. (B) MDSCs isolated from TPP (on doxycycline) tumors show increased migration in a transwell chamber with conditioned medium from 333 cells upon PRKCI induction by doxycycline or TNFα treatment. The increased migration is partially rescued by pretreating conditioned medium with a TNFα-neutralizing antibody. (C). Immune profile of syngeneic tumors showing that TNFα knockdown decreased MDSC infiltration. (D) In vitro T-cell suppression assay showing decreased CD8+ T-cell proliferation with increasing amounts of TPP (on doxycycline) tumor-derived MDSCs.
The observation of PRKCI-directed modulation of TNFα expression in our model also bears significance based on the well-established role of TNFα as a proinflammatory cytokine capable of promoting tumorigenesis in part via recruitment of MDSCs to the tumor microenvironment (Kulbe et al. 2012; Zhao et al. 2012) and inhibition of MDSC differentiation to enhance immune-suppressive activity (Sade-Feldman et al. 2013; Hu et al. 2014). More specifically, TNFα neutralization by etanercept and infliximab treatments in humanized TNFα knock-in mice results in delayed tumor growth of MCA 205 fibrosarcoma cells and significantly reduced accumulation of MDSCs (Atretkhany et al. 2016). Consistent with these reports, neutralizing antibody depletion of TNFα in conditioned medium from 333 cells resulted in decreased MDSC migration in a transwell chamber assay, and, reciprocally, TNFα supplementation to regular medium enhanced MDSC migration (Fig. 5B). To further validate the in vivo role of TNFα in MDSC recruitment, we knocked down TNFα (Supplemental Fig. S6C) in 333 cells expressing PRKCI and injected them into syngeneic mice. These cells formed tumors with increased latency and exhibited less MDSC infiltration compared with nontargeting control shRNA (Fig. 5C; Supplemental Fig. S6D). This is consistent with previous reports showing that TNFα receptor knockout in the hematopoietic system by bone marrow transplant significantly reduced tumor formation in C57BL/6 mice when injected with the ID8 mouse serous ovarian cancer cell line. We conclude that TNFα plays an important role in the recruitment of MDSCs, which impairs T-cell function in our model system. Finally, in vitro T-cell proliferation coculture assays with MDSCs derived from the TPP tumors confirmed that these MDSCs strongly suppressed T-cell proliferation, confirming their T-cell-suppressive activity (Fig. 5D). Supernatant from a coculture assay further established that the MDSCs can produce nitric oxide in vitro, through which it may suppress T-cell proliferation (Supplemental Fig. S5I).
PRKCI regulates the immune gene signature in human ovarian tumors
To ascertain the clinical relevance of our experimental observations, we investigated the relationship between PRKCI expression levels and immune signatures in the HGSOC TCGA transcriptional data set. A comparison of HGSOC samples with the highest PRKCI expression (n = 60; top 10%) and those with the lowest PRKCI expression (n = 60; bottom 10%) identified 1231 differentially expressed genes between the two categories (fold change = 1.3; adjusted P-value < 0.05). Gene set analysis of the 1231 genes revealed immune-related pathways as the most significantly enriched category (Fig. 6A; Supplemental Table S2A), with significant overlap with the genes differentially expressed in mouse tumors in relation to PRKCI levels. Although both BRCA and PRKCI induce ovarian tumor formation in TP mice, the gene signature of BRCA wild-type versus mutant tumors did not show any significant overlap of pathways with high-PRKCI tumors (Supplemental Table S2A). The common genes between the mouse and human TCGA data sets showed enrichment for immune-related pathways (Fig. 6B; Supplemental Table S2B). The correlation of high PRKCI expression and immune gene expression was validated by quantitative RT–PCR of four genes in an independent cohort of ovarian tumor samples (n = 28) (Supplemental Fig. S6E). Intersection of the 1231 differentially regulated genes and a MDSC signature (Wang et al. 2016) revealed significant overlap of 17 of 38 genes (45%; fold change >1.3; P-value = 1.6 × 10⁻¹⁰, Fisher exact test) (Fig. 6C; Supplemental Table S2C), suggesting that high PRKCI may promote MDSCs in the tumor microenvironment in HGSOC. Notably, in patient samples, we confirmed that PRKCI expression levels are inversely correlated with CD8+ T-cell count; specifically, ovarian tumors with higher PRKCI expression had lower CD8+ T-cell count (Fig. 6D). In conclusion, the clinical–pathological data, together with our experimental findings, indicate that PRKCI operates in ovarian cancer to create an immune-suppressive tumor environment via the recruitment of MDSCs and suppression of T-cell activity.
Figure 6.
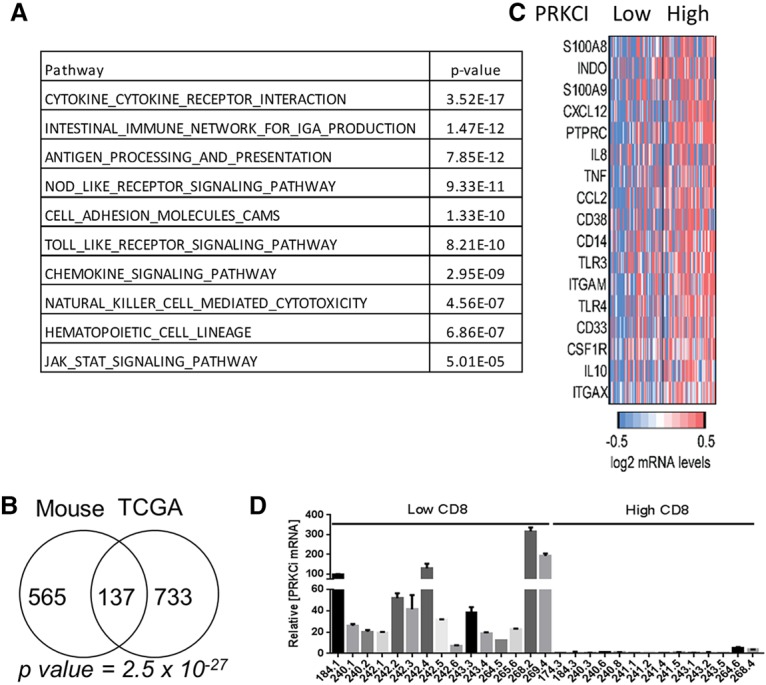
PRKCI regulates expression of immune response-associated genes in patients. (A) Ovarian TCGA data were grouped into the top 10% highest-expressing and bottom 10% lowest-expressing PRKCI samples. Gene set analysis of differentially expressed genes between high and low PRKCI-expressing tumors shows enrichment of immune response-related pathways. (B) Venn diagram showing the overlap of genes up-regulated in PRKCI-driven murine tumors and high PRKCI-expressing TCGA tumors. (C) Heat map showing MDSC signature genes significantly changed (fold change >1.3; P-value < 0.05) in high PRKCI-expressing TCGA tumor samples. (D) PRKCI expression level and T-cell infiltration in ovarian tumors were analyzed. T cells were counted by staining the paraffin-embedded section with α-CD8 antibody. The number of T cells was counted in 200× magnification; 15 fields were counted per sample. PRKCI mRNA level was analyzed by quantitative RT–PCR from RNA of the same tumor samples. Quantitative RT–PCR shows increased PRKCI transcript levels in ovarian tumors in patients with low CD8+ T-cell infiltration and vice versa.
PRKCI regulates immune suppression through YAP1 activity
To explore the molecular mechanism downstream from PRKCI that is responsible for regulating the immune response, immunoprecipitation of PRKCI followed by mass spectrometry was conducted in OVCAR8 cells (Supplemental Fig. S7A). This analysis identified multiple regulators of the hippo pathway that regulate YAP1 activity as binding partners of PRKCI, such as AMOT, LLGL1, PARD3, and PARD6. AMOT phosphorylation by PRKCI promotes YAP1 nuclear localization. LLGL1 has been identified previously as a key regulator of the Hippo pathway and is an established tumor suppressor in Drosophila, where its inactivation leads to enhanced tissue growth (Grzeschik et al. 2007). Depletion of LLGL1 (Grzeschik et al. 2010; Menendez et al. 2010; Sun and Irvine 2011) results in nuclear localization and activation of Yki, a key downstream effector of the Hippo signaling pathway. Additionally, overexpression of aPKC (Drosophila homolog for PRKCI) in Drosophila larval eye discs up-regulates Yki target genes (Grzeschik et al. 2010). YAP1, the human homolog of Yki, is a documented oncogene in ovarian cancer (Hall et al. 2010) and has been shown recently to be regulated by PRKCI in ovarian cancer cell lines (Wang et al. 2017). Furthermore, YAP1 has been shown to regulate immune suppression in prostrate tumors in mice through recruitment of MDSCs and suppression of CD8+ T cells (Wang et al. 2016). In light of this evidence, we evaluated whether PRKCI regulates immune suppression through YAP1 in ovarian cancer.
Although PRKCI-mediated YAP1 nuclear localization was observed in ovarian cancer cells (Wang et al. 2017), we tested whether PRKCI had a similar effect in vivo. PRKCI induction in FTs of iPRKCI mice increased YAP1 levels in both the cytoplasm and nuclei of these tissues. Similarly, increased YAP1 expression was observed in TPP tumors (Fig. 7A). Consistent with findings in mouse and human cell lines (data not shown), PRKCI and YAP1 expression were correlated in primary human HGSOC. On a TMA consisting of 38 human serous ovarian cancers, we found a positive correlation between PRKCI and YAP1 expression (Supplemental Fig. S7B,C). Specifically, 68.9% of tumors with high PRKCI expression (i.e.. scoring 2+ or 3+) exhibited high YAP1 expression (i.e., scoring 3+ or 2+). Furthermore, YAP1 nuclear staining positively correlated with PRKCI expression (Supplemental Fig. S7C,D).
Figure 7.
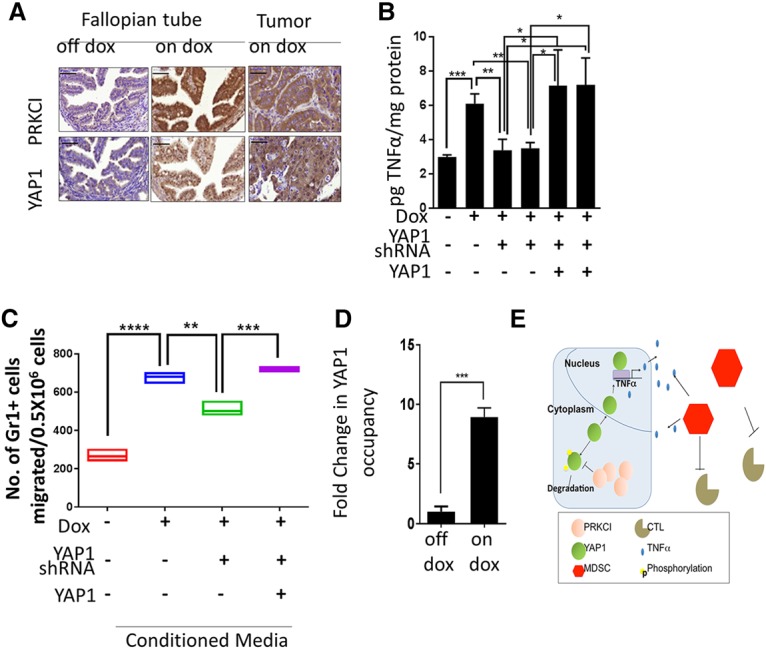
PRKCI regulates immune suppression through YAP1 activity. (A) Immunostaining showing increased nuclear YAP1 in the FTEs of Pax8-Cre;iPRKCI mice upon PRKCI induction and also in TPP (on doxycycline) tumors. Bar, 100 mm (B) TNFα ELISA with conditioned medium from 333 and 291 cells show reduced TNFα secretion upon YAP1 knockdown and rescue with a shRNA-resistant YAP1 clone. (C) MDSCs from TPP (on doxycycline) tumors show decreased migration in a transwell chamber with conditioned medium from 333 cells when expressing YAP1 shRNA and rescue with a shRNA-resistant YAP1 clone. (D) Chromatin immunoprecipitation in 333 cells shows eightfold enrichment of YAP1 on the TNFα promoter when treated with doxycycline to induce PRKCI expression. Data were normalized to enrichment on a nonspecific control region. (E) Model figure.
To determine whether YAP1 mediates PRKCI-directed immune suppression in the tumor microenvironment, YAP1 was knocked down in 333, 291, and 387 cells using shRNA targeted against the 3′ untranslated region (UTR) of YAP (Supplemental Fig. S7E). YAP1 down-regulation suppressed expression of TNFα transcripts (Supplemental Fig. S7F) and also decreased TNFα secretion in conditioned media from 333 and 291 cells, supporting that YAP1 activates TNFα expression downstream from PRKCI. These phenotypes were rescued by overexpression of YAP1 without the 3′ UTR sequence (Fig. 7B). Furthermore, YAP1 depletion in 333 cells rescued the increased transmigration of MDSCs observed upon PRKCI overexpression in these cells (Fig. 7C). Finally, the chromatin immunoprecipitation assay exhibited a more than eightfold increase in YAP1 occupancy on the TNFα promoter upon PRKCI induction with doxycycline in 333 cells compared with the “no doxycycline” control (Fig. 7D), suggesting that TNFα is a direct transcriptional target of YAP1 downstream from PRKCI. Taken together, these data support the hypothesis that PRKCI promotes nuclear localization of YAP1, leading to an up-regulation of TNFα expression, which then contributes to creating an immune-suppressive tumor-promoting microenvironment through MDSC recruitment and inhibition of cytotoxic T-cell infiltration (Fig. 7E).
Discussion
In this study, we established that PRKCI overexpression is an early event in human ovarian cancer, and its enforced expression in the FTE is oncogenic in a transgenic mouse model engineered with genetic alterations commonly observed in HGSOC. Mechanistically, PRKCI overexpression engenders an immune-suppressive tumor microenvironment with poor infiltration of cytotoxic T cells. PRKCI promotes immune suppression via YAP1, which activates expression of proinflammatory cytokines, including TNFα.
We describe a new mouse model of HGSOC that provides novel insights into various aspects of ovarian cancer biology. Since this tumor model harbors both preneoplastic STIC lesions and malignant tumors at high frequency, it supports the notion of distal FTs (fimbria) as the cell site of origin of HGSOC (Jones and Drapkin 2013). Furthermore, it could be a useful system for studying the initiation and progression of this disease in vivo, including identification of early diagnostic markers of HGSOC, which is a significant unmet clinical need in this disease.
Our study points to a novel oncogenic role of PRKCI in remodeling the ovarian tumor microenvironment. It promotes a protumorigenic state through expression of TNFα, promoting MDSC recruitment (Obermajer et al. 2011; Godoy et al. 2013). Increased expression of other cytokines, such as IL6, IL10, and IL1β, was also observed in certain cell lines, suggesting that PRKCI may regulate multiple cytokine signaling, which can modulate the tumor immune microenvironment. Previous studies have implicated the importance of these cytokines in ovarian tumor biology (Mustea et al. 2006; Coward et al. 2011; Hart et al. 2011; Pinciroli et al. 2013; Schauer et al. 2013; Isobe et al. 2015). Although we observed increased expression of other MDSC recruitment factors, such as S100A8, S100A9, and CXCL12, in transcriptomic analysis of whole-tumor tissue, no significant change was observed in tumor-derived cell lines upon PRKCI expression (data not shown), suggesting that these factors may be expressed by nontumor cells in the tumor microenvironment, which further helps in creating an immune-suppressive tumor microenvironment. Consistently, TNFα up-regulation has been implicated to play a role in ovarian tumor pathogenesis (Hassan et al. 1999; Muthukumaran et al. 2006; Szlosarek et al. 2006; Kulbe et al. 2007, 2012; Charles et al. 2009; Zhao et al. 2012). Increased TNFα expression by PRKCI may promote chronic inflammation that creates an immune-suppressive environment through recruitment of MDSCs and hence may contribute to ovarian tumor formation. The presence of ovarian epithelial inflammation has been positively associated with increased risk of ovarian cancer (Ness and Cottreau 1999; Wu et al. 2009; Clendenen et al. 2011). Moreover, ovarian epithelial inflammation driven by TNFα has been associated with increased risk of ovarian cancer (Maccio and Madeddu 2012; Trabert et al. 2014). The FT fimbriae are in very close proximity to the ovarian epithelium and experience the inflammatory milieu to which the ovarian surface epithelial cells are exposed. Hence, the FTs may also be inflamed, which can lead to the development of HGSOC. Although these studies associated ovarian epithelium inflammation, they never reported the status of the FTE in these studies. Consistent with the immune-suppressive activity of MDSCs in these tumors, significantly reduced lower cytotoxic T-cell infiltration was observed in serous ovarian tumors showing high PRKCI expression. Since spontaneous T-cell infiltration in solid cancers has been found to associate with a favorable clinical outcome (Zhang et al. 2003; Curiel et al. 2004; Kreike et al. 2007; Mahmoud et al. 2011; Rusakiewicz et al. 2013), high PRKCI expression would be predicted to be associated with poor survival. Indeed, high PRKCI levels predict poor patient survival in not only ovarian cancer (Weichert et al. 2003; Eder et al. 2005) but also other cancers, including lung (Regala et al. 2005b), pancreatic (Scotti et al. 2010), bile duct (Li et al. 2008), and prostate (Ishiguro et al. 2009) cancers. Whether PRKCI regulates the tumor microenvironment in these other tumor types remains to be determined.
Our study further provides important insight regarding the oncogenic role of YAP1 in ovarian cancer. First, we showed that YAP1 drives immune suppression in ovarian tumorigenesis. PRKCI-driven YAP1 nuclear localization increases YAP1 promoter activity, promoting expression of immune-suppressive genes such as TNFα. The role of YAP1 is consistent with other studies implicating hippo signaling and YAP1 in the regulation of immune genes in liver (Lu et al. 2010) and prostate cancers (Wang et al. 2016). Second, our study provides a genetic context for the roles of YAP1 and hippo signaling in cancers. Although YAP1 up-regulation and its oncogenic role in various human carcinomas have been reported, oncogenic mutations or somatic copy number alterations of YAP1 or its upstream regulators are rare (Harvey et al. 2013). Since our data suggest direct regulation of YAP1 by PRKCI, somatic copy number gain in PRKCI could be an indication of high YAP1 activity and therefore could provide genetic context for the inhibition of YAP1 activity as a therapeutic strategy.
In summary, we described a mouse model of ovarian cancer and showed that PRKCI dysregulation is an early event in ovarian carcinogenesis that promotes an immune-suppressive tumor microenvironment in cooperation with YAP1. In aggregate, our studies validate PRKCI as an ovarian oncogene, supporting its inhibition as a therapeutic option in ovarian cancer.
Materials and methods
TCGA data analysis
Copy number data used in this study were based on analysis of TCGA data using the ABSOLUTE algorithm (Carter et al. 2012). This data resource provides discrete copy number estimates and annotation of whole-genome duplication events. Agilent gene expression profiles for tumor samples were downloaded from the TCGA Firehose standard data repository released on February 22, 2013 (http://gdac.broadinstitute.org/runs/stddata__2013_02_22/data/OV/20130222/gdac.broadinstitute.org_OV.Merge_transcriptome__agilentg4502a_07_3__unc_edu__Level_3__unc_lowess_normalization_gene_level__data.Level_3.2013022200.0.0.tar.gz).
Gene expression analysis
Affymetrix mouse genome 430 2.0 array was performed for mRNA harvested from five iPRKCI ovarian tumors and three normal FTs. Robust multiarray average (RMA) method was used with default options (with background correction, quantile normalization, and log transformation) to normalize raw data from batches using R/Bioconductor's Affy package (Irizarry et al. 2003). Gene level summaries were generated using a custom CDF file (Mouse4302_Mm_ENTREZG) to eliminate cross-reacting probes and incorporate updated transcriptional annotations (Dai et al. 2005). A gene was called as differentially expressed if the FDR-corrected P-value was <0.05, calculated using the empirical Bayes method by eBayes function in Bioconductor's limma package. Differentially expressed genes were used in downstream analyses. For analysis of iPRKCI relative to normal FT expression experiments, a fold change filter of 1.7 was applied. TCGA samples were sorted by PRKCI expression, and a comparison between the expression profiles of the top 10% and bottom 10% was carried out with the limma package. Pathway enrichment analysis was carried out using the hypergeometric distribution to calculate the significance of overlap between differentially expressed genes and pathways annotated as Kyoto Encyclopedia of Genes and Genomes (KEGG) canonical pathways in The Molecular Signatures Database (MSigDB). Pathways dedicated to curing the diseases were excluded. Genes contained within the PRKCI amplicon were removed from the differential expression analysis in TCGA samples.
Cell lines
OVCAR8 (American Type Culture Collection) was validated by DNA fingerprinting, and mycoplasma testing was done every month using cell supernatant. 333, 291, 387, and 709 cells were derived from TPP tumors. Experiments with mouse and human cell lines were performed in separate tissue culture rooms.
Western blotting
Protein was harvested in RIPA buffer (Boston Bioproducts) with protease inhibitors (Roche). After centrifugation, proteins were separated using SDS-PAGE and transferred to nitrocellulose membrane using Bio-Rad Transblot Turbo. Membranes were incubated in 5% nonfat dry milk in TBS (0.1% TWEEN-20) followed by specific antibody. The antibodies used were YAP1 (Santa Cruz Biotechnology, sc-101199) and ACTIN (Sigma, A3854).
PRKCI complex purification
An N-terminal 6X-His-3X-Flag-PRKCI was constructed, and stable cell lines were generated expressing tagged PRKCI or control vector-expressing tag. Protein was harvested in lysis buffer (50 mM Tris at pH 7.4, 250 mM NaCl, 0.1% TX-100) with Complete mini protease inhibitor (Roche). The lysate was clarified by centrifugation and incubated for 4 h in Flag-M2 agarose bead slurry (Sigma-Aldrich). Beads were washed with buffer, and the protein complex was eluted with 3X-Flag peptide (Sigma-Aldrich). The eluate was then incubated with Ni beads at 4°C. Ni beads were washed with buffer, and protein was recovered by boiling with LDS lysis buffer. The polyacrylamide gel was then fixed and stained with silver stain (Thermo Fisher Scientific) according to the manufacturer's protocol.
Mouse experiments
All animal studies were approved by Harvard Medical School and The University of Texas M.D. Anderson Cancer Center Internal Animal Care and Use Committee (IACUC). Cells were mixed 7:3 with Matrigel (BD Biosciences) and implanted in female mice. Animals were monitored three times weekly until tumors were visible. Two-tailed t-test calculations were performed using Prism 5 (Graphpad) for P-values.
Generation of tumor model
TPP mice were generated by crossing Tp53L/L;PtenL/L (mixed background) mice with Pax8-rtta:TetO-Cre (C57BL/6) mice. These were then crossed to LSL-TetO-PRKCI (C57BL/6) mice.
Establishment of mouse tumor-derived cell lines
Tumors were dissected from euthanized mice, minced, and plated on tissue culture-treated dishes in DMEM + Glutamax medium (Gibco) with 10% serum and 1% penicillin/streptomycin (penstrep). Aseptic conditions were maintained to prevent contamination. The next day, tissue chunks were removed, the medium was changed, and doxycycline was added. Once cells became confluent, they were passaged and frozen for future experiments.
Harvesting of syngeneic tumors from mice
Tumor formation in mice was monitored by luciferase imaging. Mice were euthanized when they exhibited bloated appearance or were recommended for euthanasia by a veterinarian. For the doxycycline withdrawal experiment, all mice were harvested at the same time from both “on doxycycline” and “off doxycycline” groups.
Immunohistochemistry
Mouse tissues were fixed with 4% formalin and embedded in paraffin. Immunohistochemical studies were conducted using 5-µm sections of paraffin-embedded tissue mounted on precoated slides. The tissue was dewaxed with xylene and rehydrated through graded alcohol according to standard procedures. After antigen retrieval in citrate buffer for 10 min in the microwave at power level 7, the endogenous peroxidase activity was blocked with 3% H2O2 in methanol for 1 h. Blocking was done using Rodent Block M (Nobel Biocare). Slides were incubated with various antibodies with the working conditions detailed below. Secondary conjugation was done with HRP polymer (Nobel Biocare) specific for rabbits or mice. Staining was developed with a DAB kit (Vector Laboratories), and counterstaining was done with hematoxylin. The antibodies used were PRKCI (1:250; Sigma HPA026574), human YAP1 (1:250; Cell Signaling, 4912), mouse YAP1 (1:250; Novus Biologics, NB110-58358), Ki-67 (Dako), TP53 (1:500; Calbiochem, Ab-6), PAX8 (1:500; Proteintech, 10336), PAX2 (1:500; Invitrogen, 716000), and TNFα (1:200; Abcam, T8300).
TMA
TMA slides (ARY0062, lot no. 002) were obtained from Folio Biosciences. Each slide had 69 cases of ovarian carcinoma and three adjacent normal tissues with a single core per case. Each core was 1.5 mm in diameter and 5 µm thick. Scoring was determined by scanning each core at 20× magnification, and scores were assigned to the average intensity for each core. The highest expression was assigned a score of 3+, and lowest expression was assigned a score of 0+. Intermediate intensities were assigned 2+ or 1+ depending on the expression.
FISH
FISH analyses of ovarian cancer subtypes were used to determine the frequency of PRKCI copy number gain. Tissue microarrays were purchased from the Dana-Farber/Harvard Cancer Center Research Pathology Core or US Biomax. FISH was performed according to standard protocols with a few modifications. Briefly, immediately before protease treatment, slides were treated with 1% NaBH4 for 4 h at room temperature to quench endogenous autofluorescence. BAC clone RP11-81K8 was used to generate the PRKCI probe. Using BAC DNA as a template, 14 PCR products were designed, covering a 25-kb sequence across the PRKCI gene. Amplicon DNA was labeled by nick translation mix (Roche Diagnostics). Centromere-specific probe CEP 3(D3Z1) (Abbott Laboratories) served as a ploidy reference. FISH signal evaluation and image acquisition were performed manually using filter sets and software developed by Applied Spectral Imaging.
RNA isolation and quantitative RT–PCR
RNA was isolated from cells using Trizol following the manufacturer's instructions. cDNA was made by reverse transcription using SuperScript III mix (Invitrogen) with equal amounts of RNA. Quantitative RT–PCR was run on a Stratagene 3005P with primers for the respective genes. Actin mRNA levels were used as a normalizing control. Primers for quantitative RT–PCR were obtained from SA Biosciences.
Fluorescent-activated cell sorting
Single cells from tumors were harvested using tumor dissociation kit (Miltenyi Biotech) using the Gentle MACS following the manufacturer's guidelines. Cells were stained with fluorescence-conjugated antibodies and Sytox blue for cell viability. Cells were analyzed using an LSR Fortessa X-20 analyzer. Total events were gated based on the forward and side scatter of the density plots to remove all doublets and cellular debris. All dead cells were excluded based on Ghost dye 420 staining. Live cells were then gated for CD45 staining for total leucocytes followed by the following markers to define specific populations: MDSC (CD11b+Gr1+), T cells (CD3+, further classified into CD8+ or CD4+), B cells (B220+), dendritic cells (CD11c+), and NK cells (NK1.1). In order to identify positive data sets, the gating strategy included an unstained negative control of pooled cells. All of the fluorophores were compensated using UltraComp compensation beads (eBiosciences), and, for dead cells, compensation was done with a randomly selected cell sample that was stained with Ghost dye 420. Positive control samples were back-gated to confirm gating. Data were analyzed using FlowJo. Antibodies purchased from Biolegend were CD11b (101237), Ly-6G (127617), CD11c (117307), Ly-6C (128015), CD45 (103116), CD4 (100422), CD3 (100235), CD8a (100729), B220 (103247), and NK1.1 (108733). GR1 (108425) antibody was purchased from eBioscience.
ELISA
Mouse TNFα ELISA was purchased from R&D Systems. Conditioned medium from tumor-derived cell lines was collected after 48 h of doxycycline and LPS treatment and subjected to the assay according to the manufacturer's guidelines.
MDSC migration assay
Single cells were prepared from tumors as described above. Cells were labeled with CD45+-, Cd11b+-, and Gr-1-conjugated antibody and Sytox blue for cell viability. Positive cells were sorted using BD FACSAria Fusion (BD Biosciences). Sorted cells (0.3 × 10⁶ cells) were placed in the upper chamber of a BD Falcon transwell system (8 µm; BD Biosciences), and conditioned medium with vehicle, α-TNFα-neutralizing antibody (Abcam), or TNFα (Sigma-Aldrich) was added to the bottom chamber of a 24-well plate. For TNFα neutralization, conditioned medium was pretreated with antibody. Cells were allowed to migrate to the bottom well for 6 h at 37°C and 5% CO2. Migrated cells were then analyzed by flow cytometry using an LSR Fortessa X-20 analyzer. Migrated FITC-positive cells were gated to count the absolute number of cells that migrated through the transwell.
T-cell suppression assay
MDSCs were isolated from TPP tumors by flow cytometry as described above. CD8+ T cells were obtained from spleens of OT1 mice in a similar manner, washed, counted, and stained with carboxyfluorescein diacetate succinimidyl ester (CFSE) (Invitrogen) according to the manufacturer's instructions. Stained T cells were incubated with varying numbers of MDSCs in a 96-well plate for 72 h in the presence or absence of ovalbumin. T-cell proliferation was measured as a function of CFSE dilution and reported as a percentage of cells with diluted CFSE.
Chromatin immunoprecipitation
Cells (5 million per antibody) were cross-linked using 1% paraformaldehyde for 10 min at 37°C. Reactions were quenched using 0.125 M glycine for 5 min, and cells were washed with PBS and stored at −80°C. The next day, cells were thawed on ice and lysed with RIPA buffer (10 mM Tris-HCl at pH 8.0, 1 mM EDTA at pH 8.0, 140 mM NaCl, 1% Triton X-100, 0.2% SDS, 0.1% DOC) for 10 min on ice. Sonication was performed using a Branson Sonifier 250 to achieve a shear length of 200–500 base pairs. Antibodies (YAP1 [sc-15407] and rabbit IgG [Sigma]) were bound to Dynabeads for 1 h at 4°C. Extracts were then incubated overnight with an antibody–dynabead mixture. Immunecomplexes were washed five times with RIPA buffer, once with RIPA-500 (RIPA with 500 mM NaCl), and once with LiCl wash buffer (10 mM Tris-HCl at pH 8.0, 1 mM EDTA at pH 8.0, 250 mM LiCl, 0.5% NP-40, 0.5% DOC). Elution and decross-linking were performed in direct elution buffer (10 mM Tris-Cl at pH 8.0, 5 mM EDTA, 300 mM NaCl, 0.5% SDS) by incubating immunecomplexes for 4–16 h at 65°C. Proteinase K (20 mg/mL) and RNase A treatment was performed, and DNA was cleaned up using SPRI beads (Beckman-Coulter).
MDSC and CD8+ T-cell depletion assay
333 cells were injected intraperitoneally into syngeneic mice lacking the Cre transgene. All antibodies were purchased from BioXcell. For MDSC depletion, mice were fed doxycycline and injected intraperitoneally (200 µg per mouse) with α-Gr1 (BE0075) or IgG (BE0090) every other day. For CD8+ T-cell depletion one mice cohort was fed doxycycline and two cohorts were kept off doxycycline. α-CD8 antibody (BE0117) was injected intraperitoneally (200 µg per mouse) into one group of “off doxycycline” mice, and isotype-matched IgG (BE0090) was injected into the other group of “off doxycycline” mice as well as the “on doxycycline” group. Tumor formation was monitored by luciferase imaging.
Nitric oxide detection
T cells from OT1 mice was cocultured in the presence or absence of MDSCs isolated from tumors. Cell supernatant was collected and assayed for nitrite using the Greiss reagent system following the manufacturer's protocol (Promega).
Supplementary Material
Acknowledgments
S.S. was supported by the Ann and Sol Schreiber Mentored Investigator Award (POE/DF/02.2011), and S.Y.W. was supported by OCRF, Inc., and the Foundation for Women's Cancer, and Cancer Prevention (RP101502, RP101489, and P50CA083639). R.P. was supported by the Israeli Science Foundation, a European Commission FP7-PEOPLE-CIG grant, and the Israeli Cancer Association. R. Drapkin was supported by the Dr. Miriam and Sheldon Adelson Medical Research Foundation (AMRF), the Honorable Tina Brozman Foundation, the Robert and Debra First Fund, and the Department of Obstetrics and Gynecology at the University Of Pennsylvania Perelman School of Medicine. A.K.S. is supported by National Institutes of Health grants CA083639 and UH3TR000943. S.S. conceived and performed the experiments and wrote the manuscript; L.C., G.D., and R. DePinho wrote the manuscript; C.A.B. performed TCGA analysis; K.R., P.D., A.R.-C., S.M., E.H.-H., and S.J. performed experiments; M.H., A.J.L., and Q.C. performed pathology analysis; and R.P., J.F.L., M.S.H., R Drapkin, S.Y.W., M.M., and A.K.S. provided reagents, expertise, and feedback.
Footnotes
Supplemental material is available for this article.
Article published online ahead of print. Article and publication date are online at http://www.genesdev.org/cgi/doi/10.1101/gad.296640.117.
References
- Atretkhany KS, Nosenko MA, Gogoleva VS, Zvartsev RV, Qin Z, Nedospasov SA, Drutskaya MS. 2016. TNF neutralization results in the delay of transplantable tumor growth and reduced MDSC accumulation. Front Immunol 7: 147. [DOI] [PMC free article] [PubMed] [Google Scholar]
- The Cancer Genome Atlas Research Network. 2011. Integrated genomic analyses of ovarian carcinoma. Nature 474: 609–615. [DOI] [PMC free article] [PubMed] [Google Scholar]
- Carter SL, Cibulskis K, Helman E, McKenna A, Shen H, Zack T, Laird PW, Onofrio RC, Winckler W, Weir BA, et al. 2012. Absolute quantification of somatic DNA alterations in human cancer. Nat Biotechnol 30: 413–421. [DOI] [PMC free article] [PubMed] [Google Scholar]
- Charles KA, Kulbe H, Soper R, Escorcio-Correia M, Lawrence T, Schultheis A, Chakravarty P, Thompson RG, Kollias G, Smyth JF, et al. 2009. The tumor-promoting actions of TNF-α involve TNFR1 and IL-17 in ovarian cancer in mice and humans. J Clin Invest 119: 3011–3023. [DOI] [PMC free article] [PubMed] [Google Scholar]
- Clendenen TV, Lundin E, Zeleniuch-Jacquotte A, Koenig KL, Berrino F, Lukanova A, Lokshin AE, Idahl A, Ohlson N, Hallmans G, et al. 2011. Circulating inflammation markers and risk of epithelial ovarian cancer. Cancer Epidemiol Biomarkers Prev 20: 799–810. [DOI] [PMC free article] [PubMed] [Google Scholar]
- Coward J, Kulbe H, Chakravarty P, Leader D, Vassileva V, Leinster DA, Thompson R, Schioppa T, Nemeth J, Vermeulen J, et al. 2011. Interleukin-6 as a therapeutic target in human ovarian cancer. Clin Cancer Res 17: 6083–6096. [DOI] [PMC free article] [PubMed] [Google Scholar]
- Curiel TJ, Coukos G, Zou L, Alvarez X, Cheng P, Mottram P, Evdemon-Hogan M, Conejo-Garcia JR, Zhang L, Burow M, et al. 2004. Specific recruitment of regulatory T cells in ovarian carcinoma fosters immune privilege and predicts reduced survival. Nat Med 10: 942–949. [DOI] [PubMed] [Google Scholar]
- Dai M, Wang P, Boyd AD, Kostov G, Athey B, Jones EG, Bunney WE, Myers RM, Speed TP, Akil H, et al. 2005. Evolving gene/transcript definitions significantly alter the interpretation of GeneChip data. Nucleic Acids Res 33: e175. [DOI] [PMC free article] [PubMed] [Google Scholar]
- Du GS, Wang JM, Lu JX, Li Q, Ma CQ, Du JT, Zou SQ. 2009. Expression of P-aPKC-ι, E-cadherin, and β-catenin related to invasion and metastasis in hepatocellular carcinoma. Ann Surg Oncol 16: 1578–1586. [DOI] [PubMed] [Google Scholar]
- Eder AM, Sui X, Rosen DG, Nolden LK, Cheng KW, Lahad JP, Kango-Singh M, Lu KH, Warneke CL, Atkinson EN, et al. 2005. Atypical PKCι contributes to poor prognosis through loss of apical–basal polarity and cyclin E overexpression in ovarian cancer. Proc Natl Acad Sci 102: 12519–12524. [DOI] [PMC free article] [PubMed] [Google Scholar]
- Ginos MA, Page GP, Michalowicz BS, Patel KJ, Volker SE, Pambuccian SE, Ondrey FG, Adams GL, Gaffney PM. 2004. Identification of a gene expression signature associated with recurrent disease in squamous cell carcinoma of the head and neck. Cancer Res 64: 55–63. [DOI] [PubMed] [Google Scholar]
- Godoy HE, Khan AN, Vethanayagam RR, Grimm MJ, Singel KL, Kolomeyevskaya N, Sexton KJ, Parameswaran A, Abrams SI, Odunsi K, et al. 2013. Myeloid-derived suppressor cells modulate immune responses independently of NADPH oxidase in the ovarian tumor microenvironment in mice. PLoS One 8: e69631. [DOI] [PMC free article] [PubMed] [Google Scholar]
- Grivennikov SI, Greten FR, Karin M. 2010. Immunity, inflammation, and cancer. Cell 140: 883–899. [DOI] [PMC free article] [PubMed] [Google Scholar]
- Grzeschik NA, Amin N, Secombe J, Brumby AM, Richardson HE. 2007. Abnormalities in cell proliferation and apico–basal cell polarity are separable in Drosophila lgl mutant clones in the developing eye. Dev Biol 311: 106–123. [DOI] [PMC free article] [PubMed] [Google Scholar]
- Grzeschik NA, Parsons LM, Allott ML, Harvey KF, Richardson HE. 2010. Lgl, aPKC, and Crumbs regulate the Salvador/Warts/Hippo pathway through two distinct mechanisms. Curr Biol 20: 573–581. [DOI] [PubMed] [Google Scholar]
- Hagerstrand D, Tong A, Schumacher SE, Ilic N, Shen RR, Cheung HW, Vazquez F, Shrestha Y, Kim SY, Giacomelli AO, et al. 2013. Systematic interrogation of 3q26 identifies TLOC1 and SKIL as cancer drivers. Cancer Discov 3: 1044–1057. [DOI] [PMC free article] [PubMed] [Google Scholar]
- Hall CA, Wang R, Miao J, Oliva E, Shen X, Wheeler T, Hilsenbeck SG, Orsulic S, Goode S. 2010. Hippo pathway effector Yap is an ovarian cancer oncogene. Cancer Res 70: 8517–8525. [DOI] [PMC free article] [PubMed] [Google Scholar]
- Hart KM, Byrne KT, Molloy MJ, Usherwood EM, Berwin B. 2011. IL-10 immunomodulation of myeloid cells regulates a murine model of ovarian cancer. Front Immunol 2: 29. [DOI] [PMC free article] [PubMed] [Google Scholar]
- Harvey KF, Zhang X, Thomas DM. 2013. The Hippo pathway and human cancer. Nat Rev Cancer 13: 246–257. [DOI] [PubMed] [Google Scholar]
- Hassan MI, Kassim SK, Saeda L, Laban M, Khalifa A. 1999. Ovarian cancer-induced immunosuppression: relationship to tumor necrosis factor-α (TNF-α) release from ovarian tissue. Anticancer Res 19: 5657–5662. [PubMed] [Google Scholar]
- Hu X, Li B, Li X, Zhao X, Wan L, Lin G, Yu M, Wang J, Jiang X, Feng W, et al. 2014. Transmembrane TNF-α promotes suppressive activities of myeloid-derived suppressor cells via TNFR2. J Immunol 192: 1320–1331. [DOI] [PubMed] [Google Scholar]
- Irizarry RA, Hobbs B, Collin F, Beazer-Barclay YD, Antonellis KJ, Scherf U, Speed TP. 2003. Exploration, normalization, and summaries of high density oligonucleotide array probe level data. Biostatistics 4: 249–264. [DOI] [PubMed] [Google Scholar]
- Ishiguro H, Akimoto K, Nagashima Y, Kojima Y, Sasaki T, Ishiguro-Imagawa Y, Nakaigawa N, Ohno S, Kubota Y, Uemura H. 2009. aPKCλ/ι promotes growth of prostate cancer cells in an autocrine manner through transcriptional activation of interleukin-6. Proc Natl Acad Sci 106: 16369–16374. [DOI] [PMC free article] [PubMed] [Google Scholar]
- Isobe A, Sawada K, Kinose Y, Ohyagi-Hara C, Nakatsuka E, Makino H, Ogura T, Mizuno T, Suzuki N, Morii E, et al. 2015. Interleukin 6 receptor is an independent prognostic factor and a potential therapeutic target of ovarian cancer. PLoS One 10: e0118080. [DOI] [PMC free article] [PubMed] [Google Scholar]
- Jones PM, Drapkin R. 2013. Modeling high-grade serous carcinoma: how converging insights into pathogenesis and genetics are driving better experimental platforms. Front Oncol 3: 217. [DOI] [PMC free article] [PubMed] [Google Scholar]
- Kim J, Coffey DM, Creighton CJ, Yu Z, Hawkins SM, Matzuk MM. 2012. High-grade serous ovarian cancer arises from fallopian tube in a mouse model. Proc Natl Acad Sci 109: 3921–3926. [DOI] [PMC free article] [PubMed] [Google Scholar]
- Kojima Y, Akimoto K, Nagashima Y, Ishiguro H, Shirai S, Chishima T, Ichikawa Y, Ishikawa T, Sasaki T, Kubota Y, et al. 2008. The overexpression and altered localization of the atypical protein kinase Cλ/ι in breast cancer correlates with the pathologic type of these tumors. Hum Pathol 39: 824–831. [DOI] [PubMed] [Google Scholar]
- Kreike B, van Kouwenhove M, Horlings H, Weigelt B, Peterse H, Bartelink H, van de Vijver MJ. 2007. Gene expression profiling and histopathological characterization of triple-negative/basal-like breast carcinomas. Breast Cancer Res 9: R65. [DOI] [PMC free article] [PubMed] [Google Scholar]
- Kulbe H, Thompson R, Wilson JL, Robinson S, Hagemann T, Fatah R, Gould D, Ayhan A, Balkwill F. 2007. The inflammatory cytokine tumor necrosis factor-α generates an autocrine tumor-promoting network in epithelial ovarian cancer cells. Cancer Res 67: 585–592. [DOI] [PMC free article] [PubMed] [Google Scholar]
- Kulbe H, Chakravarty P, Leinster DA, Charles KA, Kwong J, Thompson RG, Coward JI, Schioppa T, Robinson SC, Gallagher WM, et al. 2012. A dynamic inflammatory cytokine network in the human ovarian cancer microenvironment. Cancer Res 72: 66–75. [DOI] [PMC free article] [PubMed] [Google Scholar]
- Li Q, Wang JM, Liu C, Xiao BL, Lu JX, Zou SQ. 2008. Correlation of aPKC-ι and E-cadherin expression with invasion and prognosis of cholangiocarcinoma. Hepatobiliary Pancreat Dis Int 7: 70–75. [PubMed] [Google Scholar]
- Li H, Han Y, Guo Q, Zhang M, Cao X. 2009. Cancer-expanded myeloid-derived suppressor cells induce anergy of NK cells through membrane-bound TGF-β 1. J Immunol 182: 240–249. [DOI] [PubMed] [Google Scholar]
- Lu L, Li Y, Kim SM, Bossuyt W, Liu P, Qiu Q, Wang Y, Halder G, Finegold MJ, Lee JS, et al. 2010. Hippo signaling is a potent in vivo growth and tumor suppressor pathway in the mammalian liver. Proc Natl Acad Sci 107: 1437–1442. [DOI] [PMC free article] [PubMed] [Google Scholar]
- Maccio A, Madeddu C. 2012. Inflammation and ovarian cancer. Cytokine 58: 133–147. [DOI] [PubMed] [Google Scholar]
- Mahmoud SM, Paish EC, Powe DG, Macmillan RD, Grainge MJ, Lee AH, Ellis IO, Green AR. 2011. Tumor-infiltrating CD8+ lymphocytes predict clinical outcome in breast cancer. J Clin Oncol 29: 1949–1955. [DOI] [PubMed] [Google Scholar]
- Menendez J, Perez-Garijo A, Calleja M, Morata G. 2010. A tumor-suppressing mechanism in Drosophila involving cell competition and the Hippo pathway. Proc Natl Acad Sci 107: 14651–14656. [DOI] [PMC free article] [PubMed] [Google Scholar]
- Murray NR, Jamieson L, Yu W, Zhang J, Gokmen-Polar Y, Sier D, Anastasiadis P, Gatalica Z, Thompson EA, Fields AP. 2004. Protein kinase Cι is required for Ras transformation and colon carcinogenesis in vivo. J Cell Biol 164: 797–802. [DOI] [PMC free article] [PubMed] [Google Scholar]
- Mustea A, Konsgen D, Braicu EI, Pirvulescu C, Sun P, Sofroni D, Lichtenegger W, Sehouli J. 2006. Expression of IL-10 in patients with ovarian carcinoma. Anticancer Res 26: 1715–1718. [PubMed] [Google Scholar]
- Muthukumaran N, Miletti-Gonzalez KE, Ravindranath AK, Rodriguez-Rodriguez L. 2006. Tumor necrosis factor-α differentially modulates CD44 expression in ovarian cancer cells. Mol Cancer Res 4: 511–520. [DOI] [PubMed] [Google Scholar]
- Ness RB, Cottreau C. 1999. Possible role of ovarian epithelial inflammation in ovarian cancer. J Natl Cancer Inst 91: 1459–1467. [DOI] [PubMed] [Google Scholar]
- Obermajer N, Muthuswamy R, Odunsi K, Edwards RP, Kalinski P. 2011. PGE(2)-induced CXCL12 production and CXCR4 expression controls the accumulation of human MDSCs in ovarian cancer environment. Cancer Res 71: 7463–7470. [DOI] [PMC free article] [PubMed] [Google Scholar]
- Perets R, Wyant GA, Muto KW, Bijron JG, Poole BB, Chin KT, Chen JY, Ohman AW, Stepule CD, Kwak S, et al. 2013. Transformation of the fallopian tube secretory epithelium leads to high-grade serous ovarian cancer in Brca;Tp53;Pten models. Cancer Cell 24: 751–765. [DOI] [PMC free article] [PubMed] [Google Scholar]
- Pinciroli P, Alberti C, Sensi M, Canevari S, Tomassetti A. 2013. An IL6-correlated signature in serous epithelial ovarian cancer associates with growth factor response. BMC Genomics 14: 508. [DOI] [PMC free article] [PubMed] [Google Scholar]
- Regala RP, Weems C, Jamieson L, Copland JA, Thompson EA, Fields AP. 2005a. Atypical protein kinase Cι plays a critical role in human lung cancer cell growth and tumorigenicity. J Biol Chem 280: 31109–31115. [DOI] [PubMed] [Google Scholar]
- Regala RP, Weems C, Jamieson L, Khoor A, Edell ES, Lohse CM, Fields AP. 2005b. Atypical protein kinase Cι is an oncogene in human non-small cell lung cancer. Cancer Res 65: 8905–8911. [DOI] [PubMed] [Google Scholar]
- Rusakiewicz S, Semeraro M, Sarabi M, Desbois M, Locher C, Mendez R, Vimond N, Concha A, Garrido F, Isambert N, et al. 2013. Immune infiltrates are prognostic factors in localized gastrointestinal stromal tumors. Cancer Res 73: 3499–3510. [DOI] [PubMed] [Google Scholar]
- Sade-Feldman M, Kanterman J, Ish-Shalom E, Elnekave M, Horwitz E, Baniyash M. 2013. Tumor necrosis factor-α blocks differentiation and enhances suppressive activity of immature myeloid cells during chronic inflammation. Immunity 38: 541–554. [DOI] [PubMed] [Google Scholar]
- Schauer IG, Zhang J, Xing Z, Guo X, Mercado-Uribe I, Sood AK, Huang P, Liu J. 2013. Interleukin-1β promotes ovarian tumorigenesis through a p53/NF-κB-mediated inflammatory response in stromal fibroblasts. Neoplasia 15: 409–420. [DOI] [PMC free article] [PubMed] [Google Scholar]
- Scotti ML, Bamlet WR, Smyrk TC, Fields AP, Murray NR. 2010. Protein kinase Cι is required for pancreatic cancer cell transformed growth and tumorigenesis. Cancer Res 70: 2064–2074. [DOI] [PMC free article] [PubMed] [Google Scholar]
- Sun G, Irvine KD. 2011. Regulation of Hippo signaling by Jun kinase signaling during compensatory cell proliferation and regeneration, and in neoplastic tumors. Dev Biol 350: 139–151. [DOI] [PMC free article] [PubMed] [Google Scholar]
- Szlosarek PW, Grimshaw MJ, Kulbe H, Wilson JL, Wilbanks GD, Burke F, Balkwill FR. 2006. Expression and regulation of tumor necrosis factor α in normal and malignant ovarian epithelium. Mol Cancer Ther 5: 382–390. [DOI] [PubMed] [Google Scholar]
- Takagawa R, Akimoto K, Ichikawa Y, Akiyama H, Kojima Y, Ishiguro H, Inayama Y, Aoki I, Kunisaki C, Endo I, et al. 2010. High expression of atypical protein kinase Cλ/ι in gastric cancer as a prognostic factor for recurrence. Ann Surg Oncol 17: 81–88. [DOI] [PubMed] [Google Scholar]
- Tong GX, Chiriboga L, Hamele-Bena D, Borczuk AC. 2007. Expression of PAX2 in papillary serous carcinoma of the ovary: immunohistochemical evidence of fallopian tube or secondary Mullerian system origin? Mod Pathol 20: 856–863. [DOI] [PubMed] [Google Scholar]
- Trabert B, Pinto L, Hartge P, Kemp T, Black A, Sherman ME, Brinton LA, Pfeiffer RM, Shiels MS, Chaturvedi AK, et al. 2014. Pre-diagnostic serum levels of inflammation markers and risk of ovarian cancer in the prostate, lung, colorectal and ovarian cancer (PLCO) screening trial. Gynecol Oncol 135: 297–304. [DOI] [PMC free article] [PubMed] [Google Scholar]
- Wang Y, Hill KS, Fields AP. 2013. PKCι maintains a tumor-initiating cell phenotype that is required for ovarian tumorigenesis. Mol Cancer Res 11: 1624–1635. [DOI] [PMC free article] [PubMed] [Google Scholar]
- Wang G, Lu X, Dey P, Deng P, Wu CC, Jiang S, Fang Z, Zhao K, Konaparthi R, Hua S, et al. 2016. Targeting YAP-dependent MDSC infiltration impairs tumor progression. Cancer Discov 6: 80–95. [DOI] [PMC free article] [PubMed] [Google Scholar]
- Wang Y, Justilien V, Brennan KI, Jamieson L, Murray NR, Fields AP. 2017. PKCι regulates nuclear YAP1 localization and ovarian cancer tumorigenesis. Oncogene 36: 534–545. [DOI] [PMC free article] [PubMed] [Google Scholar]
- Weichert W, Gekeler V, Denkert C, Dietel M, Hauptmann S. 2003. Protein kinase C isoform expression in ovarian carcinoma correlates with indicators of poor prognosis. Int J Oncol 23: 633–639. [PubMed] [Google Scholar]
- Wu AH, Pearce CL, Tseng CC, Templeman C, Pike MC. 2009. Markers of inflammation and risk of ovarian cancer in Los Angeles County. Int J Cancer 124: 1409–1415. [DOI] [PMC free article] [PubMed] [Google Scholar]
- Xiang L, Kong B. 2013. PAX8 is a novel marker for differentiating between various types of tumor, particularly ovarian epithelial carcinomas. Oncol Lett 5: 735–738. [DOI] [PMC free article] [PubMed] [Google Scholar]
- Ying H, Kimmelman AC, Lyssiotis CA, Hua S, Chu GC, Fletcher-Sananikone E, Locasale JW, Son J, Zhang H, Coloff JL, et al. 2012. Oncogenic Kras maintains pancreatic tumors through regulation of anabolic glucose metabolism. Cell 149: 656–670. [DOI] [PMC free article] [PubMed] [Google Scholar]
- Zhang L, Conejo-Garcia JR, Katsaros D, Gimotty PA, Massobrio M, Regnani G, Makrigiannakis A, Gray H, Schlienger K, Liebman MN, et al. 2003. Intratumoral T cells, recurrence, and survival in epithelial ovarian cancer. N Engl J Med 348: 203–213. [DOI] [PubMed] [Google Scholar]
- Zhang L, Huang J, Yang N, Liang S, Barchetti A, Giannakakis A, Cadungog MG, O'Brien-Jenkins A, Massobrio M, Roby KF, et al. 2006. Integrative genomic analysis of protein kinase C (PKC) family identifies PKCι as a biomarker and potential oncogene in ovarian carcinoma. Cancer Res 66: 4627–4635. [DOI] [PubMed] [Google Scholar]
- Zhao X, Rong L, Zhao X, Li X, Liu X, Deng J, Wu H, Xu X, Erben U, Wu P, et al. 2012. TNF signaling drives myeloid-derived suppressor cell accumulation. J Clin Invest 122: 4094–4104. [DOI] [PMC free article] [PubMed] [Google Scholar]
Associated Data
This section collects any data citations, data availability statements, or supplementary materials included in this article.