

Abstract
Metastasis is a complex biological process that has been difficult to delineate in human colorectal cancer (CRC) patients. A major obstacle in understanding metastatic lineages is the extensive intra-tumor heterogeneity at the primary and metastatic tumor sites. To address this problem, we developed a highly multiplexed single-cell DNA sequencing approach to trace the metastatic lineages of two CRC patients with matched liver metastases. Single-cell copy number or mutational profiling was performed, in addition to bulk exome and targeted deep-sequencing. In the first patient, we observed monoclonal seeding, in which a single clone evolved a large number of mutations prior to migrating to the liver to establish the metastatic tumor. In the second patient, we observed polyclonal seeding, in which two independent clones seeded the metastatic liver tumor after having diverged at different time points from the primary tumor lineage. The single-cell data also revealed an unexpected independent tumor lineage that did not metastasize, and early progenitor clones with the “first hit” mutation in APC that subsequently gave rise to both the primary and metastatic tumors. Collectively, these data reveal a late-dissemination model of metastasis in two CRC patients and provide an unprecedented view of metastasis at single-cell genomic resolution.
Metastasis is the primary cause of death in most human cancer patients (Mehlen and Puisieux 2006). Colorectal cancer (CRC) patients with primary tumors detected during colonoscopy often have good survival rates, but patients with late-stage (IV) disease have poor 5-yr survival rates of only 11% (American Cancer Society 2015). Large-scale cancer genome sequencing efforts have identified genes that are frequently mutated in primary CRC tumors, including APC, KRAS, NRAS, and TP53 (The Cancer Genome Atlas Network 2012). In addition to these common mutations, many low-frequency mutations have also been identified, suggesting extensive inter-patient heterogeneity (The Cancer Genome Atlas Network 2012). Further work has begun to investigate the mutational concordance of matched primary and metastatic tumors in CRC patients by next-generation sequencing. In a study that profiled microsatellite-stable (MSS) CRC patients, a large number of mutations were reported as being concordant between the primary and metastatic tumors, in addition to a small number of metastasis-specific mutations (Brannon et al. 2014; Tan et al. 2015).
The metastatic cascade is a complex biological process in which tumor cells escape the primary organ site, intravasate the circulation, and disseminate to distant organs (Valastyan and Weinberg 2011). Several competing models of metastasis have been proposed: (1) late dissemination; (2) early dissemination; and (3) self-seeding (Supplemental Fig. S1). The late-dissemination model is a unidirectional model, in which tumor cells evolve for an extended period of time at the primary tumor site, before acquiring specific mutations that enable the clones to disseminate. The early dissemination model posits that tumor cells disseminate at the earliest stages of primary tumor growth and that primary and metastatic tumors evolve in parallel (Klein 2009). An alternative model is self-seeding, which posits that tumor cells disseminate from the primary tumor, establish distant metastatic tumor sites, and then travel bidirectionally back to the primary tumor to promote its growth (Norton and Massague 2006).
Single-cell DNA sequencing methods have emerged as powerful new tools for resolving intra-tumor heterogeneity and tracing clonal lineages during tumorigenesis (Navin 2015; Wang and Navin 2015). Our group reported the development of the first single-cell DNA sequencing method (single-nucleus sequencing) and used this method to delineate aneuploidy evolution in breast tumors (Navin et al. 2011). Subsequent work from our group and others has led to the development of high-coverage single-cell sequencing methods to detect genome-wide mutations at base-pair resolution (Xu et al. 2012; Zong et al. 2012; Wang et al. 2014; Leung et al. 2015, 2016; Wang and Navin 2015; Gawad et al. 2016). Computational methods can be used to infer phylogenetic trees from single-cell sequencing data (Davis and Navin 2016; Jahn et al. 2016; Ross and Markowetz 2016). However, a major challenge is that current single-cell DNA sequencing methods are low-throughput and expensive. To address this challenge, we developed a high-throughput single-cell DNA sequencing method that utilizes library barcoding and a 1000 cancer gene panel to study clonal evolution during metastasis in two CRC patients.
Results
Experimental approach
We selected frozen primary colon cancer and matched liver samples from two CRC patients with metastatic disease (Fig. 1A). Both patients were classified as microsatellite-stable with invasive adenocarcinomas and late-stage (IV) disease (Methods). Nuclear suspensions were prepared and stained with DAPI for flow-sorting by ploidy. Cellular fractions were isolated by gating diploid (D) or aneuploid (A) distributions. In patient CRC1, the cell count histogram revealed a diploid (2N) and aneuploid (2.6N) distribution in the primary tumor and a diploid (2N) and aneuploid (2.9N) distribution in the liver metastasis (Fig. 1B). In patient CRC2, we identified a diploid (2N) and aneuploid (3.3N) distribution in the primary tumor and a diploid (2N) and aneuploid (3N) distribution in the liver metastasis (Fig. 1B). Millions of cells from the D and A peaks were gated and flow-sorted for exome and targeted cancer gene panel sequencing in CRC1 and CRC2. Single nuclei were isolated by FACS for single-cell copy number profiling or single-cell mutational profiling (Fig. 1C). Single-cell libraries were barcoded and pooled together (48 cells) for copy number profiling using single-nucleus sequencing (SNS) (Navin et al. 2011) or barcoded (96 cells) for highly multiplexed targeted sequencing using a 1000 cancer gene panel (T1000) that captures 12,500 exons and promoter regions (Leung et al. 2016). The exome capture platform and the T1000 cancer gene panel only overlap within the exonic regions. The resulting libraries were used for sequencing on the Illumina platform (Methods), and somatic variants were detected (Supplemental Fig. S2).
Figure 1.

Single-cell and bulk population experimental workflow. (A) The frozen primary tumors and liver metastases from two CRC patients were dissociated into nuclear suspensions and stained with DAPI. (B) Single nuclei and populations of cells were gated and flow-sorted by ploidy distribution. (C) To detect mutations, single nuclei were amplified by multiple-displacement-amplification (MDA), and libraries were captured using the T1000 cancer gene panel, while copy number detection was performed on single nuclei using DOP-PCR. Millions of cells were isolated in parallel for standard exome sequencing. Barcoded libraries were constructed and captured for targeted cancer gene panels or exome panels. Libraries were pooled for next-generation sequencing on the Illumina platform.
Bulk primary and metastatic mutations are concordant
To investigate mutational concordance between the primary and metastatic liver tumors, we performed deep-exome sequencing of millions of flow-sorted diploid or aneuploid cells. To distinguish germline from somatic mutations, we also sequenced matched normal tissue (Methods). The exome libraries were sequenced at high coverage depth (75.5×) and breadth (97.33%), where breadth is defined as the percentage of the targeted region with physical coverage of 1× or higher read depth (Supplemental Table S1). We detected 127 mutations in patient CRC1, of which 90 were nonsynonymous, and 80 of the nonsynonymous mutations were shared between the primary and metastatic tumors (Fig. 2A). Shared mutations included APC and KRAS, while metastasis-specific mutations included BOD1, TRRAP, GSTCD, and SNX19 (Supplemental Table S2). In patient CRC2, we identified 131 mutations, of which 107 were nonsynonymous, and 68 of the nonsynonymous mutations were shared between the primary and metastasis (Fig. 2B). Shared mutations in CRC2 included mutations in APC, TP53, CDK4, TOX, NRAS, and MYH11, while metastasis-specific mutations included FUS, SPEN, DAPK1, and FBN (Supplemental Table S2). Our data also identified a number of nonsynonymous mutations that changed VAF between the primary and metastatic sites (Fig. 2C,D). These mutations may reflect clonal selection during metastatic dissemination or may be due to differences in copy number. To distinguish between these two possibilities, we applied PyClone to normalize the VAFs by copy number events and calculated clonal frequencies. The resulting data suggest that a number of SNVs changed in frequency during metastatic dissemination, possibly due to selection at the metastatic tumor site (Supplemental Fig. S3).
Figure 2.

Concordance of mutations in bulk primary and metastatic tumors. (A,B) Scaled Venn diagrams reflect the total number of mutations (synonymous and nonsynonymous) identified by exome sequencing of the bulk flow-sorted tumor cells from the primary and metastatic tumors. (C,D) Dot plots showing the variant allele frequencies of the nonsynonymous mutations in the primary and metastatic tumors. (E) Targeted deep amplicon sequencing of the metastasis-specific mutations in the primary tumor and matched normal tissue. Significance of the mutations based on the variant read counts was determined using deepSNV and a Bayesian hypothesis test (Methods).
Metastasis-specific mutations were acquired after dissemination
The metastasis-specific mutations may have occurred in a rare subclone of the primary tumor prior to dissemination, or alternatively, after dissemination to the liver. To address this question, we performed ultradeep targeted sequencing on a subset of metastasis-specific mutations in the primary tumor. From these data, we investigated whether the metastasis-specific mutations existed at low frequencies in the primary tumor mass. Targeted amplicon sequencing was performed at 1,368,403× mean coverage depth for three metastasis-specific mutations in CRC1 and 18 metastasis-specific mutations in CRC2 (Fig. 2E). Bayesian hypothesis testing and deepSNV were used independently to determine the significance of each mutation frequency, relative to the background noise in the matched normal samples (Methods; Gerstung et al. 2012). This analysis identified no significant increases in the variant read counts in the primary tumors relative to the matched normal tissue sample, with the exception of GREB1, in which deepSNV reported a significant P-value (Fig. 2E; Supplemental Table S3). In contrast, all of VAFs between the metastasis and primary tumor were found to be significant (P < 0.05). These data suggest that most of the metastasis-specific mutations evolved after disseminating to the metastatic liver site. However, we cannot exclude the possibility that some of these mutations exist at frequencies below our detection sensitivity (1 × 10⁻³) in the primary tumor.
Mutational substructure of primary and metastatic tumors
To resolve the clonal substructure of the primary and metastatic tumors, we applied highly multiplexed single-cell DNA sequencing (Leung et al. 2016) to profile point mutations in 372 single cells using a 1000 cancer gene (T1000) panel. The single-cell sequencing data resulted in a mean coverage depth of 137× and average coverage breadth of 0.92 (Supplemental Table S4). In parallel, we sequenced millions of flow-sorted aneuploid tumor and normal cells using the T1000 cancer gene panel. To ensure the quality of single-cell analysis, we filtered single-cell data with low coverage depth and annotated variants based on variant/reference genotype read ratios (Methods; Supplemental Fig. S2). In total, we analyzed 178 and 182 single cells for CRC1 and CRC2, respectively. We first compared the single-cell mutation data on the T1000 platform to the bulk exome data (V2 exome capture platform) and found 100% concordance for mutations in the exonic regions (Supplemental Table S5).
To broadly identify subpopulations of cells that shared common mutations, we performed multidimensional-scaling (MDS) analysis using the cells sequenced with the T1000 platform (Fig. 3A,B). In both patients, we identified three major clusters of cells that corresponded to normal cells (N), primary tumor cells (P), and metastatic tumor cells (M). The normal cell clusters included diploid cells from both the primary colon and liver metastasis. The P clusters consisted mainly of aneuploid cells from the primary tumor, while the M cluster consisted of aneuploid tumor cells from the liver. However, a few cells sorted from the diploid fractions clustered with the primary aneuploid tumor cells in both patients, suggesting that they may have been missorted during FACS.
Figure 3.
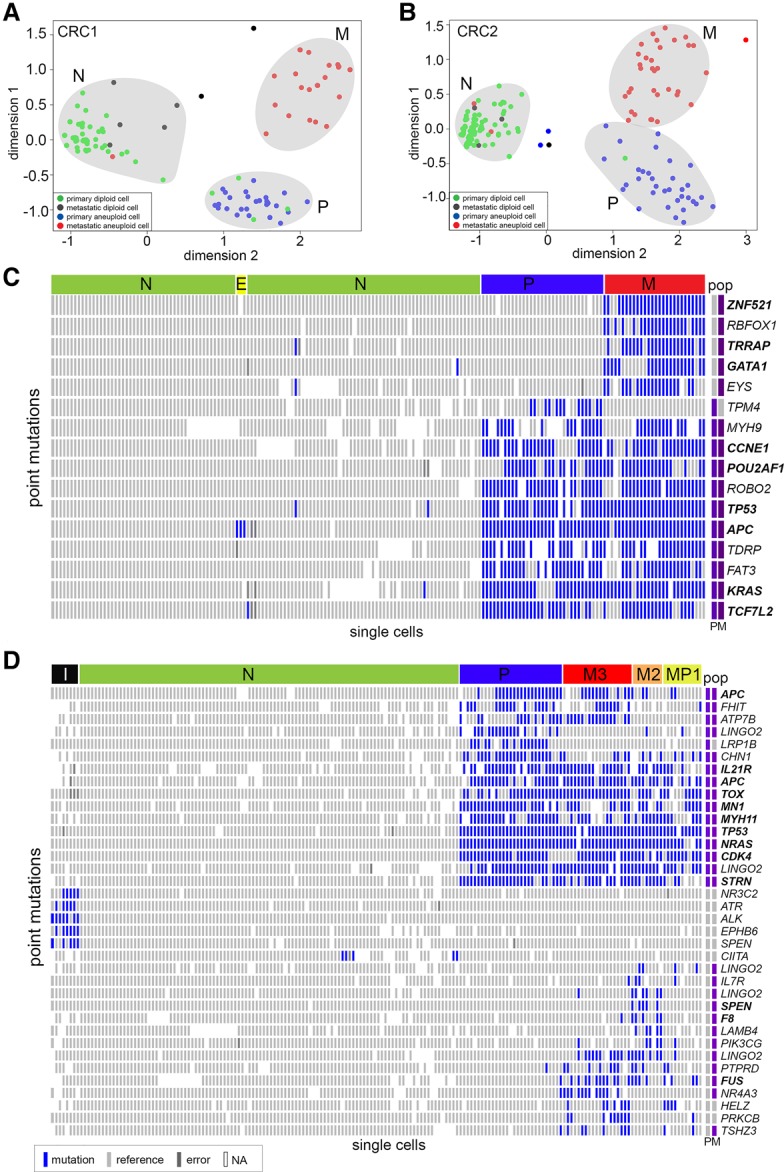
Single-cell mutational profiling of matched primary and metastatic tumors. Targeted cancer gene panel (T1000) sequencing data of point mutations in 372 single cells from the primary colon and liver metastatic tumors from patients CRC1 and CRC2. (A,B) Multidimensional scaling analysis, in which each dot represents a single cell. Cells are colored by the flow-sorting distribution from which they were isolated. (C,D) Two-dimensional clustered heat maps of the single-cell mutation data (T1000), with clusters labeled by color above. Nonsynonymous mutations are labeled in bold, while synonymous mutations are labeled in regular text. Populations of flow-sorted aneuploid tumor cells that were sequenced on the T1000 panel from the primary and metastatic tumors are shown on the right-hand side and labeled as “pop.” Blue bars represent mutations, light gray bars represent reference alleles, dark gray bars represent false-positives, and white bars represent sites with low or no coverage (NA).
To more carefully delineate the clonal architecture, we used two-dimensional hierarchical clustering to identify groups of single cells with similar mutational profiles (Fig. 3C,D; Supplemental Fig. 4A). Consistent with the MDS analysis, hierarchical clustering identified three major clusters of tumor cells in CRC1: the normal diploid cells (N), the primary aneuploid cells (P), and the metastatic aneuploid cells (M). Additionally, we identified a small subcluster of diploid cells (E) that were not evident in the MDS analysis (Fig. 3C). The aneuploid tumor cells from the primary and metastatic sites shared 10 common mutations, including driver mutations in APC, TP53, and KRAS. These data also identified five metastatic-specific mutations (ZNF521, RBFOX1, TRRAP, GATA1, EYS) and one primary-specific mutation (TPM4). Most of the diploid cells did not have mutations, suggesting that they are normal stromal cells. However, we did identify a rare subcluster (E) that consisted of three diploid cells with a single heterozygous nonsense mutation in APC (c.4012C>T).
In patient CRC2, the clustered heat map identified six major subpopulations: normal diploid cells (N), primary aneuploid cells (P), and three metastatic subpopulations (MP1, M2, M3), in addition to a minor independent subpopulation (I) (Fig. 3D; Supplemental Fig. 4B). In total, we identified 14 common mutations that were shared between the primary and metastatic tumors, including driver mutations in NRAS, APC, TP53, FHIT, and CDK4. We also identified two primary-specific mutations (LINGO2, LRP1B) and 14 metastasis-specific mutations (including SPEN, PIK2CG, FUS, and HELZ). Multiple mutations were detected in LINGO2, which made us suspect that they might be technical artifacts from PCR or sequencing; however, we found no evidence of this by analysis of strand bias, low coverage depth, or coinciding with regions of poor mappability. In CRC2, the metastatic tumor was composed of three major subpopulations (MP1, M2, and M3). The MP1 subpopulation consisted of both primary tumor cells and metastatic tumor cells, while M2 and M3 were composed of only metastatic tumor cells.
Identification of a rare APC progenitor subclone
Unexpectedly, the single-cell mutational data in CRC1 identified a rare subpopulation of three tumor cells (PD16, PD41, PDD93) that had diploid copy number and contained a single heterozygous mutation in APC (c.4012C>T, p.Gln1338Ter). This mutation was present in all of the subsequent primary and metastatic tumor cells (Fig. 3C). The three early tumor cells did not show evidence of harboring any of the other point mutations (e.g., KRAS, TP53, TCFL2) that were present in the major primary and metastatic tumor cells (Fig. 4). Interestingly, the heterozygous APC mutation was found to be homozygous in the aneuploid tumor cells, likely due to a hemizygous copy number loss that occurred in the later stages of tumorigenesis. These data suggest that APC was likely the first “hit” that initiated the colorectal tumor in this patient. The ancestral clones subsequently underwent genome-wide aneuploidy and expanded to form both the primary and metastatic tumors.
Figure 4.

Early APC progenitor cells detected in CRC1. Raw sequencing reads and variant alleles are plotted for three diploid APC progenitor cells (PD16, PD41, PDD93) and one representative primary tumor cell (PA74) from the major tumor population at genomic regions where mutations were detected in APC, KRAS, TP53, and TCF7L2. Plots and read counts were generated using the Integrative Genomics Viewer (IGV).
Copy number substructure of primary and metastatic tumors
To investigate the copy number substructure of the primary and metastatic tumors, we performed SNS (Navin et al. 2011). In total, 32 single nuclei were analyzed from CRC1 and 42 single nuclei from CRC2. Single-cell copy number profiles were calculated from read depth at 220-kb resolution (Methods). To identify clusters of cells that shared similar profiles, we applied MDS, which revealed three major clusters, representing normal diploid cells (N), primary tumor cells (P), and metastatic tumor cells (M) in both patients (Fig. 5A,B). In CRC1, the primary and metastatic clusters were discrete, suggesting only minor genomic variation. However, in patient CRC2, the metastatic cluster showed considerable cell-to-cell variation (ρ = 0.80, mean Spearman correlation) compared to the primary tumor cell cluster (ρ = 0.88, mean Spearman correlation), indicating a significant amount of intra-tumor heterogeneity in the metastasis.
Figure 5.

Single-cell copy number profiling of primary and metastatic tumors. (A,B) MDS plots of single-cell copy number profiles from patients CRC1 and CRC2. (C,D) Hierarchical one-dimensional clustered heat maps of single-cell integer copy number profiles from patients CRC1 and CRC2. Heat map colors correspond to the integer copy number values in the single cells. Clusters of cells with similar profiles are labeled in colored bars on the left-hand side, and cancer genes are annotated on the x-axis.
We performed a more detailed analysis of the copy number substructure using one-dimensional hierarchical clustering (Methods). In patient CRC1, the primary and metastatic cells shared highly similar profiles, including amplifications of several known oncogenes (EGFR, MET, CDK6, CDX2, WNT2, CDK8, ZNF217) and deletions of tumor suppressors (CTNNB1, APC, TP53, SMAD4, TP53) that have previously been reported in colon cancer (Fig. 5C; Xie et al. 2012). However, the primary tumor cells in CRC1 also contained an additional amplification of Chromosome 17q (ERBB2) and a 1.4-Mb homozygous deletion on Chromosome 4q32.3 that were not present in the metastasis. Similarly, the metastatic tumor cells showed an additional 47-Mb amplification on the X Chromosome that included the androgen receptor.
In patient CRC2, we identified a single cluster of normal diploid cells (N), a single cluster of major clones in the primary tumor (P), and two major clones (M1, M2) in the liver metastasis. The primary and metastatic tumor cells shared a large number of common CNAs, including amplification of oncogenes including CDX2, CDK8, JAK3, and ZNF217 (Fig. 5D). The CNAs distinguishing the primary and metastatic tumor cells included an additional amplification of Chromosome 9 (JAK2, CDKN2A) in the primary cells and amplifications of Chromosomes 3q, 8q, and 13p. While the primary tumor cells were highly clonal, the metastatic tumor cells clustered into two major subpopulations (M1, M2) that were distinguished by an amplification on 3q (ETV5, PIK3CA, BCL6) in M1 and amplification of Chr 8 in M2. To further investigate the genetic relationship between single-cell copy number profiles, we constructed phylogenetic trees using FastME (Nilsen et al. 2012; Lefort et al. 2015), which were highly consistent with the topologies of the hierarchical trees. (Supplemental Fig. S5).
Phylogenetic analysis reveals late dissemination and polyclonal seeding
To reconstruct clonal lineages during metastatic dissemination, we computed phylogenetic mutation trees using SCITE (Jahn et al. 2016). SCITE uses a Markov chain Monte Carlo (MCMC) algorithm to construct optimal mutation trees and then reattaches single cells at the nodes (see Methods). In patient CRC1, the mutation tree shows a linear series of mutations that occurred as the primary tumor mass evolved and seeded the metastatic tumor (Fig. 6A). The tumor initiated through a first “hit” in APC and subsequently evolved mutations in the KRAS oncogene, TP53 tumor suppressor, and CCNE1 oncogene, as well as six additional somatic mutations, and expanded to form the primary tumor mass. In the late stages of the primary tumor lineage, monoclonal seeding occurred, in which a single clone diverged and migrated to the liver, where it established the metastatic tumor. The point of metastatic divergence occurred after the acquisition of POU2AF1 mutation in the primary tumor lineage.
Figure 6.
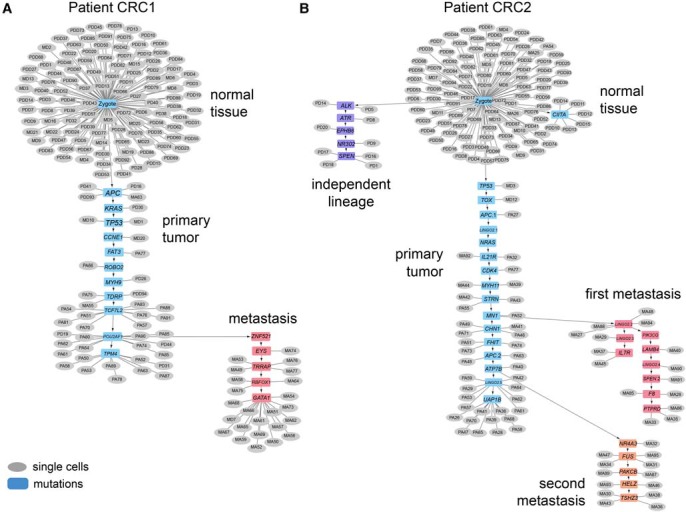
Mutational lineage trees of single cells during metastasis. Mutational trees calculated from single-cell mutation data using SCITE showing clonal lineages during tumor progression and metastasis. (A) Mutational lineage tree from patient CRC1 with a monoclonal seeding event. (B) Mutational lineage tree from patient CRC2 with polyclonal seeding events and an independent tumor lineage. Gray circles represent single cells, while blue boxes represent mutations.
In patient CRC2, we observed a more complex metastatic lineage in which late dissemination occurred as well as polyclonal seeding of two independent clones that established the metastatic liver tumor (Fig. 6B). The primary tumor initiated from the normal cells via mutations in TP53, APC, NRAS, and CDK4. These early truncal mutations (and others—e.g., TOX, MYH11) lead to the expansion of the primary tumor mass. Data from the bulk exome sequencing also support that these heterozygous mutations are truncal and occurred early in the lineage, with mutation frequencies of approximately 0.5. The first clone disseminated after acquiring a mutation in MN1 in the primary tumor and seeded the metastatic liver tumor, where the tumor cells continued to evolve a number of metastasis-specific mutations (e.g., IL7R, PIK3CG, SPEN and F8, PTPRD). During this time, the primary tumor cells continued to evolve in parallel with the first metastasis and acquired additional mutations in CHN1, FHIT, ATP7B and a second nonsense mutation in the APC tumor suppressor. The advanced primary tumor cells subsequently underwent a second seeding event after acquiring the ATP7B mutation. The second clone evolved in parallel to the first clone in the metastatic liver site and acquired additional mutations in NR4A3, FUS, PRKCB, HELZ, and TSHZ3 leading to further expansion of the liver tumor mass.
To more rigorously evaluate the accuracy of the SCITE tree and evidence for polyclonal seeding in CRC2, we performed a statistical analysis of the four “bridge mutations” in the primary tumor (CHN1, FHIT, APC, and ATP7B) that occurred between the first and second metastatic seeding events (Supplemental Fig. S6). We performed a mixture-model Bayesian binomial test (Methods) of the reference and variant read counts to determine if the bridge mutations were present in the primary tumor and the second metastasis but absent in the first metastasis, as indicated by the SCITE tree. The resulting probability heat map and read count data suggest that all four mutations were present in the primary tumor and provided strong evidence that FHIT and ATP7B were present in 10/13 and 13/13 tumor cells in the second metastasis and absent in the first metastasis (detected in only 1/15 and 1/15 cells), supporting two independent seeding events. However, this analysis also showed some uncertainty regarding the placement of the APC and CHN1 in the SCITE tree lineages, which may have not occurred between the first and second metastatic seeding events. We also investigated whether the four bridge mutations may have been lost in the second metastasis due to chromosomal deletions or LOH. Our data show that the copy number states did not change in the first and second metastasis (APC, CN = 3; ATP7B, CN = 4; CHN1, CN = 3; FHIT, CN = 2) and that the B-allele frequencies did not support copy-neutral LOH for these mutations in metastasis 1 (CHN1 = 0.279, FHIT = 0.245, APC = 0.268, ATP7B = 0.33), suggesting that their absence is unlikely to be explained by chromosomal loss.
To better understand the potential error rates based on the ordering of the SCITE tree, we calculated genotype matrices (Supplemental Fig. S7; Methods). Our data suggest that the false negative error rate for CRC1 is 7.89%, while the false positive rate is 1.52%. In CRC2, these data suggested a false negative error rate of 12.56% and a false positive error rate of 1.74%. These error rates are low for single-cell DNA sequencing data and suggest that the technical noise does not greatly confound the inference of the tree topologies.
Integrated phylogenetic trees
To better understand the timing of the CNA events relative to the mutational lineages, we integrated the two phylogenetic trees (Supplemental Fig. S8). In CRC1, these data suggest that the majority of CNA events were acquired early in the tumor lineage, after the APC mutations occurred. However, to integrate the copy number and mutation data in CRC2, we first needed to determine which copy number subpopulations (M1 and M2) matched the two mutation subpopulations (first, second). To address this question, we performed a statistical analysis of the sequence read density data for a marker (Chr 3q) in the single-cell mutation data that distinguished the CNA profiles. Our data showed that the coverage depth was significantly increased on Chr 3q (P = 0.006081) in the tumor cells from the first metastasis relative to the second metastasis, suggesting that it corresponded to the M1 copy number subpopulation (Supplemental Fig. S9). After integrating the two trees, the inferred copy number and mutation tree in CRC2 suggested that at least two major genomic instability events occurred: one event occurred at the earliest stages of tumor evolution, while the other event occurred in the primary tumor, after both metastatic seeding events.
Evolution of an independent primary tumor lineage
In patient CRC2, the single-cell mutation trees revealed an unexpected lineage that evolved independently and in parallel to the main tumor lineages (Fig. 6B). This rare subpopulation consisted of nine diploid tumor cells that evolved mutations in ALK, ATR, EPHB6, NR3C2, and SPEN and did not share any mutations with the major primary or metastatic aneuploid tumor cells (e.g., APC, NRAS, or TP53). These diploid tumor cells did not achieve prevalence in the primary tumor mass, nor did they metastasize to the liver. In summary, these data suggest that eight tumor cells represent a completely independent lineage that can be traced back to a different initiating cell in the normal colon tissue and evolved in parallel to the main tumor lineage.
Discussion
In this study, we applied single-cell DNA sequencing, exome sequencing, and targeted deep-sequencing to study clonal evolution during metastatic dissemination in two colon cancer patients. In both patients, our data support a late-dissemination model of metastasis, in which the primary tumor cells evolved for an extended period of time and acquired many mutations (e.g., KRAS, NRAS, APC, and TP53) and CNAs prior to disseminating to distant organ sites. The late-dissemination model is consistent with genomic data from pancreatic cancers (Yachida et al. 2010) and prostate cancers (Gundem et al. 2015) that report metastatic clones emerging in the later stages of primary tumor growth. In contrast to bulk sequencing methods, our single-cell data were able to distinguish between the self-seeding (bidirectional migration) and early-dissemination models of metastasis, for which we found no empirical evidence.
A major question in the field is whether metastatic tumors are seeded from a single clone (monoclonal seeding) or from multiple clones (polyclonal seeding) over the course of the disease. The data from CRC1 were consistent with monoclonal seeding; however, in CRC2, we observed polyclonal seeding of two independent clones that established the metastatic liver tumor. The first clone disseminated after acquiring many of the salient driver mutations (APC, NRAS, TP53, CDK4) in the middle of the primary tumor lineage, while the second clone evolved additional mutations prior to disseminating to the liver. These data are consistent with a multiregion sequencing study in which both monoclonal and polyclonal seeding were observed in different prostate cancer patients during metastasis (Gundem et al. 2015).
Our single-cell sequencing data revealed several unexpected findings. In CRC1, we identified a rare subpopulation of diploid cells (3/112) that carried a heterozygous nonsense mutation in APC but showed no evidence of any other somatic mutations. This APC mutation represents the “first hit” that initiated tumorigenesis in the colon epithelium and subsequently gave rise to the primary tumor and liver metastasis. Interestingly, these cells were diploid, suggesting that they had not yet undergone the complex aneuploid rearrangements observed in tumor cells. These data are consistent with the original model of colon cancer progression proposed over two decades ago, which posited that APC was the first hit that initiated colon cancer, prior to KRAS and TP53 mutations (Fearon and Vogelstein 1990). What is surprising is that these progenitor subclones remained in the advanced carcinoma at a relatively high frequency (2.6%) and were not outcompeted by other tumor clones, suggesting that they had a high fitness.
Another unexpected observation was an independent tumor lineage in CRC2. In the primary tumor, we observed a small subpopulation of diploid tumor cells that harbored a completely different set of mutations than the main tumor lineage. This independent subpopulation did not achieve prevalence in the primary tumor mass and did not metastasize to the liver. Phylogenetic analysis suggests that the tumor cells can be traced back to a different initiating normal cell in the colon tissue. These data are in contrast to the vast majority of tumor lineage studies published to date, which frequently (98.4% in 312 patients) report a set of truncal mutations that can be traced back to a single initiating normal cell (Gerlinger et al. 2012; Yates and Campbell 2012; Newburger et al. 2013; Wang et al. 2014; Zhang et al. 2014; McPherson et al. 2016). However, our independent lineages data are consistent with a few uncommon reports (∼1.6% of 312 patients) on tumor lineages, including deep-sequencing data of eyelid skin (Martincorena et al. 2015) and multiregion sequencing data from a single patient with lung cancer (de Bruin et al. 2014), a single patient with prostate cancer (Boutros et al. 2015), and two patients with multifocal prostate cancer (Cooper et al. 2015).
A late-dissemination model has several important clinical implications. This model is consistent with the clinical observation that treatment and surgical excision of local disease (even when the primary tumor is very advanced) can prevent the development of metastatic disease. Such intervention would not be possible in the context of an early-dissemination model, in which tumor cells would have already disseminated to distant organ sites at the earliest stages of the local disease. Another important clinical implication is that late dissemination implies that the primary and metastatic tumors share the majority of clinically relevant mutations. This is an important feature, since it means that a diagnostic biopsy of the primary tumor will be representative of the metastatic sites. Indeed, this was the case in both CRC patients in which the driver mutations (APC, KRAS, TP53, NRAS, CDK4) were found in both the primary and metastatic organ sites. These data are also consistent with previous NGS data that have reported a high concordance of primary and metastatic tumor mutations (Brannon et al. 2014; Tan et al. 2015).
While pioneering, our study also has several limitations. One notable limitation is that we analyzed only two CRC patients, and therefore our study represents a proof-of-concept that late-dissemination models of metastasis can occur in colon cancer but should not be interpreted as a common model in all CRC patients yet. Second, our studies examined only a single metastatic site (in the liver), and therefore we did not investigate seeding events to other common organ sites, such as the lung, brain, bones, or peritoneum. This will require samples collected from a warm autopsy program (Lindell et al. 2006).
In closing, this study provides an unprecedented view of metastasis in colon cancer patients at single-cell genomic resolution. Our study provides a comprehensive framework for studying the complexities of metastatic lineages that can be extended to many human cancer types. Such studies will soon become feasible as the cost and time for analyzing the genomes of thousands of single cells in parallel is realized through the development of new high-throughput technologies (Baslan et al. 2015; Leung et al. 2016; Zahn et al. 2017; Vitak et al. 2017). In the near future, the translation of these technologies into clinical practice will undoubtedly have a profound impact on reducing morbidity in cancer patients with metastatic disease.
Methods
Patient samples
Frozen tumor samples from two CRC patients (CRC1 and CRC2) were obtained from the MD Anderson Tumor Bank. CRC1 is a 77-yr-old CRC patient with invasive, moderately-to-poorly differentiated adenocarcinoma with liver metastasis. CRC2 is a 64-yr-old CRC patient with invasive, moderately differentiated adenocarcinoma with liver and lung metastasis. Both patients had metastatic disease diagnosed synchronously with the primary tumor. Neither patient received chemotherapy until after resection of both the primary and metastatic tumors.
Single-cell isolation
Nuclear suspensions were prepared from frozen tumors using an NST/DAPI buffer (800 mL of NST [146 mM NaCl, 10 mM Tris base at pH 7.8, 1 mM CaCl2, 0.05% BSA, 0.2% Nonidet P-40, and 21 mM MgCl2]), 200 mL of 106 mM MgCl2 and 10 mg DAPI. Sectioned tumors were cut and minced using surgical blades in a Petri dish in NST/DAPI buffer in the dark. Samples were filtered through a 36-µm plastic mesh to a 5-mL polystyrene tube. Nuclei were then sorted using FACSAria II (BD Biosciences), and single nuclei were deposited into individual wells on a 96-well plate for whole-genome amplification.
Single-cell genome amplification
For copy number profiling, single cells were amplified using DOP-PCR following the SNS protocol as previously described (Navin et al. 2011; Baslan et al. 2012). For mutational profiling, single-cell multiple-displacement-amplification (MDA) was performed using a 2:3 ratio of lysis buffer (200 mM KOH, 50 mM DTT):1× PBS solution. Each well of a 96-well plate was loaded with 3.5 µL of solution. After flow-sorting, the plate was centrifuged at 130g for 1 min at room temperature, after which 1.5 µL of neutralization buffer (900 mM Tris-HCl, 300 mM KCl, 200 mM HCl) was added into each well, and the plate was centrifuged. MDA was performed using Φ29 polymerase (NEB, M0269L) with 1 mM hexamers (with phosphorothioate modification at the last 2 bases) and 1 mM dNTP (NEB, N0446S). The final reaction volume was 50 µL per well. The MDA incubation was time-limited to 3 h at 30°C and 65°C for 3 min. A detailed description of the protocol and buffers was published by Leung et al. (2016).
Library construction
Whole-genome amplified DNA was fragmented using the Covaris Sonicator to 250 bp and purified using a Zymo DNA Clean & Concentrator Column kit (Zymo, D4004) according to the manufacturer's instructions. Barcoded next-generation sequencing libraries were constructed using the NEBNext end repair model (NEB, E6050L), dA-tailing module (NEB, E6053L), and quick ligation module (NEB, E6056L). Libraries were amplified via PCR using NEBNext HiFi2x PCRmix (NEB, M0541L). Targeted capture for single cells was performed using Nimblegen SeqCap EZ Choice Library, according to Leung et al. (2016). Exome capture for CRC1 population was performed on single-cell sequencing libraries using the TruSeq Exome Enrichment kit (Illumina, 15013230) following the manufacturer's instructions. Exome capture for CRC2 population was performed using a Nimblegen SeqCap EZ Exome V2 kit (Roche, 05860482001). For exome or targeted-capture sequencing, samples were sequenced on a 100 pair-end flow-cell on the Illumina HiSeq 4000 system. For copy number profiling, barcoded libraries were pooled using equimolar concentrations and sequenced at 76 single-read flow-cell on the Illumina HiSeq 2000 system.
Sequencing data alignment and processing
The FASTQ file was de-multiplexed for each single-cell library using our custom software (deplexer.pl). Individual FASTQ files were aligned to the human genome reference assembly (HG19) using Bowtie 2 (Langmead and Salzberg 2012) and converted to BAM files using SAMtools (Li et al. 2009). BAM files were processed by Picard to remove PCR duplicates. Realignment was performed around indel regions using the Genome Analysis Toolkit (GATK) (McKenna et al. 2010). Sequencing reads with mapping quality lower than 40 were removed. To calculate coverage metrics, we used a custom Perl script (cal-coverage_metrics.pl), which uses BEDTools (Quinlan and Hall 2010) to calculate coverage depth and breadth. Coverage breadth is defined as the percent of the genome or targeted regions with at least 1× depth. The aforementioned scripts can be downloaded from the Leung et al. paper published in Nature Protocols (Leung et al. 2016).
Variant detection and filtering
GATK was used to detect variants and generate a multicell VCF file. GATK was also used to recalibrate variant quality scores. We ran GATK with default parameters for depth (maximum read coverage = 250×). Mutations were filtered out and removed from analysis by consensus filtering (mutation must occur in at least four cells) and clustered regions (multiple mutations are detected within a 10-bp window). Variant annotation was performed on the VCF4 file using ANNOVAR (Wang et al. 2010). For matched normal bulk sample sequencing, each site with less than or equal to 100× was required to have at least 6× coverage, in which at least three reads were required to have variants. For sites with more than 100× coverage depth, at least 3% of reads were required to have variants. For single-cell samples, sites were required to have a minimum of 10× coverage. For 10–20× coverage, we required at least 10 variant reads. For 20–100× coverage depth, at least 30% of reads were required to have variants. For sites with 100–250×, at least 20% of reads were required to have variants. Sites excluded due to low (<10×) coverage were labeled as missing values (NA), whereas other nonvariant sites were labeled as reference. Please see Supplemental Figure S2 for a detailed flow chart of these steps.
Clustered mutation heat maps
Single-cell mutation heat maps were constructed using two-dimensional hierarchical clustering, using the heatmap.2 function from the “gplots” package available on CRAN (R Core Team 2013) (www.cran.r-project.org). The row and column distance was calculated by using dist(method = “Euclidean”) function and clustering was performed using hclust(method = “ward”). A passcode was assigned, with trinary values (0,1,2, representing homozygous reference, heterozygous, and homozygous variant, respectively) to generate a genotype matrix from the VCF file. The single-cell genotype matrix was filtered to reduce technical errors.
First, variants were removed if they appeared three times or less across all single cells. Second, a variant was retained only if it has coverage in at least 75% of cells in the heat map. Variants were then filtered if they occurred four times or less across all cells. For the remaining variant sites, we recovered true mutations at low-coverage regions, requiring a minimum of at least three variant reads to call the mutation. For sites with more than 100×, at least 3% of reads were required to be variant reads. Finally, false-positive errors in regions of poor mappability were annotated as errors (dark gray) in the final heat map.
Single-cell integer copy number calculation
Single-cell copy number profiles were calculated from sequence read depth as previously described using a “variable bin” method (Navin et al. 2011; Baslan et al. 2012). The variable binning intervals reduce mappability bias and false detection of CNA events when compared to scaffolds using fixed length-fixed bins. The median genomic length spanned by each bin is 220 kb. A blacklist of systematic aberrant bins was filtered to remove false-positive amplifications near the centromeric and telomeric regions. Absolute ratios were calculated as read counts per bin divided by the median read counts across all genomic bins, followed by Loess normalization to correct for GC bias (Baslan et al. 2012). For population segmentation, bincounts were divided by the mean bincount for each cell, and log2 was taken, to produce log-ratio values. For each patient, all log-ratio profiles were segmented by estimating shared changepoints using the R “copynumber” package, version 1.10.0 with regularization parameter γ = 40 (Nilsen et al. 2012). Copy number profiles were scaled to have a mean equal to the ploidy of the originating tumor, as estimated by flow cytometry. Profiles that lacked CNAs were assumed to be tumor stroma and were scaled to have ploidy 2. Scaled values were rounded to the nearest integer to yield integer copy numbers using custom R scripts (Supplemental Scripts).
Single-cell copy number clustering
Pairwise Euclidean distances were calculated from the single-cell copy number data matrix (log2[ratio + 0.1]) and then used for hierarchical clustering using ward-linkage in R using the heatmap.3 function from the “gplots” package available on CRAN (www.cran.r-project.org; www.r-project.org).
Balanced minimum evolution copy number tree
To normalize segment size and prevent large segments from contributing too much weight, the vector of segment means was used to construct an event matrix for phylogenetic inference. Pairwise distances were calculated using Manhattan distance rather than Euclidean distance to avoid large contributions from measurement error in small segments. Phylogenetic inference was performed using the balanced minimum evolution algorithm (Lefort et al. 2015), implemented in the R package “ape,” version 3.5 (Paradis et al. 2004).
Multidimensional-scaling analysis
MDS plots were constructing in R using the single-cell genotype binary matrix with columns as single cells and rows as mutations. Classical multidimensional scaling was performed with the following command: cmdscale(x, eig = TRUE, k = 2).
Inference of single-cell mutation trees
Mutational trees of single cells were calculated using SCITE and redrawn using Cytoscape (Shannon et al. 2003; Cline et al. 2007; Jahn et al. 2016). The binary genotype matrix of single cells and point mutations with missing values was used for tree inference. SCITE was run using a false-positive rate of 10%, a prior for allelic dropout rate with mean 30% and standard deviation 10%, one repetition, a chain length of 500,000, a 10% chance of proposing a new allelic dropout rate in each MCMC step, and a seed of 225 for the random number generator. Cells were attached to the resulting mutation tree in their maximum likelihood positions, breaking ties by placing them closer to the root, using a modified version of SCITE's output code and a custom R script (Supplemental Scripts). The resulting phylogenetic tree was plotted using Cytoscape.
Bayesian probabilities for deep-sequencing variants
The significance of differences in amplicon deep-sequencing of the normal and primary was determined using Bayesian hypothesis testing. Variant read counts were modeled using the beta-binomial distribution:
where i is the index of a mutation, VN,i and VP,i are the number of variant reads observed in the normal and primary, respectively, nN,i and nP,i are the total number of reads sequenced, pP,i and pN,i are the unknown true variant read frequencies, and τ is an unknown shared overdispersion parameter. If neither the normal nor the primary have the variant, then pP,i and pN,i are expected to be equal and represent the false-positive rate of the sequencing experiment.
For Bayesian hypothesis testing, the prior distribution used was
where Ii is the indicator function of pP,i = pN,i. τ has a vague prior appropriate without prior information about its likely values. The probability that there is no true difference is P(Ii = 1). P(Ii = 1) was calculated jointly for all mutations i with an MCMC algorithm. The MCMC was computed with rJAGS (https://cran.r-project.org/web/packages/rjags/index.html) (Supplemental Scripts). One chain was used, with 1000 adaption iterations, and a chain length of 1000. Significant difference was defined as P(Ii = 1) ≤ 0.05. For comparing amplicon deep-sequencing of the normal to exome sequencing of the metastasis, the same method was used to determine significance but with separate overdispersion parameters for the two samples to reflect the difference between the experiments.
deepSNV for deep-sequencing variants
Statistical significance of observed variants was calculated using deepSNV version 1.16.0, which detects variants assuming a beta-binomial model (Gerstung et al. 2012). To estimate the overdispersion parameter of the model, data from the targeted sites plus flanking regions of 20 bp on either side were used. deepSNV was used to calculate P values for the null hypothesis that the targeted variant was equally frequent in primary tumor and control using separate one-tailed likelihood ratio tests for each strand orientation and combining the P-values using Fisher's method. The code applying deepSNV is included in Supplemental Scripts.
Posterior probability for bridge mutations
“Bridge mutations” were defined as those mutations occurring between the two metastatic seeding events in CRC2 and estimated as the mutations between the two branchpoints in the mutation tree. Cells sequenced with the T1000 panel were used for the analysis. Cells sorted from the aneuploid peak were grouped into categories of “primary,” “first metastasic seeding,” and “second metastasic seeding” on the basis of their attachment positions in the mutation tree. Reference and variant read counts were retrieved for these mutations. For ease of visualization, cells in the matrix of read counts were colored according to an estimate of posterior probability that a variant is present. Posterior probabilities were calculated using the following statistical mixture model:
where i is the index of a cell, j is the index of a mutation, Vij is the number of variant reads in cell i at mutation j, τ is an overdispersion parameter, ϕj is the false-positive rate (probability that a read carries mutation j given that it is from a reference site), ψj is the true variant allele frequency of mutation j in individual cells (assumed to be the same for each cell carrying the mutation), nij the total number of reads sequenced at a site, and Iij the indicator of cell i carrying mutation j.
The prior was as follows:
For each mutation j, P(Iij = 1|data) was calculated jointly for all cells i with an MCMC algorithm. The MCMC was computed with rJAGS (https://cran.r-project.org/web/packages/rjags/index.html) (Supplemental Scripts). One chain was used, with a chain length of 10,000. These posterior probabilities were used to determine colors of sites in visualizing bridge mutation variant read counts in the heat map.
Inference of errors in single-cell genotypes
Theoretical single-cell genotype matrices were constructed by considering a cell to have a mutation if the cell node is a descendant of the mutation node on the single-cell mutation tree. A site was considered to be a false-negative if it is marked as mutated in the theoretical genotype matrix but as not mutated in the observed genotype matrix inferred from the data. A site was considered to be a false-positive if it is marked as not mutated in the theoretical genotype matrix but as mutated in the observed genotype matrix. The matrix of errors was plotted using ggplot2 (Wickham 2009). The R code for inferring errors is provided in the Supplemental Scripts.
Copy number and LOH analysis of T1000 cells in CRC2
Classification of cells in the first or second metastasis was defined by the SCITE lineage tree. To determine which metastatic subclone carried a 3q amplification, ratio values for each exon were calculated (read depth divided by average read depth of exons in cell), median ratio values within the 3q amplification region (defined as segments 30 and 31 detected from the copy number profiles) were calculated for each cell, and the difference between cells in the first and second metastasis was tested using a Wilcoxon rank-sum test. Calculation of read depths was performed using GNU Parallel (Tange 2011) and BEDTools (Quinlan and Hall 2010). Heterozygous SNPs were defined as those with at least 10 reads supporting both variant and reference in combined bulk exome from matched normal samples. For each bridge mutation, B-allele frequency in the first metastasis was calculated as the average of minimum (p,1−p) across first metastasis cells for each heterozygous SNP site on the same copy number segment, where p is the variant allele frequency of the SNP.
Data access
The sequencing data from this study have been submitted to the NCBI Sequence Read Archive (SRA; https://www.ncbi.nlm.nih.gov/sra) under accession number SRP074289.
Supplementary Material
Acknowledgments
This work was supported by the MD Anderson Colon Cancer Moonshot project and the Eric & Liz Lefkofsky Family Foundation. The research was also supported by grants to N.E.N. from the National Cancer Institute (NCI) (1R01CA169244-01) and the American Cancer Society (129098-RSG-16-092-01-TBG). N.E.N. is an Andrew Sabin Family Fellow. The study was supported by the MD Anderson Cancer Moonshot Knowledge Gap Award and the Center for Genetics & Genomics. M.L.L. is supported by a Research Training Award from the Cancer Prevention and Research Institute of Texas (CPRIT RP140106), and is also supported by the American Legion Auxiliary (ALA) and Hearst Foundations. A.D. is supported by the ALA and by the National Library of Medicine Training Program in Biomedical Informatics (4T15LM007093-25). This work was also supported by an RO1 grant to S.K. from NCI (RO1CA184843). This study was supported by the MD Anderson Sequencing Core Facility Grant (no. CA016672) and the Flow Cytometry Facility grant from NIH (no. CA016672). We thank Niko Beerenwinkle, Jack Kuipers, and Jahn Katharina for their assistance with SCITE.
Author contributions: M.L.L. performed experiments, analyzed data, and wrote the manuscript. A.D., R.G., A.C., and Y.W. analyzed data. E.S. reviewed and wrote the manuscript. D.M. provided tumor tissues. S.K. provided tumor tissues and analyzed data. N.E.N. analyzed data and wrote the manuscript. E.V. reviewed the manuscript.
Footnotes
[Supplemental material is available for this article.]
Article published online before print. Article, supplemental material, and publication date are at http://www.genome.org/cgi/doi/10.1101/gr.209973.116.
References
- American Cancer Society. 2015. What are the survival rates for colorectal cancer by stage? https://www.cancer.org/cancer/colon-rectal-cancer/detection-diagnosis-staging/survival-rates.html.
- Baslan T, Kendall J, Rodgers L, Cox H, Riggs M, Stepansky A, Troge J, Ravi K, Esposito D, Lakshmi B, et al. 2012. Genome-wide copy number analysis of single cells. Nat Protoc 7: 1024–1041. [DOI] [PMC free article] [PubMed] [Google Scholar]
- Baslan T, Kendall J, Ward B, Cox H, Leotta A, Rodgers L, Riggs M, D'Italia S, Sun G, Yong M, et al. 2015. Optimizing sparse sequencing of single cells for highly multiplex copy number profiling. Genome Res 25: 714–724. [DOI] [PMC free article] [PubMed] [Google Scholar]
- Boutros CP, Fraser M, Harding JN, de Borja R, Trudel D, Lalonde E, Meng A, Hennings-Yeomans HP, McPherson A, Sabelnykova YV, et al. 2015. Spatial genomic heterogeneity within localized, multifocal prostate cancer. Nat Genet 47: 1–14. [DOI] [PubMed] [Google Scholar]
- Brannon AR, Vakiani E, Sylvester BE, Scott SN, McDermott G, Shah RH, Kania K, Viale A, Oschwald DM, Vacic V, et al. 2014. Comparative sequencing analysis reveals high genomic concordance between matched primary and metastatic colorectal cancer lesions. Genome Biol 15: 454. [DOI] [PMC free article] [PubMed] [Google Scholar]
- The Cancer Genome Atlas Network. 2012. Comprehensive molecular characterization of human colon and rectal cancer. Nature 487: 330–337. [DOI] [PMC free article] [PubMed] [Google Scholar]
- Cline MS, Smoot M, Cerami E, Kuchinsky A, Landys N, Workman C, Christmas R, Avila-Campilo I, Creech M, Gross B, et al. 2007. Integration of biological networks and gene expression data using Cytoscape. Nat Protoc 2: 2366–2382. [DOI] [PMC free article] [PubMed] [Google Scholar]
- Cooper CS, Eeles R, Wedge DC, Van Loo P, Gundem G, Alexandrov LB, Kremeyer B, Butler A, Lynch AG, Camacho N, et al. 2015. Analysis of the genetic phylogeny of multifocal prostate cancer identifies multiple independent clonal expansions in neoplastic and morphologically normal prostate tissue. Nat Genet 47: 367–372. [DOI] [PMC free article] [PubMed] [Google Scholar]
- Davis A, Navin NE. 2016. Computing tumor trees from single cells. Genome Biol 17: 113. [DOI] [PMC free article] [PubMed] [Google Scholar]
- de Bruin EC, McGranahan N, Mitter R, Salm M, Wedge DC, Yates L, Jamal-Hanjani M, Shafi S, Murugaesu N, Rowan AJ, et al. 2014. Spatial and temporal diversity in genomic instability processes defines lung cancer evolution. Science 346: 251–256. [DOI] [PMC free article] [PubMed] [Google Scholar]
- Fearon ER, Vogelstein B. 1990. A genetic model for colorectal tumorigenesis. Cell 61: 759–67. [DOI] [PubMed] [Google Scholar]
- Gawad C, Koh W, Quake SR. 2016. Single-cell genome sequencing: current state of the science. Nat Rev Genet 17: 175–188. [DOI] [PubMed] [Google Scholar]
- Gerlinger M, Rowan AJ, Horswell S, Larkin J, Endesfelder D, Gronroos E, Martinez P, Matthews N, Stewart A, Tarpey P, et al. 2012. Intratumor heterogeneity and branched evolution revealed by multiregion sequencing. N Engl J Med 366: 883–892. [DOI] [PMC free article] [PubMed] [Google Scholar]
- Gerstung M, Beisel C, Rechsteiner M, Wild P, Schraml P, Moch H, Beerenwinkel N. 2012. Reliable detection of subclonal single-nucleotide variants in tumour cell populations. Nat Commun 3: 811. [DOI] [PubMed] [Google Scholar]
- Gundem G, Van Loo P, Kremeyer B, Alexandrov LB, Tubio JM, Papaemmanuil E, Brewer DS, Kallio HM, Hognas G, Annala M, et al. 2015. The evolutionary history of lethal metastatic prostate cancer. Nature 520: 353–357. [DOI] [PMC free article] [PubMed] [Google Scholar]
- Jahn K, Kuipers J, Beerenwinkel N. 2016. Tree inference for single-cell data. Genome Biol 17: 86. [DOI] [PMC free article] [PubMed] [Google Scholar]
- Klein CA. 2009. Parallel progression of primary tumours and metastases. Nat Rev Cancer 9: 302–312. [DOI] [PubMed] [Google Scholar]
- Langmead B, Salzberg SL. 2012. Fast gapped-read alignment with Bowtie 2. Nat Methods 9: 357–359. [DOI] [PMC free article] [PubMed] [Google Scholar]
- Lefort V, Desper R, Gascuel O. 2015. FastME 2.0: a comprehensive, accurate, and fast distance-based phylogeny inference program. Mol Biol Evol 32: 2798–2800. [DOI] [PMC free article] [PubMed] [Google Scholar]
- Leung ML, Wang Y, Waters J, Navin NE. 2015. SNES: single nucleus exome sequencing. Genome Biol 16: 55. [DOI] [PMC free article] [PubMed] [Google Scholar]
- Leung ML, Wang Y, Kim C, Gao R, Jiang J, Sei E, Navin NE. 2016. Highly multiplexed targeted DNA sequencing from single nuclei. Nat Protoc 11: 214–35. [DOI] [PMC free article] [PubMed] [Google Scholar]
- Li H, Handsaker B, Wysoker A, Fennell T, Ruan J, Homer N, Marth G, Abecasis G, Durbin R; 1000 Genome Project Data Processing Subgroup. 2009. The Sequence Alignment/Map format and SAMtools. Bioinformatics 25: 2078–2079. [DOI] [PMC free article] [PubMed] [Google Scholar]
- Lindell KO, Erlen JA, Kaminski N. 2006. Lessons from our patients: development of a warm autopsy program. PLoS Med 3: e234. [DOI] [PMC free article] [PubMed] [Google Scholar]
- Martincorena I, Roshan A, Gerstung M, Ellis P, Van Loo P, McLaren S, Wedge DC, Fullam A, Alexandrov LB, Tubio JM, et al. 2015. High burden and pervasive positive selection of somatic mutations in normal human skin. Science 348: 880–886. [DOI] [PMC free article] [PubMed] [Google Scholar]
- McKenna A, Hanna M, Banks E, Sivachenko A, Cibulskis K, Kernytsky A, Garimella K, Altshuler D, Gabriel S, Daly M, et al. 2010. The Genome Analysis Toolkit: a MapReduce framework for analyzing next-generation DNA sequencing data. Genome Res 20: 1297–1303. [DOI] [PMC free article] [PubMed] [Google Scholar]
- McPherson A, Roth A, Laks E, Masud T, Bashashati A, Zhang AW, Ha G, Biele J, Yap D, Wan A, et al. 2016. Divergent modes of clonal spread and intraperitoneal mixing in high-grade serous ovarian cancer. Nat Genet 48: 758–767. [DOI] [PubMed] [Google Scholar]
- Mehlen P, Puisieux A. 2006. Metastasis: a question of life or death. Nat Rev Cancer 6: 449–458. [DOI] [PubMed] [Google Scholar]
- Navin NE. 2015. The first five years of single-cell cancer genomics and beyond. Genome Res 25: 1499–1507. [DOI] [PMC free article] [PubMed] [Google Scholar]
- Navin N, Kendall J, Troge J, Andrews P, Rodgers L, McIndoo J, Cook K, Stepansky A, Levy D, Esposito D, et al. 2011. Tumour evolution inferred by single-cell sequencing. Nature 472: 90–94. [DOI] [PMC free article] [PubMed] [Google Scholar]
- Newburger DE, Kashef-Haghighi D, Weng Z, Salari R, Sweeney RT, Brunner AL, Zhu SX, Guo X, Varma S, Troxell ML, et al. 2013. Genome evolution during progression to breast cancer. Genome Res 23: 1097–1108. [DOI] [PMC free article] [PubMed] [Google Scholar]
- Nilsen G, Liestøl K, Van Loo P, Moen Vollan HK, Eide MB, Rueda OM, Chin SF, Russell R, Baumbusch LO, Caldas C, et al. 2012. Copynumber: efficient algorithms for single- and multi-track copy number segmentation. BMC Genomics 13: 591. [DOI] [PMC free article] [PubMed] [Google Scholar]
- Norton L, Massague J. 2006. Is cancer a disease of self-seeding? Nat Med 12: 875–878. [DOI] [PubMed] [Google Scholar]
- Paradis E, Claude J, Strimmer K. 2004. APE: analyses of phylogenetics and evolution in R language. Bioinformatics 20: 289–290. [DOI] [PubMed] [Google Scholar]
- Quinlan AR, Hall IM. 2010. BEDTools: a flexible suite of utilities for comparing genomic features. Bioinformatics 26: 841–842. [DOI] [PMC free article] [PubMed] [Google Scholar]
- R Core Team. 2013. R: a language and environment for statistical computing. R Foundation for Statistical Computing, Vienna, Austria: http://www.R-project.org/. [Google Scholar]
- Ross EM, Markowetz F. 2016. OncoNEM: inferring tumor evolution from single-cell sequencing data. Genome Biol 17: 69. [DOI] [PMC free article] [PubMed] [Google Scholar]
- Shannon P, Markiel A, Ozier O, Baliga NS, Wang JT, Ramage D, Amin N, Schwikowski B, Ideker T. 2003. Cytoscape: a software environment for integrated models of biomolecular interaction networks. Genome Res 13: 2498–2504. [DOI] [PMC free article] [PubMed] [Google Scholar]
- Tan IB, Malik S, Ramnarayanan K, McPherson JR, Ho DL, Suzuki Y, Ng SB, Yan S, Lim KH, Koh D, et al. 2015. High-depth sequencing of over 750 genes supports linear progression of primary tumors and metastases in most patients with liver-limited metastatic colorectal cancer. Genome Biol 16: 32. [DOI] [PMC free article] [PubMed] [Google Scholar]
- Tange O. 2011. GNU Parallel: the command-line power tool. USENIX Magazine 36: 42–47. [Google Scholar]
- Valastyan S, Weinberg RA. 2011. Tumor metastasis: molecular insights and evolving paradigms. Cell 147: 275–292. [DOI] [PMC free article] [PubMed] [Google Scholar]
- Vitak SA, Torkenczy KA, Rosenkrantz JL, Fields AJ, Christiansen L, Wong MH, Carbone L, Steemers FJ, Adey A. 2017. Sequencing thousands of single-cell genomes with combinatorial indexing. Nat Methods 14: 302–308. [DOI] [PMC free article] [PubMed] [Google Scholar]
- Wang Y, Navin NE. 2015. Advances and applications of single-cell sequencing technologies. Mol Cell 58: 598–609. [DOI] [PMC free article] [PubMed] [Google Scholar]
- Wang K, Li M, Hakonarson H. 2010. ANNOVAR: functional annotation of genetic variants from high-throughput sequencing data. Nucleic Acids Res 38: e164. [DOI] [PMC free article] [PubMed] [Google Scholar]
- Wang Y, Waters J, Leung ML, Unruh A, Roh W, Shi X, Chen K, Scheet P, Vattathil S, Liang H, et al. 2014. Clonal evolution in breast cancer revealed by single nucleus genome sequencing. Nature 512: 155–160. [DOI] [PMC free article] [PubMed] [Google Scholar]
- Wickham H. 2009. ggplot2: elegant graphics for data analysis. Springer-Verlag, New York. [Google Scholar]
- Xie T, D'Ario G, Lamb JR, Martin E, Wang K, Tejpar S, Delorenzi M, Bosman FT, Roth AD, Yan P, et al. 2012. A comprehensive characterization of genome-wide copy number aberrations in colorectal cancer reveals novel oncogenes and patterns of alterations. PLoS One 7: e42001. [DOI] [PMC free article] [PubMed] [Google Scholar]
- Xu X, Hou Y, Yin X, Bao L, Tang A, Song L, Li F, Tsang S, Wu K, Wu H, et al. 2012. Single-cell exome sequencing reveals single-nucleotide mutation characteristics of a kidney tumor. Cell 148: 886–895. [DOI] [PMC free article] [PubMed] [Google Scholar]
- Yachida S, Jones S, Bozic I, Antal T, Leary R, Fu B, Kamiyama M, Hruban RH, Eshleman JR, Nowak MA, et al. 2010. Distant metastasis occurs late during the genetic evolution of pancreatic cancer. Nature 467: 1114–1117. [DOI] [PMC free article] [PubMed] [Google Scholar]
- Yates LR, Campbell PJ. 2012. Evolution of the cancer genome. Nat Rev Genet 13: 795–806. [DOI] [PMC free article] [PubMed] [Google Scholar]
- Zahn H, Steif A, Laks E, Eirew P, VanInsberghe M, Shah SP, Aparicio S, Hansen CL. 2017. Scalable whole-genome single-cell library preparation without preamplification. Nat Methods 14: 167–173. [DOI] [PubMed] [Google Scholar]
- Zhang J, Fujimoto J, Zhang J, Wedge DC, Song X, Zhang J, Seth S, Chow CW, Cao Y, Gumbs C, et al. 2014. Intratumor heterogeneity in localized lung adenocarcinomas delineated by multiregion sequencing. Science 346: 256–259. [DOI] [PMC free article] [PubMed] [Google Scholar]
- Zong C, Lu S, Chapman AR, Xie XS. 2012. Genome-wide detection of single-nucleotide and copy-number variations of a single human cell. Science 338: 1622–1626. [DOI] [PMC free article] [PubMed] [Google Scholar]
Associated Data
This section collects any data citations, data availability statements, or supplementary materials included in this article.