

Abstract
Copy number alteration (CNA) is a major contributor to genome instability, a hallmark of cancer. Here, we studied genomic alterations in single primary tumor cells and circulating tumor cells (CTCs) from the same patient. Single-nucleotide variants (SNVs) in single cells from both samples occurred sporadically, whereas CNAs among primary tumor cells emerged accumulatively rather than abruptly, converging toward the CNA in CTCs. Focal CNAs affecting the MYC gene and the PTEN gene were observed only in a minor portion of primary tumor cells but were present in all CTCs, suggesting a strong selection toward metastasis. Single-cell structural variant (SV) analyses revealed a two-step mechanism, a complex rearrangement followed by gene amplification, for the simultaneous formation of anomalous CNAs in multiple chromosome regions. Integrative CNA analyses of 97 CTCs from 23 patients confirmed the convergence of CNAs and revealed single, concurrent, and mutually exclusive CNAs that could be the driving events in cancer metastasis.
Somatic copy number alterations (CNAs) are associated with most malignant tumors. Genomic analyses of patient tumors in The Cancer Genome Atlas (TCGA) have revealed that 1385 of 3299 tumors were dominated by extensive CNAs (Ciriello et al. 2013), suggesting an important role of genome instability in tumorigenesis. However, the temporal evolution and spatial distribution of CNAs in patient samples remain largely unknown.
Whole-chromosome or arm-level CNAs known as aneuploidies affect more than 25% of the entire genome of a typical cancer specimen (Beroukhim et al. 2010). More than a century ago, Boveri hypothesized chromosomal aneuploidy as the origin of malignant tumors (Boveri 1902); however, its roles in cell proliferation (Williams et al. 2008) and tumorigenesis (Weaver et al. 2007) remain controversial, in part because of the difficulties in recapitulating the similar large-scale (from several megabases to whole chromosome) changes that are present in typical cancer cells in vitro. Early comparative genomic hybridization analyses exhibited similar arm-level CNA patterns among disseminated tumor cells in bone marrow from patients with metastatic disease (Klein et al. 2002). Recent progress in single-cell genome sequencing has allowed quantitative characterization of both single-nucleotide variants (SNVs) and CNAs in individual tumor cells (Ni et al. 2013; Wang et al. 2014). In contrast to SNVs, which show substantial cell-to-cell heterogeneity (Hou et al. 2012; Xu et al. 2012; Zong et al. 2012; Ni et al. 2013; Francis et al. 2014; Gawad et al. 2014), single nuclei (Wang et al. 2014) from invasive ductal carcinoma of the breast or individual circulating tumor cells (CTCs) (Ni et al. 2013) from lung cancer patients have been found to exhibit genomic homogeneity in their CNA patterns. This reproducibility indicates that large-scale CNAs might arise early in the tumor development. Understanding the evolutionary process of CNAs could help to pinpoint the early onset of CNAs and identify their roles in tumorigenesis.
Focal CNAs affect particular genes, the roles of which in tumorigenesis can be validated individually. Functional characterization of six candidate genes in a recurrent CNA region (8q22) revealed the dual role of MTDH in promoting metastasis and enhancing chemoresistance (Hu et al. 2009). Unlike large-scale CNAs whose boundaries are frequently located in the centromere or telomere regions and are hard to identify, breakpoint sequences around the boundaries of focal CNA regions may be determined by next-generation sequencing. Various mechanisms have been proposed to generate focal CNAs based on breakpoint analyses of bulk sequencing data (Hastings et al. 2009; Zhang et al. 2009); however, the heterogeneity underlying complex genomic rearrangements involved in CNA formation is masked by sequencing a group of cells. Meanwhile, single-cell CNA breakpoint analyses have been utilized to determine the CNA lineage of cancer cells (Navin et al. 2011; Dago et al. 2014). The low resolution of these breakpoint analyses prevented the identification of CNA-causing genomic rearrangements occurring in individual cells. Single-cell analyses of the rearrangement junctions revealed fragmentation and reassembly of micronuclei chromatin as a possible mechanism for the formation of chromothripsis (Zhang et al. 2015). However, the mechanisms underlying the formation of focal CNAs at the single-cell level remain largely unexplored.
Cancer metastases, the dissemination and colonization of tumor cells at distant sites, led to the majority of cancer-related deaths. Comparative analyses of paired primary and metastatic tumors could reveal genomic differences between them. These differences might arise at the dissemination step, in which only rare cells that acquire certain genomic alterations with selective advantages have the potential to migrate to distant sites. Another possibility is that these differences occur at the adaptation step in which migrated cells undergo genomic changes in response to the local environment at the distant sites. However, it is difficult to distinguish genomic changes at the above two steps without analyzing cancer cells in the circulatory system. CTCs are cancer cells that successfully escape from the primary tumor site, enter the peripheral blood, and survive the circulation (Fig. 1A; Sethi and Kang 2011). Genomic analyses of CTCs are crucial for understanding the underlying mechanism of cancer metastasis (Heitzer et al. 2013; Klein 2013; Ni et al. 2013; Dago et al. 2014; Lohr et al. 2014) and could lead to the development of new methods for noninvasive cancer diagnosis and prognosis in the clinic.
Figure 1.
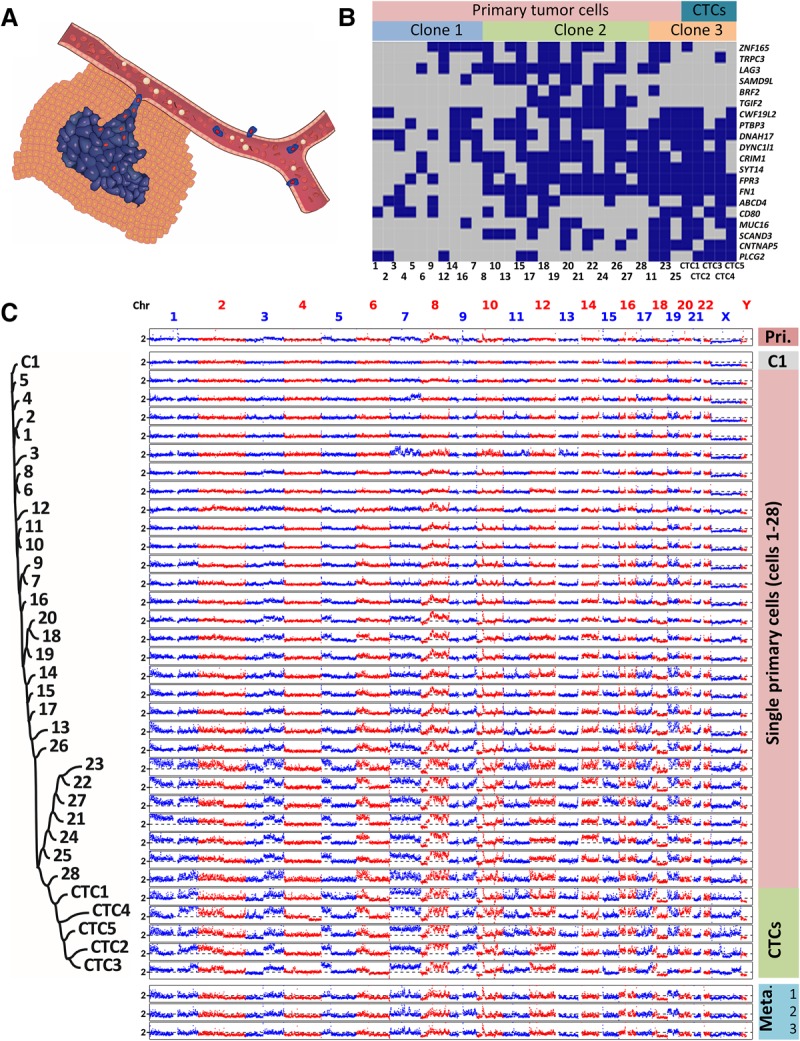
Evolution of SNVs and large-scale CNAs in primary tumor cells and CTCs. (A) Schematic diagram of the manner in which primary tumor cells intravasate and become CTCs. (B) SNV loci of primary tumor cells and CTCs. The distribution of 20 nonsynonymous mutations was assessed in 28 primary tumor cells (Cells 1–28) and five CTCs (CTCs 1–5) from a colon cancer patient (blue box, mutant; gray box, wild type). Three clones of cells were present according to a probabilistic modeling-based approach. (C) CNA patterns of the primary tumor, one control leukocyte (C1), single primary tumor cells, CTCs, and three lymph node metastases. (Pri.) Primary tumor, (Meta.) metastases. The copy numbers (blue and red dots) are plotted along the genome at a bin size of 500 kb. The ordinate coordinate represents copy numbers ranging from 0 to 6 (a copy number of >6 copies is set to 6). Phylogenetic tree on the left was constructed based on the segmented copy numbers of single cells.
Here, we performed single-cell SNV, CNA, and structural variant (SV) analyses of primary tumor cells and CTCs to infer the evolutionary process of CNAs in the routes to cancer metastases.
Results
Large-scale CNAs in primary tumor cells converge toward the CNAs in CTCs whereas SNVs accumulate sporadically
We first analyzed the distribution of SNVs among 28 primary tumor cells and five CTCs from a colon cancer patient (CO1) (Fig. 1B; Supplemental Table S1). Single-cell whole-genome amplification (WGA) (Zong et al. 2012) was used to amplify DNA in each cell. To reduce the number of false-positive SNVs inherent to whole-genome amplification of single cells, we conducted bulk exome sequencing (81.6× sequencing coverage) of the primary tumor (Supplemental Tables S2, S3). A set of high-confidence SNVs (>45× coverage with >10× coverage in the mutant allele) was selected, followed by targeted PCR and Sanger sequencing to assess their presence in each cell. Genomic loci in 20 of those SNVs were covered by PCR products from each single tumor cell, and these 20 SNVs were subjected to further analyses (Supplemental Table S4). SNVs in primary tumor cells and CTCs were heterogeneous and appeared to follow a sporadic progression model, namely, tumor cells randomly accumulated new, spontaneous SNVs during clonal expansion (Nowell 1976). A heterogeneous SNV distribution has also been observed across single cells from lung cancer patients (Ni et al. 2013), from breast cancer patients (Wang et al. 2014), and from acute lymphoblastic leukemia (ALL) patients (Gawad et al. 2014). Using a probabilistic modeling-based single-cell SNV clustering approach taking account of the effect of allele dropout (ADO) during WGA (Gawad et al. 2014), we were able to segregate the cells into three clones. CTCs, together with three primary tumor cells, comprised Clone 3. While Clones 2 and 3 appeared to have originated from Clone 1 after acquiring further mutations, SNV clones in our case as well as other solid tumors (Wang et al. 2014) were not organized in a clear hierarchy as shown in ALL (Gawad et al. 2014). This disparity could reflect diverse roles of somatic mutations in governing malignant transformation.
Next, we focused on CNA patterns. It is a general approach to analyze single-cell CNAs affecting larger than megabases of genome with low sequencing depth (Baslan et al. 2015). The WGA approach we used resulted in a reasonably uniform genome coverage with respect to GC content (Supplemental Fig. S1) and ensured the differentiation between WGA artifacts and real CNAs (Methods; Supplemental Fig. S2). CNAs in individual cells were assessed by whole-genome amplification followed by low-depth (0.1×∼2×) whole-genome sequencing (Fig. 1C). The five CTCs had highly reproducible CNA patterns, with correlation coefficients between CNAs of any two CTCs ranging from 0.79 to 0.89 (median correlation coefficient ρ = 0.86, P-value P < 10−10), which was a result consistent with our previous report (Ni et al. 2013). Interestingly, three separated metastatic lymph nodes showed a CNA pattern similar to that of the CTCs, indicating the homogeneity of multiple metastatic tissues, as defined by the CNA pattern of CTCs. Unlike the CTCs, primary tumor cells exhibited heterogeneous CNA patterns, with correlation coefficients between CNAs of any two primary tumor cells ranging from 0.09 to 0.96 (median ρ = 0.70, P < 10−10). Few primary tumor cells such as Cells 1 and 2, which likely represented cells undergoing early tumorigenesis, harbored CNAs affecting <6% of the whole genome. To confirm that those primary tumor cells bearing significantly less CNAs were not normal (healthy) cells, we analyzed SNVs in 22 normal (DAPI+, anti-CD45+, and anti-cytokeratin−) cells. Only one SNV each was identified in three of the 22 normal cells (Supplemental Fig. S3), far fewer than the four SNVs each that were detected in Cell 1 and Cell 2. The majority of the primary tumor cells had large-scale CNAs, ranging from a few megabases to a whole chromosome arm and affecting more than 35% of the genome.
This heterogeneous distribution of CNA patterns in the primary tumor indicated temporal evolution of the cancer genome. The chromosome regions in this patient were not randomly altered; several regions (e.g., gains 3q, 5p, 6p, 8q, and 9q) were more prone than other regions to CNAs. To inform the evolutionary history of individual cells, copy numbers in individual cells were segmented with DNAcopy (Supplemental Fig. S4; http://bioconductor.org/packages/DNAcopy/) and a phylogenetic tree was constructed based on the segmented copy numbers using the neighbor-joining method (Fig. 1C; Saitou and Nei 1987). This tree appears to be monophylogenetic, with a normal cell (C1) located in the root and all CTCs located in the late branch. An average of 80% of the CNAs in every single phylogenetic ancestral primary tumor cell can be observed in any single CTC. This observation indicated that CNAs in CTCs were not just in the late stage of evolution—CNAs in primary tumor cells were actually convergent toward the CNAs as seen in CTCs. Taken together, CNAs were exacerbated and accumulated consecutively in certain regions with high probability, leading to a converging pattern in CTCs and metastases.
Augmented focal CNAs occur in few primary tumor cells but converge toward the CNA in all CTCs
Because no SNVs in well-known tumor suppressor genes or oncogenes had been identified in this patient, we hypothesized that high or low copy numbers in certain regions conferred the metastatic potential of the CTCs. Indeed, in the magnified focal chromosome regions (∼Mb) shown in Figure 2, the CTCs exhibited substantial decreases (Fig. 2A) and increases (Fig. 2B) in copy numbers in regions containing the tumor suppressor gene PTEN and oncogene MYC, respectively. These changes were significantly above the background level, as shown in the normal cell C1. The loss of PTEN and gain of MYC have been well documented as inducers of metastasis in animal models (Cho et al. 2014).
Figure 2.

Evolution of focal CNAs in primary tumor cells and CTCs. (A) Visualization of aligned reads around a focal region of Chromosome 10 (Chr 10: 86,880,000–98,090,000) containing the PTEN gene. The bin size was 50 kb. The maximal ordinate coordinate values were set to reads corresponding to a copy number of 2. (B) Visualization of aligned reads around multiple focal regions of Chromosome 8 (Chr 8: 56,000,000–66,160,000; Chr 8: 123,850,000–133,210,000) containing the MYC gene. The bin size was 50 kb. The maximal ordinate coordinate values were set to reads corresponding to a copy number of 40.
We first focused on the chromosomal region (Chr 10: 86,880,000–98,090,000) containing gene PTEN, in which all CTCs exhibited a homozygous deletion (Fig. 2A). In clear contrast, the primary tumor cells exhibited various degrees of copy number reduction. The loss region was broadened gradually and converged toward the sharp deletion boundaries observed in CTCs. Interestingly, bulk sequencing of the tumors showed that all three metastatic lymph nodes (Fig. 2A, bottom panel), but not the primary tumor (Fig. 2A, top panel), displayed the same clear deletion boundaries as the CTCs in the above region. Our observations suggest that only those primary tumor cells bearing homozygous deletions in the above region had become CTCs and eventually metastasized.
We then focused on the oncogene MYC, whose genomic region was amplified together with three other regions on Chromosome 8 (Fig. 2B). These regions had around 30 copies in all CTCs, but only 2–10 copies in the primary tumor cells. Again, high copy numbers were also observed in the bulk sequencing of metastatic lymph nodes. Notably, the augmented copy number gains were relatively uniform across the four regions in the CTCs, implicating that they were amplified together.
Single-cell structural variant analyses reveal the intertwining of CNA boundaries
The high copy numbers of these four regions allowed us to overcome the noise in the signal and resolve regional boundaries at a sequencing depth of 2–7×. By analyzing split-reads (unmapped reads which can be aligned to two different genomic positions when split into two parts) and discordant read pairs (unmapped read pairs whose mates can be aligned to different genomic positions that were further apart than the expected insertion size) around the boundaries of four high-CNA regions, we identified eight chromosomal breakpoints (a–h) in every CTC and metastasis (see Methods for details). Figure 3 shows the connection between two of the four regions. Single split-reads and discordant read pairs showed that breakpoint a (Chr 8: 58828219) at the first region in all five CTCs was joined to breakpoint d (Chr 8: 61957655) at the second region with 1-bp microhomology (Fig. 3A); the sequence across this junction is shown in Figure 3B. This junction between a and d was also detected in all three metastases (Fig. 3; Supplemental Fig. S5). Further sequence analyses (Supplemental Figs. S5–S8), together with PCR validation (Methods; Supplemental Fig. S9), revealed SVs among the other breakpoints.
Figure 3.
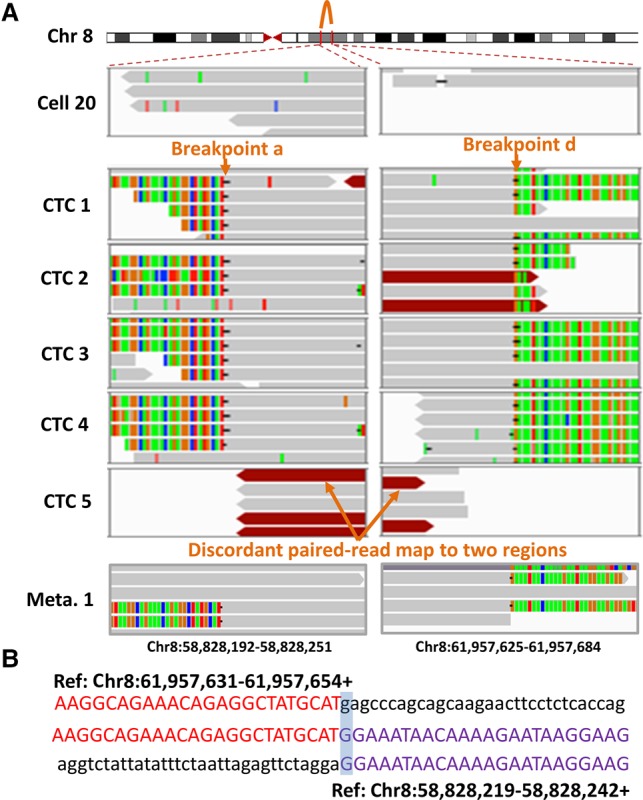
Identification of breakpoint sequences at the CNA boundaries. (A) Visualization of aligned reads around breakpoints a and d at the CNA boundaries in a primary tumor cell (Cell 20), five CTCs, and one of the lymph node metastases (Meta. 1) using an Integrative Genomics Viewer (IGV). Alignments are represented as gray, with color-coded base mismatches (A, green; T, red; G, orange; C, blue). Soft-clipped (colorful) bases around one breakpoint can be mapped to the reference genome around another joined breakpoint. Read pairs mapped to chromosome regions with much larger separations than the estimated insert size are indicated in dark red. (B) Sequences at the junction of breakpoints a and d. A representative sequence read (middle) was mapped to two regions (above and below) in the reference genome with appropriate orientation (+, forward strand).
These single-cell SV analyses allowed us to reconstruct the connections among the boundaries of the four regions (Fig. 4A); however, the underlying mechanism controlling the formation of augmented copies in these intertwined regions remained unclear. Double minute chromosomes (DMs)/homogeneously staining regions (HSRs) from extrachromosomal DNA, which resulted from chromosome shattering (Stephens et al. 2011) or a multistep evolutionary process (L'Abbate et al. 2014), were previously proposed to explain the massive amplifications in multiple regions in Chromosome 8 involving the MYC gene. However, if the amplifications originated from DMs, the copy number would vary widely from CTC to CTC because of uneven DM partitions during cell division, but we did not observe such variation. Alternatively, DMs may have been integrated into the genome as HSRs. While the lack of remaining tissue specimens precluded fluorescence in situ hybridization (FISH)-based analysis to rule out this possibility, we were unable to identify insertion sites that appeared in multiple CTCs or primary tumor cells to support DM integration. Moreover, deletion events signifying the episome model for DM/HSR formation (Carroll et al. 1988) were not detected among the boundaries of the amplified regions. Thus, our observations appeared not to favor either model. We further analyzed the distribution of SNVs and CNAs to exclude chromothripsis events as a possible mechanism for the amplifications (Zhang et al. 2015). Ultimately, CNA formation in the four regions likely involved an unknown mechanism.
Figure 4.

Structural variants and CNA formation in four regions on Chromosome 8. (A) Pictorial representation of the structural variants among the boundaries of four regions on Chromosome 8. (B) Heat map of CNA breakpoint junction distribution. The existence of four breakpoint junctions in 28 primary tumor cells, five CTCs, and three metastases from the colon cancer patient (Meta., metastases) was detected by PCR followed by next-generation sequencing. The primers were designed to target both sides of the breakpoint junction with appropriate orientation based on whole-genome sequencing. (C) A two-step model to elucidate the CNAs involving four regions on Chromosome 8 containing the MYC gene. Sequential FoSTeS events first caused the CNA regions to be duplicated, after which homologous recombination further amplified these duplicated regions to extreme copy numbers.
A two-step model for the formation of CNAs in multiple regions
To further explore the mechanism underlying CNA formation in the four regions, we examined the SVs of primary tumor cells, which were at the intermediate stage of multiregion CNA build-up, providing a snapshot of the CNA-formation process. As shown in Figure 4B, while they were observed in all CTCs, SVs among the boundaries of the four regions occurred heterogeneously from cell to cell in the primary tumor. Elevated copy numbers appeared simultaneously in the above regions only after the cells (Cells 7, 9, and 28) completed a complex rearrangement, as shown in Figure 4A. In contrast, no significant CNAs were detected in other primary cells, such as Cells 5, 10, 11, 17, and 18, which experienced some SV events but did not complete the complex pattern as shown in Figure 4A.
Thus, we proposed a two-step model to explain the multiregion copy number gains in Chromosome 8 (Fig. 4C). First, a sequential process of fork stalling and template switching (FoSTeS) (Zhang et al. 2009) formed a complex pattern before resuming the original template. Homologous recombination (HR) (Hastings et al. 2009) occurred only after the completion of these initially duplicated chromosome regions by FoSTeS, which further amplified them to extremely high copy numbers, resulting in dramatic phenotypic effects on CTCs. This model explains the relatively uniform focal gains across multiple regions in Chromosome 8 of the selected patient.
CTCs in different cancer types exhibit reproducible CNA patterns
If the aforementioned converging evolution is a general process, reproducible CNA patterns can be observed in CTCs from different patients. We conducted a survey of 97 CTCs from nine breast, seven gastric, five prostate, and two colon cancer patients (Supplemental Table S1) by whole-genome amplification and sequencing (∼0.1× sequencing depth). The median lengths of identified CNAs are between 5.5 and 14 Mb with total numbers of identified CNAs between 39 and 187. The length distribution of CNAs in a representative cell (BR3) is shown in Supplemental Figure S10. CTCs from most patients exhibited reproducible CNAs, indicating their convergence during tumor development and metastasis (Fig. 5; Supplemental Fig. S11). The inter-patient reproducibility of CNAs seemed to be cancer type-specific. In gastric cancer, we observed reproducible CNA patterns among CTCs from the same patient (Fig. 5A). Correlation analyses based on the segmented CNAs (Supplemental Fig. S12) gave a median correlation coefficient of 0.86 (P < 10−10) among these CTCs. The CNA patterns even persisted across CTCs from different patients (Fig. 5B), similar to lung ADC (Ni et al. 2013). The median correlation coefficient among CTCs from different gastric cancer patients was 0.40 (P < 10−10). For breast cancer, again, CTCs from the same patient exhibited reproducible CNA patterns (median ρ = 0.86, P < 10−10) (Fig. 5C), but CNA patterns of CTCs across different breast patients were distinctive (Fig. 5D). Two patients (BR8 and BR9) with a histological diagnosis of ductal carcinoma in situ (DCIS) showed much fewer CNAs as compared to other patients with a diagnosis of invasive ductal carcinoma. The correlation coefficient (ρ = 0.36) between CTCs from patients BR2 and BR7 was significantly (P < 10−10) below the mean (ρ = 0.42) of correlation coefficient distribution based on permutation analysis (see Methods), which indicated CNAs in CTCs from these two patients were anti-correlated. Breast cancer had been well recognized as a multi-subtype disease at both the transcriptome- and genome-level (Sorlie et al. 2001; Curtis et al. 2012). The observed discrepancies among different patients could reflect the breast cancer subtype diversity. Therefore, single-cell sequencing of CTCs could be used for clinical classification of breast cancer patients.
Figure 5.

CNAs in CTCs from individual patients and from different patients with the same type of cancer. (A) CNAs in five CTCs from a gastric cancer patient. (B) CNAs in CTCs from different gastric patients (one CTC was used for each patient). (C) CNAs in 15 CTCs from a breast cancer patient. (D) CNAs in CTCs from different breast cancer patients (one CTC was used for each patient). The bin size is 500 kb. The ordinate coordinate represents copy numbers ranging from 0 to 6 (a copy number of >6 copies is set to 6).
Integrative analyses uncover novel single, concurrent, and mutually exclusive CNAs
Oncogenic events such as MYC amplification and PTEN deletion in the colon cancer patient were difficult to detect via bulk sequencing of primary tumors, which rendered CTCs an ideal population to identify driving events in metastasis and also necessitated the use of single-cell sequencing. We analyzed CNAs at the single-gene level across CTCs from all 23 patients. One CTC from each patient was sequenced at a depth of 1–2×. We searched for recurrent gains or losses (more than 10 copies or homozygous losses) that appeared in at least two patients, resulting in the identification of a set of 11 genes (Fig. 6A). The copy number of the ERBB2 gene is directly associated with pathological assessment of HER2 expression at the protein level. Six of 11 identified genes were well-known oncogenes (ERBB2, MET, MYC, and AR) or tumor suppressor genes (PTEN and STK11). The identification of these genes in the present study illustrated the capability of CTC sequencing as a method to detect important, clinically relevant chromosome alterations at the single-gene level. The other five genes identified in our study, ZMAT4, RLN2, ANO1, ARHGEF7, and C90orf53, are potential therapeutic targets that merit further investigation.
Figure 6.

Integrative analyses of the CNA patterns of CTCs from patients with different types of cancer. (A) Eleven genes with recurrent CNAs (red, gains; blue, losses) across breast, gastric, prostate, and colon cancer. HER2 (ERBB2) protein levels were assessed by immunohistochemical staining. As a control (neutral), the copy numbers of a few well-known oncogenes and tumor suppressor genes were also assessed. (B) Correlation analyses of significant gain or loss regions in patients with breast, gastric, prostate, and colon cancer. The red and blue bars in the inner circle denote significant gains and losses, respectively. The red and blue lines across the circle represent concurrent and mutually exclusive CNAs, respectively.
As shown in Figure 4A, the connections between the boundaries of multiple CNA regions by SVs indicated that genomic aberration was rarely a single event. We performed single-cell correlation analyses of significant gains (red bars in the inner circle of Fig. 6B) and losses (blue bars in the inner circle of Fig. 6B) (see Methods) across single representative CTCs from patients of all four cancer types in this study, resulting in the identification of sets of concurrent (red lines in Fig. 6B) and mutually exclusive (blue lines in Fig. 6B) CNA events. Well-known oncogenes or tumor suppressor genes (Hanahan and Weinberg 2011; Garraway and Lander 2013) in highly correlated regions are listed in Figure 6B and Supplemental Table S5. Concurrent CNA events may synergistically promote tumorigenesis and impose challenges for treatment with a single targeted drug. In contrast, mutually exclusive events likely involve genes in the same signaling pathway. Correlation analyses at the single-cell level provide a new avenue for identifying related oncogenic events and could guide the clinical practice of combinatorial treatments that target multiple genomic alterations.
Discussion
It was long debated whether tumorigenesis was driven by abrupt genomic events or continuous genomic changes (Rubin 1994). While classically SNVs were believed to undergo gradual accumulation and clonal expansion, this type of alteration usually involved mutations in different specific genomic loci, making it difficult to determine whether they are generated by discrete or continuous events based on tumor samples collected at limited time-points. Our results from 28 primary tumor cells suggested that accumulation of SNVs followed a sporadic model, while there was still evidence of clonal expansion. Recent observations suggested that chromothripsis causing massive genomic rearrangements could be generated from single catastrophic events (Stephens et al. 2011; Baca et al. 2013), one of which, micronucleus formation and reassembly, was recently captured by live cell imaging and single-cell sequencing (Zhang et al. 2015). While chromothripsis can generate massive chromosomal rearrangements facilitating rapid genome evolution, it occurs sporadically and cannot lead to alterations in recurrent chromosomal regions. Early studies of genomic alterations in tumors obtained at different disease stages implicated a gradual acquisition of CNAs (Fearon and Vogelstein 1990). In another recent study, clustering analyses of CNA profiles of individual cells in a tumor revealed punctuated steps during early tumorigenesis leading to consistent CNAs in late-stage tumors (Navin et al. 2011). Our observations indicate that the evolutionary process of CNAs is not random but is a convergent evolution resulting in the consistent CNAs in CTCs. This process was especially evidenced by the gradually broadening of the loss regions containing PTEN. Concordant copy number gains were observed in multiple regions including the MYC-containing region. Although a single abrupt event appeared to create these CNAs all at once, our single-cell structural variant analyses showed a convergent process; SVs necessary to generate these CNAs occur repeatedly around their boundaries—most cells attempted at different paths, but only a few cells succeeded in obtaining all the SVs. The observation of intermediary stages favors the idea that the CNAs in our case were converged in a gradual manner, even though we cannot completely rule out that these intermediary stages were obtained rapidly and maintained stably afterward.
Integrative CNA analyses of CTCs from 23 patients confirmed the convergence of CNA patterns across cancer types. The convergence of CNAs in CTCs and metastatic tumors suggested a deterministic mechanism of CNA evolution. Genomic alterations leading to cancer metastasis have been posited to be either direct consequences of primary tumor progression or as accidental acquisitions of advantageous alterations (Chaffer and Weinberg 2011). Our observations strongly favored the former mechanism of CNA evolution, although the latter may also occur in other cases. Specific CNA patterns in certain cancer types have been observed previously in both cytogenetic and next-generation sequencing analyses (Heim and Mitelman 1986, 2009; Ni et al. 2013), which constitute another indicator of nonrandom evolution. Specifically, a large cohort study across cancer types found that significant focal CNAs in one cancer type might also be identified in several other cancer types (Beroukhim et al. 2010). These findings imply that a few underlying mechanisms that remain poorly understood cooperatively drive CNA formation and evolution in tumorigenesis and metastasis. Heterogeneous CNAs were found among primary tumor cells in our results. Although this kind of heterogeneity was widely considered as a consequence of genomic diversity (which is necessary for clonal selection), our analyses of CNAs and SVs at the single-cell level revealed these heterogeneous CNAs as different intermediary stages in multiple convergent paths to a common pattern. Our study provided evidence for convergent CNA evolution, which was in contrast to, not mutually exclusive with, divergent evolution followed by positive selection of advantageous clones for driving tumorigenesis (Heim et al. 1988).
Single-cell sequencing of individual cancer cells provides a new avenue for studying the underlying mechanisms for phenomena such as chromothripsis (Zhang et al. 2015), which are otherwise hidden in bulk sequencing of an ensemble of cells. Our single-cell SV analyses revealed the process of CNA formation with unprecedented detail, and more importantly, they will also have a practical impact in the clinic. We showed that cancer metastasis is not a random seeding of primary tumor cells; instead, convergent selection, rather than stochastic force, drives primary tumor cells with no perceptible CNA to become CTCs with complex genomic rearrangements. CTCs closely resemble metastatic tumors and contain the highest levels of genome instability in regions that confer a selective metastatic advantage. Quantitative FISH-based testing that relied on probes on a few recurrent CNA loci was able to efficiently detect circulating genetically abnormal cells in non-small cell lung cancer (NSCLC) ranging from stage I through stage IV (Katz et al. 2010). The high sensitivity and specificity of such testing for patients with early-stage cancer again indicated that CNAs are an early event in tumorigenesis and thus rationalized their diagnostic use. In addition, CNAs could serve as prognostic markers for treatment stratification because they remain consistent during treatment (Klein et al. 2002; Ni et al. 2013). Whereas CNA detection was frequently confounded by low tumor cellularity in approaches using cell-free DNA (cfDNA) or tissue, CNAs can be detected in a single CTC with high sensitivity by single-cell sequencing. By interrogating the CTC CNA patterns from 23 patients, we were able to identify 11 focal regions that are frequently amplified or deleted, including well-known oncogenes or tumor suppressor genes. In addition, an integrative analysis revealed highly correlated genomic alteration events, which can only be precisely detected at the single-cell level.
Methods
Patient recruitment and tumor samples
A total of 23 patients with four types of cancer (colon, breast, gastric, and prostate) were recruited for this study. The frozen primary tumor and three FFPE metastatic lymph node samples from the colon cancer patient were obtained from the Tianjin Cancer Hospital tissue bank. This study was approved by the Institutional Ethics Committee at Tianjin Cancer Hospital and Institute, as well as the Committee on the Use of Human Subjects in Research at Harvard University. All participants provided written informed consent.
Isolation of CTCs and primary tumor cell nuclei
CTCs from 7.5 mL of blood from each patient were first captured with the CELLSEARCH Circulating Tumor Cell Kit (Epithelial) (Veridex, LLC) using magnetic beads conjugated to anti-EpCAM (Epithelial Cell Adhesion Molecule) antibodies. The captured CTCs were stained with 4′, 6-diamidino-2-phenylindole (DAPI), anti-cytokeratin-phycoerythrin and anti-CD45-allophycocyanin antibodies. Individual CTCs (DAPI+, anti-cytokeratin+, anti-CD45−) and leukocytes (DAPI+, anti-cytokeratin−, anti-CD45+) were then manually isolated under a fluorescence microscope through micro-pipetting. The nuclei of primary tumor cells from the freshly frozen tumor from the colon cancer patient were disaggregated into a suspension using a previously described method (Wang et al. 2014), followed by manual micro-pipetting.
Whole-genome amplification
DNA from each single CTC or nucleus was amplified as described previously (Zong et al. 2012). To reduce contamination during the WGA procedure, we performed all WGA experiments in a Class 100,000 clean room. All reagents except for nucleotides and polymerases were subjected to UV irradiation. Quantitative PCR (qPCR) was performed on eight randomly selected loci to assess the genomic integrity of the amplification products. Cells in which at least seven of eight loci were amplified at cycle threshold (Ct) numbers of 23–26 were subjected to further sequencing studies.
Whole-genome library preparation and sequencing
Libraries for whole-genome sequencing were prepared using the NEBNext DNA Library Prep Master Mix Set for Illumina (New England BioLabs) following the manufacturer's protocol. The library was quality checked and sequenced on an Illumina HiSeq X Ten system (read lengths of 2 × 150 bp) or an Illumina HiSeq 2500 system (read lengths of 2 × 100 bp).
Extraction of genomic DNA from blood and tumor samples
Genomic DNA was extracted from the blood of the colon cancer patient using the Blood & Cell Culture DNA Mini Kit (Qiagen). Genomic DNA was extracted from the frozen primary tumor and three FFPE metastatic lymph node samples using the QIAamp DNA Micro Kit (Qiagen) and the QIAamp DNA FFPE Tissue Kit (Qiagen), respectively.
Exome library preparation and sequencing
The coding exons plus UTRs were captured with SureSelect All Exon v4 (Agilent Technologies) as described previously (Rohland and Reich 2012), with a few modifications. The DNA was sheared into fragments of ∼175 bp using the Covaris system (Covaris). The sheared DNA was purified with Agencourt AMPure XP SPRI beads (Beckman Coulter). The DNA was blunted with 5′-phosphorylated ends using the NEB Quick Blunting Kit and ligated to truncated PE P5 adaptors and barcoded P7 adaptors using the NEBNext Quick Ligation Module. After clean-up with Agencourt AMPure XP SPRI beads and nick fill-in with the Bst DNA polymerase, Large Fragment (New England BioLabs), the DNA fragments with adaptors were enriched by PCR. A total of 500 ng of DNA pooled from four barcoded libraries were used for hybridization and post-hybridization amplification following the manufacturer's protocol (SureSelectXT Target Enrichment System for Illumina Paired-End Sequencing Library, Version 1.3.1, Agilent Technologies). The post-hybridization amplification product was quality checked and sequenced on an Illumina HiSeq 2500 (read lengths of 2 × 100 bp).
Exome sequencing data analysis for SNVs/indels
Sequencing reads were aligned to the UCSC human reference genome (hg19, http://hgdownload.cse.ucsc.edu/goldenPath/hg19/bigZips/) using the Burrows–Wheeler Aligner (BWA) (Li and Durbin 2009). The aligned reads were sorted and merged with SAMtools 0.1.18 (Li et al. 2009). Indel realignment was performed with the Genome Analysis Toolkit (GATK 2.1-8) (McKenna et al. 2010), and mate pair fix and duplicate removal were conducted with Picard tools 1.76 (http://Picard.Sourceforge.net). Base quality was recalibrated and population variants were detected by GATK using dbSNP build 135 (http://www.ncbi.nlm.nih.gov/projects/SNP/). The functional effects of variants were annotated with SnpEff 3.0 (Cingolani et al. 2012). Variations that were present in dbSNP build 135 and the National Heart, Lung, and Blood Institute (NHLBI) Exome Sequencing Project (ESP), but not in COSMIC v61 (Forbes et al. 2011), were filtered out.
Verification of SNVs in primary tumor cells and CTCs
A set of 20 nonsynonymous mutations identified by exome sequencing of the primary tumor and paired blood with high-confidence calls was used for SNV analyses. The existence of these SNVs in the primary tumor cells and CTCs from the colon cancer patient was identified by targeted PCR and Sanger sequencing. An allele dropout rate of 8%–46% in individual cells was estimated based on a probabilistic approach (Gawad et al. 2014). The primer sequences used for SNV verification are listed in Supplemental Table S4.
Copy number determination and segmentation from whole-genome sequencing data
The GC percentage of our mapped single-cell sequence data is around 41.5%. To reduce WGS biases caused by different GC contents in the genome as well as other systematic WGA biases, the sequence depths were normalized by sequence depths from several normal white blood cells (WBC) (cytokeratin−/CD45+). The CNA regions were identified as described previously (Zong et al. 2012; Ni et al. 2013). Briefly, the likely diploid regions were determined using the hidden Markov model (HMM). The identified diploid regions were then used to provide a normalization factor for determining copy number. Similar copy numbers in adjacent chromosome regions were merged using a circular binary segmentation (CBS) algorithm implemented in the DNAcopy package (http://bioconductor.org/packages/DNAcopy/). In Supplemental Figure S2, copy numbers in a representative WBC, primary tumor cell, and CTC were determined with GC correction and WBC normalization, respectively.
Phylogenetic analyses
We constructed a phylogenetic tree of single tumor cells from patient CO1 to infer their evolutionary history using the neighbor-joining method (Saitou and Nei 1987). Copy numbers in the genome of individual tumor cells were determined and segmented as described above. Euclidean distances between each pair of cells were calculated based on the segmented copy numbers. Then, the phylogenetic tree was built using the neighbor-joining method implemented in MEGA7 software (Saitou and Nei 1987; Kumar et al. 2016).
Identification of chromosomal breakpoints
Somatic SVs in primary colon tumor, individual primary tumor cells and CTCs, and lymph node metastases were identified using the Meerkat package (http://compbio.med.harvard.edu/Meerkat/). The precise breakpoints around the boundaries of four copy-number-gain regions on Chromosome 8 were determined according to the Meerkat prediction, as well as via visual inspection of the raw data around the CNA regions using IGV. All reads within 150 bp of the identified breakpoints were visually checked in IGV. Both mates of all discordant read pairs around the breakpoints were identified in IGV. Mismatched reads crossing the breakpoint were manually soft-clipped and realigned to the genome. In both paired read and split-read alignment, we only consider reads that uniquely mapped to the genome. We obtained eight high-confidence breakpoint calls around the boundaries of four CNA regions. No discordant reads or split-reads that supported the above breakpoints were identified in blood gDNA or individual leukocytes.
Validation of chromosomal breakpoints
The existence of the eight identified breakpoints in all primary tumor cells, CTCs, and lymph node metastases was examined by PCR followed by next-generation sequencing. Primer pairs spanning the breakpoints were designed according to the rearranged genome sequences: breakpoint d-a junction, 5′-CCTATGGGAGTGGTCCTAAA-3′ and 5′-GGGTTTCTTGGATCTGAAGATTA-3′; breakpoint b-e junction, 5′-TGGTAGAATAAAGCTGCCATTT-3′ and 5′-AAGGAGCAGGAGAGAATTAGG-3′; breakpoint g-c junction, 5′-TTGATGGTTGATTATTGACAGTGAG-3′ and 5′-ACATTCCAAGTCTTCTCTTCCA-3′; breakpoint f-h junction, 5′-GTGGCCAGTGTGATATTTAAACC-3′ and 5′-GGGACTTTGCAGATGCTAGTAA-3′. PCR products from each sample were pooled together. The library was constructed from the pooled PCR products using the NEBNext DNA Library Prep Master Mix Set for Illumina (New England BioLabs) following the manufacturer's protocol. After a quality check, these libraries were sequenced using Illumina MiSeq (read lengths of 2 × 150 bp). Cells with less than 10% of their sequence reads mapping to the reference genome and without apparent CNAs at the four Chromosome 8 regions were considered to be cells without genomic breaks at the CNA boundaries. The average (l) and standard deviation (σl) of the number of reads around each breakpoint were calculated based on these cells. Breakpoint read counts below l + 6σl were considered to have no genomic breakage with PCR validation.
Significance analyses of gain and loss regions in CTCs from different patients
Significance analyses of gain and loss regions in CTCs from nine patients with breast cancer, seven patients with gastric cancer, five patients with prostate cancer, and two patients with colon cancer were performed following the GISTIC algorithm (Beroukhim et al. 2007). One CTC was chosen for GISTIC analyses from each patient. Reads in individual cytobands were binned. The copy numbers (CN) in the binned regions were determined as described above and used to calculate P-values for gain and loss regions. All bins that had CN < 2 were reassigned as 2 for gain region P-value calculation, whereas all bins that had CN > 2 were reassigned as 2 for loss region P-value calculation. A value of 0.8 was set for CN = 0. Then, copy numbers were replaced with amplitude (a = log2CN-log22). In each data set, we obtained a G-score for every bin in the chromosome by considering both amplitude and frequency across all 23 CTCs (G = a × freq.). A null distribution for the G score was determined by permuting the data within each CTC. By comparison with the null distribution, we obtained a P-value for each bin in the chromosome. After false-discovery-rate P-value adjustment, a q-value was assigned to each bin. A significance level of 10−4.76 for gains and 10−4.18 for losses was given according to the q-values for gains and losses in four normal leukocytes; no gain or loss regions were observed in the normal leukocytes based on those significant levels.
Correlation analyses
Correlation analyses of CNAs were performed between individual cells or cytoband loci. To calculate correlation of CNAs between any two cells Cm and Cn, we first determined the segmented CNAs (Cm1, Cm2, Cm3…; Cn1, Cn2, Cn3…) in both cells at a bin size of 500 kb as described above.
The correlation coefficient between cells Cm and Cn was calculated as follows:
where i, j, and k were the indexes for different bins.
To evaluate the statistical significance of the correlation, a null distribution for the correlation coefficient ρmn was determined by permuting the copy numbers at different bins in cells Cm and Cn. A P-value for the correlation coefficient ρmn was obtained by comparison with the null distribution.
To calculate correlation of CNAs between cytoband loci, we first determined the copy number sequence (C11, C12, C13,…; C21, C22, C23,…;…) at cytoband loci for each CTC (C1; C2; …). The correlation coefficient between cytoband loci i and j was calculated as follows:
where Cn, Cm, and Ck represent individual CTCs, whereas i and j were the indexes for the cytoband loci.
A null distribution for the correlation coefficient ρij was determined by permuting the copy numbers at cytoband loci i and j. A P-value for the correlation coefficient ρij was obtained by comparison with the null distribution. Significantly correlated (P < 10−6.4) or anti-correlated (P < 10−3.7) cytoband loci are listed in Supplemental Table S5.
Data access
The raw sequence data from this study have been submitted to the NCBI Sequence Read Archive (SRA; https://www.ncbi.nlm.nih.gov/sra) under accession number SRP068920. The Sanger sequencing traces for SNV validation have been submitted to the NCBI Trace Archive (https://www.ncbi.nlm.nih.gov/Traces) under TI numbers 2344112753–2344113412.
Competing interest statement
X.S.X. is cofounder and shareholder of Yikon Genomics.
Supplementary Material
Acknowledgments
We thank all patients for their participation in this study. We thank Cheng-Zhong Zhang at Broad Institute, Asaf Tal at Harvard University, and Liya Xu and Hao Ge at BIOPIC for useful discussions. We thank Yun Zhang and Wenping Ma at BIOPIC for assistance with sequencing. This research was supported by the National High Technology Research and Development Program of China (863 Program, 2015AA020403 to F.B., X.S.X., and N.Z.), the National Basic Research Program of China (973 program, 2011CB933100 to N.Z.), the National Science Fund for Distinguished Young Scholars (81125019 to N.Z.), the National Key Research and Development Program (2016YFC0900100), the Beijing Municipal Science and Technology Commission (Z141100000214013), and the Recruitment Program of Global Youth Experts (to F.B.).
Author contributions: N.Z., X.S.X., F.B., Y.G., and X.N. designed the project. Y.G. and X.N. performed sequencing experiments. Z.S. and X.N. performed sequencing data analysis. H.G., Y.B., Z.T., Z.G., X.Y., J.Y., and Z.Y. identified and recruited patients, obtained patient consent, provided clinical information, and collected and processed the clinical samples. X.C. and L.G. performed validation experiments. All authors were involved in writing and editing the paper. N.Z., X.S.X., and F.B. supervised all aspects of this work.
Footnotes
[Supplemental material is available for this article.]
Article published online before print. Article, supplemental material, and publication date are at http://www.genome.org/cgi/doi/10.1101/gr.216788.116.
References
- Baca SC, Prandi D, Lawrence MS, Mosquera JM, Romanel A, Drier Y, Park K, Kitabayashi N, MacDonald TY, Ghandi M, et al. 2013. Punctuated evolution of prostate cancer genomes. Cell 153: 666–677. [DOI] [PMC free article] [PubMed] [Google Scholar]
- Baslan T, Kendall J, Ward B, Cox H, Leotta A, Rodgers L, Riggs M, D'Italia S, Sun G, Yong M, et al. 2015. Optimizing sparse sequencing of single cells for highly multiplex copy number profiling. Genome Res 25: 714–724. [DOI] [PMC free article] [PubMed] [Google Scholar]
- Beroukhim R, Getz G, Nghiemphu L, Barretina J, Hsueh T, Linhart D, Vivanco I, Lee JC, Huang JH, Alexander S, et al. 2007. Assessing the significance of chromosomal aberrations in cancer: methodology and application to glioma. Proc Natl Acad Sci 104: 20007–20012. [DOI] [PMC free article] [PubMed] [Google Scholar]
- Beroukhim R, Mermel CH, Porter D, Wei G, Raychaudhuri S, Donovan J, Barretina J, Boehm JS, Dobson J, Urashima M, et al. 2010. The landscape of somatic copy-number alteration across human cancers. Nature 463: 899–905. [DOI] [PMC free article] [PubMed] [Google Scholar]
- Boveri T. 1902. Ueber mehrpolige mitosen als mittel zur analyse des zellkerns. Verh Phys-Med Gesellsch Wurzburg 35: 67–90. [Google Scholar]
- Carroll SM, DeRose ML, Gaudray P, Moore CM, Needham-Vandevanter DR, Von Hoff DD, Wahl GM. 1988. Double minute chromosomes can be produced from precursors derived from a chromosomal deletion. Mol Cell Biol 8: 1525–1533. [DOI] [PMC free article] [PubMed] [Google Scholar]
- Chaffer CL, Weinberg RA. 2011. A perspective on cancer cell metastasis. Science 331: 1559–1564. [DOI] [PubMed] [Google Scholar]
- Cho H, Herzka T, Zheng W, Qi J, Wilkinson JE, Bradner JE, Robinson BD, Castillo-Martin M, Cordon-Cardo C, Trotman LC. 2014. RapidCaP, a novel GEM model for metastatic prostate cancer analysis and therapy, reveals myc as a driver of Pten-mutant metastasis. Cancer Discov 4: 318–333. [DOI] [PMC free article] [PubMed] [Google Scholar]
- Cingolani P, Platts A, Wang le L, Coon M, Nguyen T, Wang L, Land SJ, Lu X, Ruden DM. 2012. A program for annotating and predicting the effects of single nucleotide polymorphisms, SnpEff: SNPs in the genome of Drosophila melanogaster strain w1118; iso-2; iso-3. Fly (Austin) 6: 80–92. [DOI] [PMC free article] [PubMed] [Google Scholar]
- Ciriello G, Miller ML, Aksoy BA, Senbabaoglu Y, Schultz N, Sander C. 2013. Emerging landscape of oncogenic signatures across human cancers. Nat Genet 45: 1127–1133. [DOI] [PMC free article] [PubMed] [Google Scholar]
- Curtis C, Shah SP, Chin SF, Turashvili G, Rueda OM, Dunning MJ, Speed D, Lynch AG, Samarajiwa S, Yuan Y, et al. 2012. The genomic and transcriptomic architecture of 2,000 breast tumours reveals novel subgroups. Nature 486: 346–352. [DOI] [PMC free article] [PubMed] [Google Scholar]
- Dago AE, Stepansky A, Carlsson A, Luttgen M, Kendall J, Baslan T, Kolatkar A, Wigler M, Bethel K, Gross ME, et al. 2014. Rapid phenotypic and genomic change in response to therapeutic pressure in prostate cancer inferred by high content analysis of single circulating tumor cells. PLoS One 9: e101777. [DOI] [PMC free article] [PubMed] [Google Scholar]
- Fearon ER, Vogelstein B. 1990. A genetic model for colorectal tumorigenesis. Cell 61: 759–767. [DOI] [PubMed] [Google Scholar]
- Forbes SA, Bindal N, Bamford S, Cole C, Kok CY, Beare D, Jia M, Shepherd R, Leung K, Menzies A, et al. 2011. COSMIC: mining complete cancer genomes in the Catalogue of Somatic Mutations in Cancer. Nucleic Acids Res 39: D945–D950. [DOI] [PMC free article] [PubMed] [Google Scholar]
- Francis JM, Zhang CZ, Maire CL, Jung J, Manzo VE, Adalsteinsson VA, Homer H, Haidar S, Blumenstiel B, Pedamallu CS, et al. 2014. EGFR variant heterogeneity in glioblastoma resolved through single-nucleus sequencing. Cancer Discov 4: 956–971. [DOI] [PMC free article] [PubMed] [Google Scholar]
- Garraway LA, Lander ES. 2013. Lessons from the cancer genome. Cell 153: 17–37. [DOI] [PubMed] [Google Scholar]
- Gawad C, Koh W, Quake SR. 2014. Dissecting the clonal origins of childhood acute lymphoblastic leukemia by single-cell genomics. Proc Natl Acad Sci 111: 17947–17952. [DOI] [PMC free article] [PubMed] [Google Scholar]
- Hanahan D, Weinberg RA. 2011. Hallmarks of cancer: the next generation. Cell 144: 646–674. [DOI] [PubMed] [Google Scholar]
- Hastings PJ, Lupski JR, Rosenberg SM, Ira G. 2009. Mechanisms of change in gene copy number. Nat Rev Genet 10: 551–564. [DOI] [PMC free article] [PubMed] [Google Scholar]
- Heim S, Mitelman F. 1986. Secondary chromosome aberrations in the acute leukemias. Cancer Genet Cytogenet 22: 331–338. [DOI] [PubMed] [Google Scholar]
- Heim S, Mitelman F. 2009. Nonrandom chromosome abnormalities in cancer: an overview. In Cancer cytogenetics, 3rd ed. (ed. Heim S, Mitelman F), pp. 25–43. Wiley-Blackwell, Hoboken, NJ. [Google Scholar]
- Heim S, Mandahl N, Mitelman F. 1988. Genetic convergence and divergence in tumor progression. Cancer Res 48: 5911–5916. [PubMed] [Google Scholar]
- Heitzer E, Auer M, Gasch C, Pichler M, Ulz P, Hoffmann EM, Lax S, Waldispuehl-Geigl J, Mauermann O, Lackner C, et al. 2013. Complex tumor genomes inferred from single circulating tumor cells by array-CGH and next-generation sequencing. Cancer Res 73: 2965–2975. [DOI] [PubMed] [Google Scholar]
- Hou Y, Song L, Zhu P, Zhang B, Tao Y, Xu X, Li F, Wu K, Liang J, Shao D, et al. 2012. Single-cell exome sequencing and monoclonal evolution of a JAK2-negative myeloproliferative neoplasm. Cell 148: 873–885. [DOI] [PubMed] [Google Scholar]
- Hu G, Chong RA, Yang Q, Wei Y, Blanco MA, Li F, Reiss M, Au JL, Haffty BG, Kang Y. 2009. MTDH activation by 8q22 genomic gain promotes chemoresistance and metastasis of poor-prognosis breast cancer. Cancer Cell 15: 9–20. [DOI] [PMC free article] [PubMed] [Google Scholar]
- Katz RL, He W, Khanna A, Fernandez RL, Zaidi TM, Krebs M, Caraway NP, Zhang HZ, Jiang F, Spitz MR, et al. 2010. Genetically abnormal circulating cells in lung cancer patients: an antigen-independent fluorescence in situ hybridization-based case-control study. Clin Cancer Res 16: 3976–3987. [DOI] [PMC free article] [PubMed] [Google Scholar]
- Klein CA. 2013. Selection and adaptation during metastatic cancer progression. Nature 501: 365–372. [DOI] [PubMed] [Google Scholar]
- Klein CA, Blankenstein TJ, Schmidt-Kittler O, Petronio M, Polzer B, Stoecklein NH, Riethmuller G. 2002. Genetic heterogeneity of single disseminated tumour cells in minimal residual cancer. Lancet 360: 683–689. [DOI] [PubMed] [Google Scholar]
- Kumar S, Stecher G, Tamura K. 2016. MEGA7: Molecular Evolutionary Genetics Analysis Version 7.0 for bigger datasets. Mol Biol Evol 33: 1870–1874. [DOI] [PMC free article] [PubMed] [Google Scholar]
- L'Abbate A, Macchia G, D'Addabbo P, Lonoce A, Tolomeo D, Trombetta D, Kok K, Bartenhagen C, Whelan CW, Palumbo O, et al. 2014. Genomic organization and evolution of double minutes/homogeneously staining regions with MYC amplification in human cancer. Nucleic Acids Res 42: 9131–9145. [DOI] [PMC free article] [PubMed] [Google Scholar]
- Li H, Durbin R. 2009. Fast and accurate short read alignment with Burrows–Wheeler transform. Bioinformatics 25: 1754–1760. [DOI] [PMC free article] [PubMed] [Google Scholar]
- Li H, Handsaker B, Wysoker A, Fennell T, Ruan J, Homer N, Marth G, Abecasis G, Durbin R; 1000 Genome Project Data Processing Subgroup. 2009. The Sequence Alignment/Map format and SAMtools. Bioinformatics 25: 2078–2079. [DOI] [PMC free article] [PubMed] [Google Scholar]
- Lohr JG, Adalsteinsson VA, Cibulskis K, Choudhury AD, Rosenberg M, Cruz-Gordillo P, Francis JM, Zhang CZ, Shalek AK, Satija R, et al. 2014. Whole-exome sequencing of circulating tumor cells provides a window into metastatic prostate cancer. Nat Biotechnol 32: 479–484. [DOI] [PMC free article] [PubMed] [Google Scholar]
- McKenna A, Hanna M, Banks E, Sivachenko A, Cibulskis K, Kernytsky A, Garimella K, Altshuler D, Gabriel S, Daly M, et al. 2010. The Genome Analysis Toolkit: a MapReduce framework for analyzing next-generation DNA sequencing data. Genome Res 20: 1297–1303. [DOI] [PMC free article] [PubMed] [Google Scholar]
- Navin N, Kendall J, Troge J, Andrews P, Rodgers L, McIndoo J, Cook K, Stepansky A, Levy D, Esposito D, et al. 2011. Tumour evolution inferred by single-cell sequencing. Nature 472: 90–94. [DOI] [PMC free article] [PubMed] [Google Scholar]
- Ni X, Zhuo M, Su Z, Duan J, Gao Y, Wang Z, Zong C, Bai H, Chapman AR, Zhao J, et al. 2013. Reproducible copy number variation patterns among single circulating tumor cells of lung cancer patients. Proc Natl Acad Sci 110: 21083–21088. [DOI] [PMC free article] [PubMed] [Google Scholar]
- Nowell PC. 1976. The clonal evolution of tumor cell populations. Science 194: 23–28. [DOI] [PubMed] [Google Scholar]
- Rohland N, Reich D. 2012. Cost-effective, high-throughput DNA sequencing libraries for multiplexed target capture. Genome Res 22: 939–946. [DOI] [PMC free article] [PubMed] [Google Scholar]
- Rubin H. 1994. Experimental control of neoplastic progression in cell populations: Foulds’ rules revisited. Proc Natl Acad Sci 91: 6619–6623. [DOI] [PMC free article] [PubMed] [Google Scholar]
- Saitou N, Nei M. 1987. The neighbor-joining method: a new method for reconstructing phylogenetic trees. Mol Biol Evol 4: 406–425. [DOI] [PubMed] [Google Scholar]
- Sethi N, Kang Y. 2011. Unravelling the complexity of metastasis - molecular understanding and targeted therapies. Nat Rev Cancer 11: 735–748. [DOI] [PMC free article] [PubMed] [Google Scholar]
- Sorlie T, Perou CM, Tibshirani R, Aas T, Geisler S, Johnsen H, Hastie T, Eisen MB, van de Rijn M, Jeffrey SS, et al. 2001. Gene expression patterns of breast carcinomas distinguish tumor subclasses with clinical implications. Proc Natl Acad Sci 98: 10869–10874. [DOI] [PMC free article] [PubMed] [Google Scholar]
- Stephens PJ, Greenman CD, Fu B, Yang F, Bignell GR, Mudie LJ, Pleasance ED, Lau KW, Beare D, Stebbings LA, et al. 2011. Massive genomic rearrangement acquired in a single catastrophic event during cancer development. Cell 144: 27–40. [DOI] [PMC free article] [PubMed] [Google Scholar]
- Wang Y, Waters J, Leung ML, Unruh A, Roh W, Shi X, Chen K, Scheet P, Vattathil S, Liang H, et al. 2014. Clonal evolution in breast cancer revealed by single nucleus genome sequencing. Nature 512: 155–160. [DOI] [PMC free article] [PubMed] [Google Scholar]
- Weaver BA, Silk AD, Montagna C, Verdier-Pinard P, Cleveland DW. 2007. Aneuploidy acts both oncogenically and as a tumor suppressor. Cancer Cell 11: 25–36. [DOI] [PubMed] [Google Scholar]
- Williams BR, Prabhu VR, Hunter KE, Glazier CM, Whittaker CA, Housman DE, Amon A. 2008. Aneuploidy affects proliferation and spontaneous immortalization in mammalian cells. Science 322: 703–709. [DOI] [PMC free article] [PubMed] [Google Scholar]
- Xu X, Hou Y, Yin X, Bao L, Tang A, Song L, Li F, Tsang S, Wu K, Wu H, et al. 2012. Single-cell exome sequencing reveals single-nucleotide mutation characteristics of a kidney tumor. Cell 148: 886–895. [DOI] [PMC free article] [PubMed] [Google Scholar]
- Zhang F, Khajavi M, Connolly AM, Towne CF, Batish SD, Lupski JR. 2009. The DNA replication FoSTeS/MMBIR mechanism can generate genomic, genic and exonic complex rearrangements in humans. Nat Genet 41: 849–853. [DOI] [PMC free article] [PubMed] [Google Scholar]
- Zhang CZ, Spektor A, Cornils H, Francis JM, Jackson EK, Liu S, Meyerson M, Pellman D. 2015. Chromothripsis from DNA damage in micronuclei. Nature 522: 179–184. [DOI] [PMC free article] [PubMed] [Google Scholar]
- Zong C, Lu S, Chapman AR, Xie XS. 2012. Genome-wide detection of single-nucleotide and copy-number variations of a single human cell. Science 338: 1622–1626. [DOI] [PMC free article] [PubMed] [Google Scholar]
Associated Data
This section collects any data citations, data availability statements, or supplementary materials included in this article.