

Abstract
Anorexia is a common manifestation of chronic diseases, including cancer. Here we investigate the contribution to cancer anorexia made by calcitonin gene-related peptide (CGRP) neurons in the parabrachial nucleus (PBN) that transmit anorexic signals. We show that CGRPPBN neurons are activated in mice implanted with Lewis lung carcinoma (LLC) cells. Inactivation of CGRPPBN neurons before tumor implantation prevents anorexia and loss of lean mass, and their inhibition after symptom onset reverses anorexia. CGRPPBN neurons are also activated in Apcmin/+ mice that develop intestinal cancer and lose weight despite the absence of reduced food intake. Inactivation of CGRPPBN neurons in Apcmin/+ mice permits hyperphagia that counteracts weight loss, revealing a role for these neurons in a “non-anorexic” cancer model. We also demonstrate that inactivation of CGRPPBN neurons prevents lethargy, anxiety and malaise associated with cancer. These findings establish CGRPPBN neurons as key mediators of cancer-induced appetite suppression and associated behavioral changes.
Introduction
Illness is associated with behavioral changes (“sickness behaviors”) that may be adaptive in the acute setting1, but have deleterious consequences if they persist in patients with chronic disease. Notably, anorexia is common in patients with cancer-induced weight loss and, even when overt anorexia is absent, the ability to mount the compensatory increase of intake needed to counter ongoing weight loss is often lacking. Although available evidence suggests that cancer anorexia arises from signals emanating from the tumor and/or associated inflammatory processes that impinge on neural circuits controlling feeding behavior2, a discrete population of neurons responsible for cancer anorexia has yet to be identified. The absence of this fundamental information may help to explain the ineffectiveness of current treatment options.
In the current work, we focused on the hypothesis that neurons in the external lateral parabrachial nucleus (PBN) that express calcitonin gene-related peptide (CGRP) mediate cancer anorexia, based on both their ability to potently suppress appetite when activated3 and on evidence that they are situated downstream of neural systems activated by various cancer-related signals. Specifically, CGRPPBN neurons are activated by visceral signals that suppress feeding and inhibited by hunger-promoting hypothalamic AgRP neurons4, 5, neurocircuits that are also implicated in cancer anorexia6-8. Moreover, CGRPPBN neurons are activated by spinally-transmitted noxious stimuli and transduce affective-motivational aspects of pain9.
To test this hypothesis, we employed Cre-dependent viruses in transgenic mice to selectively manipulate CGRPPBN neurons in two established murine cancer models: implantable Lewis lung carcinoma (LLC) cells that induce weight loss and anorexia, and Apcmin/+ mice that develop intestinal cancer due to autosomal dominant mutation of the Apc gene10. Although the latter mice do not exhibit anorexia, they fail to increase food intake in the face of weight loss11, 12, implying a disruption of the normal adaptive response to negative energy balance. Results of these studies demonstrate that activation of CGRPPBN neurons is required for the effect of cancer to both induce anorexia and malaise (LLC tumor model) and to prevent adaptive increases of food intake that mitigates weight loss (Apcmin/+ mice).
Results
CGRPPBN neurons are activated in LLC tumor-bearing mice
To determine whether CGRPPBN neurons are active during cancer anorexia, we implanted LLC tumor cells in CalcaCre:GFP/+ transgenic mice that express green fluorescent protein (GFP) fused to Cre recombinase driven by the CGRP-encoding gene (Fig. 1a). Compared to sham-treated controls (including mice pair-fed to the intake of anorexic mice), tumor-bearing mice exhibited increased Fos expression in the external lateral PBN (Fig. 1b and Supplementary Fig. 1). Approximately 80% of Fos-immunoreactive neurons in tumor-bearing mice corresponded to GFP-labeled CGRPPBN neurons, while 41% of CGRPPBN neurons expressed Fos (Fig. 1c-d), a level comparable to what is observed following a large meal4. As sham-treated mice exhibited Fos in just 3% of CGRPPBN neurons, these data establish that CGRPPBN neurons are inappropriately active in tumor-bearing mice.
Figure 1. CGRPPBN neurons are pathologically active in tumor-bearing mice.
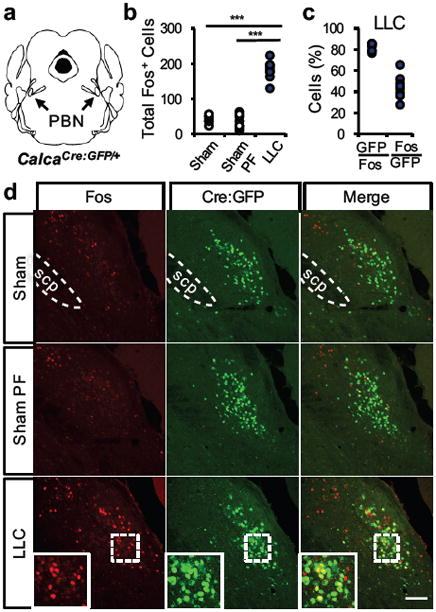
a, Illustration of PBN anatomical location in the pons. b, Quantification of Fos expression in the external lateral PBN in sham-treated or tumor-bearing mice (n = 7, Sham; n = 8, Sham PF; n = 9, LLC; one-way ANOVA: F(2,21) = 138.60, p < 0.0001). c, Coincidence of Cre:GFP-labeled CGRP neurons and Fos expression in tumor-bearing mice (n = 9, LLC). d, Representative images demonstrating Cre:GFP and Fos overlap. Data points in graphs represent each individual animal. *** P ˂ 0.001. PF, pair-fed; LLC, Lewis lung carcinoma cell implant; scp, superior cerebellar peduncle. Scale bar is 50 µm. See also Supplementary Fig. 1.
Inactivation of CGRPPBN neurons prevents LLC-induced anorexia
To determine whether activation of CGRPPBN neurons is required for cancer anorexia, we injected an adeno-associated virus expressing Cre-dependent tetanus toxin light chain (AAV1-DIO-GFP:TetTox) bilaterally into the PBN of CalcaCre:GFP/+ mice prior to LLC tumor implantation (Fig. 2a). Expression of TetTox prevents neurotransmitter release from Cre-expressing neurons13 and therefore selectively and permanently inactivates CGRPPBN neurons. Bilateral TetTox inactivation of CGRPPBN neurons fully prevented anorexia in LLC tumor-bearing mice compared to tumor-bearing controls that received PBN injections of AAV1-DIO-GFP control virus (Fig. 2b). Indeed, tumor-bearing mice with bilateral CGRPPBN neuronal inactivation increased their food intake compared to either baseline (prior to tumor implantation) or sham-treated mice (Fig. 2c). Although LLC tumor-bearing mice with bilateral TetTox inactivation of CGRPPBN neurons tended to lose less weight than LLC tumor-bearing controls, the effect did not reach statistical significance (Supplementary Fig. 2a). Interestingly, ad libitum-fed TetTox mice also developed larger tumors than tumor-bearing controls (Supplementary Fig. 2b).
Figure 2. Inactivation of CGRPPBN neurons prevents cancer anorexia.
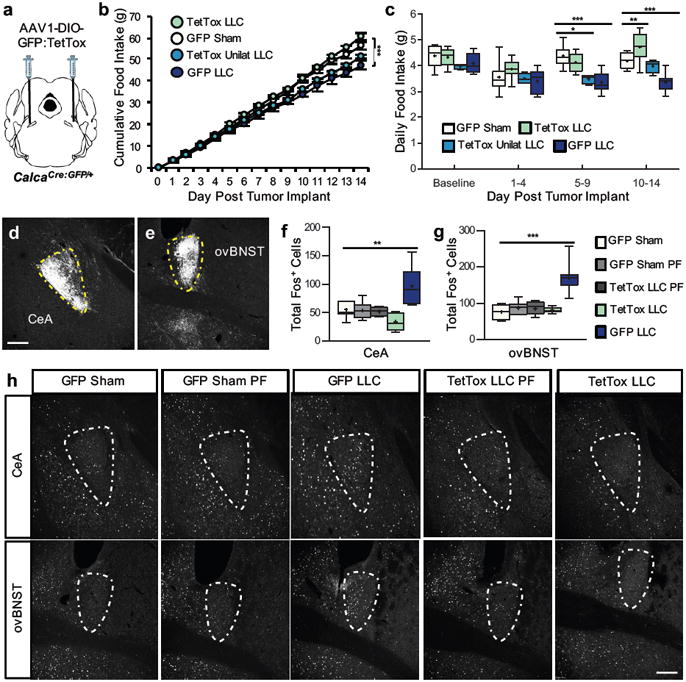
a, Stereotaxic injections of AAV1-DIO-GFP:TetTox (or AAV1-DIO-GFP control virus) into the PBN of CalcaCre:GFP/+ mice prior to LLC tumor implantation. b, Cumulative food intake following tumor implantation or sham treatment in mice with intact (GFP, n = 9), bilateral inactivation (TetTox, n = 8), or unilateral inactivation (TetTox Unilat, n = 4) of CGRPPBN neurons (two-way repeated measures ANOVA: Interaction, F(42, 350) = 19.99, p < 0.0001; Time, F(14, 350) = 4188, p < 0.0001; Treatment, F(3, 350) = 10.61, p = 0.0001). c, Average daily food intake at various time epochs (two-way repeated measures ANOVA: Interaction, F(9, 72) = 7.04, p < 0.0001; Time Epoch, F(3, 72) = 24.76, p < 0.0001; Treatment, F(3, 72) = 8.65, p = 0.0005). d-e, GFP-labeled axonal processes of CGRPPBN neurons in the CeA and ovBNST. Yellow, dashed outlines represent brain areas that were quantified for Fos expression. f-h, Quantification and representative images of Fos expression in the CeA (one-way ANOVA: F(4,38) = 12.79, p < 0.0001) and ovBNST (one-way ANOVA: F(4,38) = 25.00, p < 0.0001) of sham or tumor-bearing mice with intact (GFP) or inactivated (TetTox) CGRPPBN neurons. Line graphs show mean ± SEM. Box plots show mean (+), median, quartiles (boxes) and range (whiskers) for each treatment. * P ˂ 0.05, ** P ˂ 0.01, *** P ˂ 0.001. Scale bars are 100 µm. See also Supplementary Fig. 2.
CGRPPBN neurons have excitatory axonal projections to the central nucleus of the amygdala (CeA) and oval subnucleus of the bed nucleus of the stria terminalis (ovBNST; Fig. 2d-e)3, 9, brain areas involved in affective-motivational responses to stressful stimuli14, 15. Cancer anorexia was associated with increased Fos expression in both brain areas, and this effect was also prevented in TetTox mice (Fig. 2f-h), regardless of whether TetTox mice were fed ad libitum or were pair-fed to the intake of tumor-bearing controls (indicating that the outcome cannot be explained by differences of food intake). In addition to demonstrating that activation of CGRPPBN neurons is required for anorexia in the LLC tumor model, therefore, these data also support the possibility that projections of these neurons to the CeA and ovBNST contribute to associated behavioral phenotypes.
Inhibiting CGRPPBN neurons reverses established LLC-induced anorexia
To investigate whether acute inhibition of CGRPPBN neurons is sufficient to ameliorate established cancer anorexia, we bilaterally transduced these neurons with either AAV1-DIO-hM4Di:mCherry or AAV1-DIO-mCherry control virus (Fig. 3a). With this approach, CGRPPBN neuronal activity remains intact until administration of clozapine-N-oxide (CNO), an otherwise inert drug that activates the inhibitory hM4Di receptor. To ensure uniform timing of CNO administration relative to anorexia onset, drug administration commenced after two consecutive days of food intake decline. Consistent with our findings in TetTox mice, CNO administration fully reversed anorexia in the hM4Di tumor-bearing group, whereas food intake continued to decline in the CNO-treated mCherry tumor group (Fig. 3b-c and Supplementary Fig. 3a-b).
Figure 3. Established cancer anorexia is reversed with chemogentic inhibition of CGRPPBN neurons.
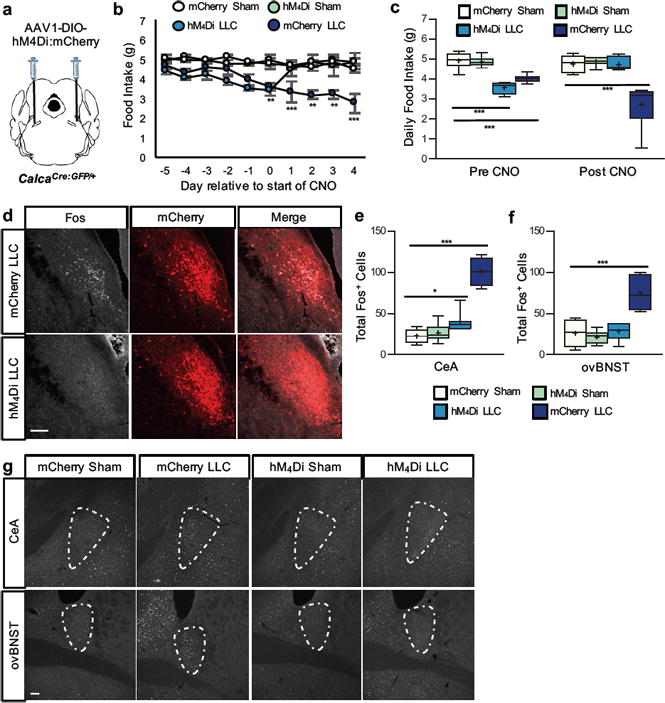
a, Stereotaxic injections of AAV1-DIO-hM4Di:mCherry or AAV1-DIO-mCherry control virus into the PBN of CalcaCre:GFP/+ mice prior to LLC tumor implantation. b, Daily food intake of sham-treated or tumor-bearing mice relative to the start of CNO treatment administered ip twice-daily at 2 mg/kg and in the drinking water (mCherry LLC, n = 8; mCherry Sham, n = 8; hM4Di LLC, n = 7; hM4Di Sham, n = 8; two-way ANOVA: Interaction, F(27, 237) = 3.34, p < 0.0001; Time, F(9, 237) = 2.72, p = 0.0049; Treatment, F(3, 237) = 44.53, p < 0.0001). c, Average daily food intake during the 4 d period prior to CNO treatment (Pre CNO) and all of the days after commencement of CNO treatment (Post CNO)(two-way ANOVA: Interaction, F(3, 54) = 17.55, p < 0.0001; Time, F(1, 54) = 0.37, p = 0.55; Treatment, F(3, 54) = 36.43, p < 0.0001). d, Representative images of Fos expression in the PBN of tumor-bearing mice with intact (mCherry) or inhibited (hM4Di) CGRPPBN neurons. e-g, Quantification and representative images of Fos expression in the CeA (one-way ANOVA: F(3, 30) = 74.56, p < 0.0001) and ovBNST (one-way ANOVA: F(3, 30) = 23.76, p < 0.0001) of sham or tumor-bearing mice with intact (mCherry) or inhibited (hM4Di) CGRPPBN neurons. Line graphs show mean ± SEM. Box plots show mean (+), median, quartiles (boxes) and range (whiskers) for each treatment. ** P ˂ 0.01, *** P ˂ 0.001. Scale bars are 50 µm. See also Supplementary Fig. 3.
Although none of the CNO-treated hM4Di tumor-bearing mice met criteria for euthanasia (see Methods), they were sacrificed together with tumor-bearing controls such that study duration and days receiving CNO treatment did not differ between groups (Supplementary Fig. 3c-d). CNO-induced CGRPPBN neuron inhibition prevented both tumor-induced weight loss (Supplementary Fig. 3e-f) and activation of both CGRPPBN neurons (percent of CGRPPBN neurons co-expressing Fos ± SEM; 85.2 ± 4.1 % mCherry LLC vs. 2.2 ± 1.4 % hM4Di LLC) and downstream CeA/ovBNST neurons (Fig. 3d-g). Acute inhibition of CGRPPBN neurons is therefore sufficient not only to prevent cancer anorexia and weight loss from developing but ameliorating it after it is established.
Role of CGRPPBN neurons in LLC tumor-induced changes of energy expenditure and body composition
Cancer-induced weight loss is often associated with wasting of lean mass (cachexia) that can also contribute to cancer-related mortality16. To determine the role played by activation of CGRPPBN neurons in cancer-induced wasting of lean mass and associated increase of energy expenditure17, we measured body composition (by quantitative magnetic resonance (QMR) and energy expenditure (by calorimetry) in TetTox mice and GFP controls before and after LLC tumor implantation (Fig. 4a). Although both groups exhibited comparable increases energy expenditure (Fig. 4b-d and Fig. 4e-g) and reductions of body fat mass compared to baseline (Fig. 4h and Fig. 4k), lean body mass was increased in TetTox mice (Fig. 4l) relative to GFP controls (Fig. 4i). This finding implicates CGRPPBN neuron activation in LLC-induced loss of lean mass, an effect that is independent of changes in either energy expenditure or fat mass.
Figure 4. Role of CGRPPBN neurons in cancer-induced cachexia and increased energy expenditure.

a, Time course of experiments with CalcaCre:GFP/+ mice that previously underwent stereotaxic injections of AAV1-DIO-GFP:TetTox (or AAV1-DIO-GFP control virus) into the PBN. b-d, Calorimetry measurements from GFP control mice (n = 9) before (Base) and after tumor implantation (VCO2, one-way repeated-measures ANOVA: F(3, 35) = 15.62, p < 0.0001; VO2, one-way repeated-measures ANOVA: F(3, 35) = 15.99, p < 0.0001; kcal/h, one-way repeated-measures ANOVA: F(3, 35) = 19.27, p < 0.0001). e-g, Calorimetry measurements taken from TetTox mice (n = 9) before (Base) and after tumor implantation (VCO2, one-way repeated-measures ANOVA: F(3, 35) = 15.29, p < 0.0001; VO2, one-way repeated-measures ANOVA: F(3, 35) = 18.00, p < 0.0001; kcal/h, one-way repeated-measures ANOVA: F(3, 35) = 15.16, p < 0.0001). h-i, Fat and lean body mass measurements of GFP control mice before, 17 d after tumor implantation (LLC1), and after developing anorexia (LLC2); hashtag indicates significant difference (P ˂ 0.05) between LLC1 and LLC2 (Fat Mass, one-way repeated-measures ANOVA: F(2, 26) = 57.13, p < 0.0001; Lean Mass, one-way repeated-measures ANOVA: F(3, 35) = 5.736, p < 0.01). j, Average daily food intake of GFP mice before and after tumor implant (one-way repeated-measures ANOVA: F(3, 35) = 10.94, p < 0.0001). k-l, Fat and lean body mass measurements from TetTox mice before (Base), 17 d after tumor implantation (LLC1), and after developing anorexia (LLC2)(Fat Mass, one-way repeated-measures ANOVA: F(2, 26) = 69.74, p < 0.0001; Lean Mass, one-way repeated-measures ANOVA: F(3, 35) = 10.90, p < 0.001). m, Average daily food intake of TetTox mice before and after tumor implant (one-way repeated-measures ANOVA: F(3, 35) = 3.718, p < 0.05). Box plots show mean (+), median, quartiles (boxes) and range (whiskers) for each treatment. * P ˂ 0.05, ** P ˂ 0.01, *** P ˂ 0.001; asterisks indicate significant differences compared to baseline. See also Supplementary Fig. 4 and Supplementary Fig. 5.
Body composition analyses were also performed after the onset of anorexia in GFP control mice (Fig. 4j and Fig. 4m) at time points that varied according to the time when anorexia became evident in each animal (Supplementary Fig. 4a-b). Even after taking differences of tumor mass into account, however, TetTox mice did not exhibit the cancer-induced loss of lean body mass (Fig. 4l and Supplementary Fig. 4f) that was clearly evident in GFP controls (Fig. 4i and Supplementary Fig. 4e). Moreover, whereas loss of fat mass increased between the first and second body composition measurements in GFP mice (Fig. 4h and Supplementary Fig. 4c), TetTox mice were protected from further fat loss (Fig. 4k and Supplementary Fig. 4d). TetTox mice developed significantly larger tumors than GFP control mice (Supplementary Fig. 4g). After the final body composition scan, mice were euthanatized and Fos staining was again undertaken to confirm efficacy of TetTox-induced CGRPPBN neuron inactivation. As expected, tumor-induced Fos immunoreactivity in the CeA and ovBNST was abolished in TetTox mice (Supplementary Fig. 5a-d). These results collectively indicate that inactivation of CGRPPBN neurons attenuates the loss of both lean and fat mass associated with cancer anorexia.
Involvement of CGRPPBN neurons in “non-anorexic” Apcmin+ mice
A cardinal feature of cancer anorexia is that, unlike what occurs in healthy animals and humans, progressive weight loss fails to trigger adaptive increases of food intake. Given the association between cancer and increased energy expenditure18, weight loss in the absence of increased feeding could reflect activation of anorexic neural circuitry that blocks the compensatory increase of feeding normally triggered by energy deficit. To address this issue and to extend our study of CGRPPBN neurons to a genetic cancer model, we utilized Apcmin/+ mice that begin to develop intestinal tumors as early as 4 wk of age and start to lose body weight around 12 wk of age12, 19 despite maintaining food intake at baseline levels11.
CalcaCre:GFP/+∷Apcmin/+ control mice displayed increased Fos expression in CGRPPBN neurons compared to CalcaCre:GFP/+ littermates at 16 wk of age (Fig. 5a-c and Supplementary Fig. 6). To examine the effect of inactivating CGRPPBN neurons on feeding behavior, we bilaterally transduced these neurons with AAV1-DIO-GFP:TetTox at 10 wk of age (prior to the onset of weight loss). In both male and female CalcaCre:GFP/+∷Apcmin/+mice, food intake was increased and weight loss prevented by inactivation of CGRPPBN neurons compared to either of two control groups (CalcaCre:GFP/+∷Apcmin/+ and CalcaCre:GFP/+ littermates injected with GFP virus; Fig. 5d-g, and Supplementary Fig. 7d-e).
Figure 5. Inactivation of CGRPPBN neurons permits hyperphagia in “non-anorexic” Apcmin/+ genetic cancer model.
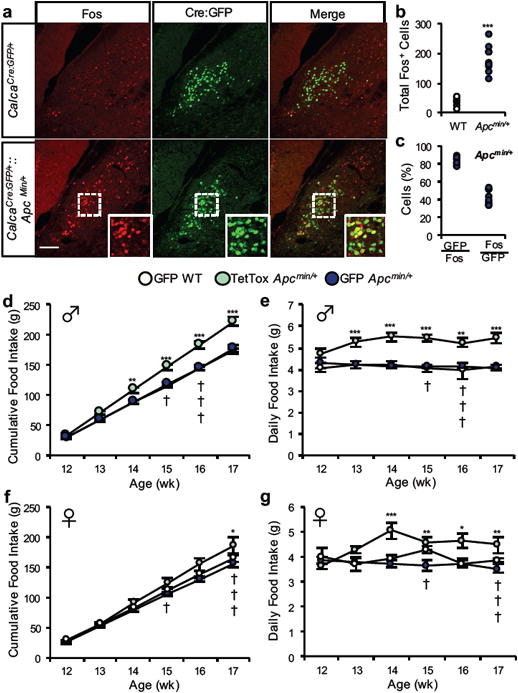
a-c, Quantification and representative images of Fos expression in Cre:GFP-labeled CGRPPBN neurons of CalcaCre:GFP/+∷Apcmin/+ mice (n = 9) or wild-type CalcaCre:GFP/+ littermates (n = 7). Data points in graphs represent each individual animal (student's t-test (two-tailed): t(14) = 7.95, p < 0.0001). d-e, Cumulative and average daily food intake of male CalcaCre:GFP/+∷Apcmin/+ and wild-type CalcaCre:GFP/+ littermates that received bilateral PBN injections of AAV1-DIO-GFP:TetTox to inactivate CGRP neurons or AAV1-DIO-GFP control virus (GFP Apcmin/+, n = 7; TetTox Apcmin/+, n = 7; GFP WT, n = 5; Cumulative Food Intake, two-way ANOVA: Interaction, F(10, 92) = 6.078, p < 0.0001; Time, F(5, 92) = 662.7, p < 0.0001; Treatment, F(2, 54) = 86.95, p < 0.0001; Daily Food Intake, two-way ANOVA: Interaction, F(10, 92) = 1.059, p = 0.4019; Time, F(5, 92) = 0.68, p = 0.64; Treatment, F(2, 92) = 69.58, p < 0.0001). f-g, Cumulative and average daily food intake of female cohort (GFP Apcmin/+, n = 12; TetTox Apcmin/+, n = 7; GFP WT, n = 4; Cumulative Food Intake, two-way ANOVA: Interaction, F(10, 118) = 2.97, p = 0.0023; Time, F(5, 118) = 451.1, p < 0.0001; Treatment, F(2, 118) = 21.35, p < 0.0001; Daily Food Intake, two-way ANOVA: Interaction, F(10, 119) = 2.47, p = 0.0101; Time, F(5, 119) = 1.42, p = 0.2233; Treatment, F(2, 119) = 21.92, p < 0.0001). Line graphs show mean ± SEM. Box plots show mean (+), median, quartiles (boxes) and range (whiskers) for each treatment. * P ˂ 0.05, ** P ˂ 0.01, *** P ˂ 0.001. † symbols represent euthanasia of a GFP Apcmin/+ mouse. Scale bar is 50 µm. See also Supplementary Fig. 5 and Supplementary Fig. 7.
The male cohort was euthanized at 17 wk of age for Fos analysis, regardless of body weight differences between groups (some GFP Apcmin/+ control mice were sacrificed earlier because they met criteria for euthanasia). Apcmin/+ mice had increased Fos expression (compared to cancer-free littermates) in the CeA and ovBNST that was abolished with TetTox inactivation of CGRPPBN neurons (Supplementary Fig. 7a-c). The female cohort study continued until mice were euthanized based on the criteria of losing 20% or more of peak body weight. Whereas the control group of tumor-bearing females continuously lost weight until criteria for euthanasia were met (average age ± SEM, 18.67 ± 0.53 wk), the body weights of TetTox Apcmin/+ mice remained comparable to cancer-free littermates throughout most of their life (Supplementary Fig. 7e). Weeks later (average age ± SEM, 22.30 ± 0.52 wk), the latter animals exhibited a rapid drop in daily food intake (Supplementary Fig. 7f-g) and, following euthanasia, had signs of gastrointestinal obstruction (stomachs distended with food despite cessation of feeding). Interestingly, these mice never exhibited signs of distress, which was assessed on a daily basis prior to euthanasia (data not shown), suggesting a role for CGRPPBN neurons in this outcome as well. Thus, whereas CGRPPBN neuronal inactivation prolonged life by restoring the ability of Apcmin/+ mice to mount an adaptive hyperphagia that prevents weight loss, it did not protect animals from the underlying malignancy.
Role of CGRPPBN neurons in cancer-induced malaise
In humans, loss of appetite resulting from cancer or illness is typically associated with malaise, characterized by feelings of discomfort, anxiety and lack of motivation. To investigate the role played by CGRPPBN neuronal activation in these responses, we measured sickness behaviors in mice with either intact or TetTox-inactivated CGRPPBN neurons before and after LLC tumor implantation. To control for differences of food intake between groups, TetTox mice were pair-fed to the intake of tumor-bearing control mice until completion of behavioral studies, at which point the pair-feeding regimen was terminated and ad libitum access to food was restored (Supplementary Fig. 8a).
Lethargy can be assessed in rodents by measuring locomotor activity20. Compared to tumor-bearing controls, locomotor activity was increased in TetTox tumor-bearing mice, whether measured as the total distance moved or the average velocity of movement (Fig. 6a-d). To determine if CGRPPBN neuronal activation is similarly required for cancer-induced anxiety, we utilized open-field and elevated-plus-maze tests. Anxiety-like behavior was increased in tumor-bearing controls and this manifestation of cancer was prevented by inactivation of CGRPPBN neurons (Fig. 6e-f and 6h-i). Tumor-bearing control mice also spent more time in a hunched posture (a sign of malaise), and this effect was again prevented by CGRPPBN neuron inactivation (Fig. 6g and 6j). Nesting behavior offers an additional measure of malaise and lack of motivation in rodents21, 22. Using a protocol that takes into account the rate and quality of nest construction, no differences were detected between GFP and TetTox mice at baseline. Whereas tumor implantation had no effect on nest construction in TetTox mice, control mice failed to finish their nest within 24 h (Fig. 6k-l).
Figure 6. Inactivation of CGRPPBN neurons attenuates sickness behaviors in LLC cancer model.
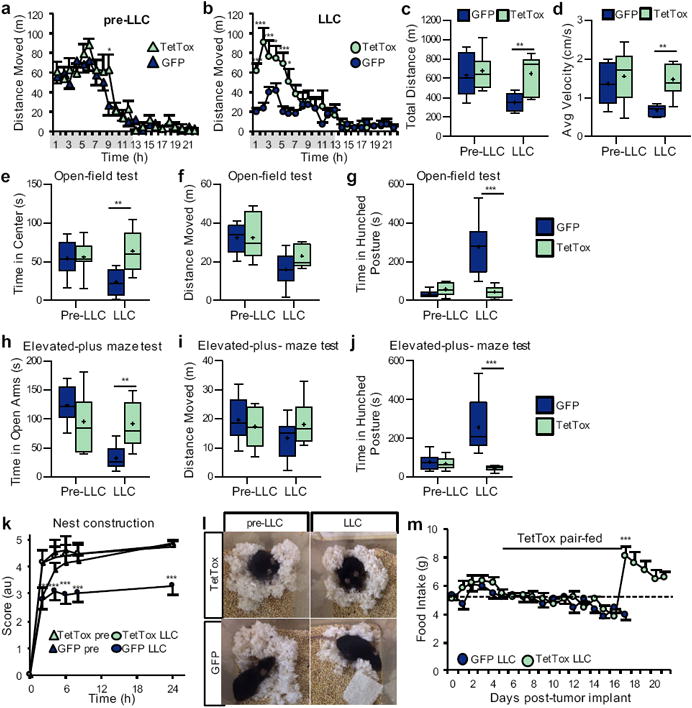
a-b, Hourly locomotor activity of mice with intact (GFP, n = 8) or inactivated (TetTox, n = 7) CGRPPBN neurons, prior to tumor implantation and 13 d after implantation (Pre-LLC, two-way repeated measures ANOVA: Interaction, F(22, 286) = 1.12, p = 0.3222; Time, F(22, 286) = 39.31, p < 0.0001; LLC, two-way repeated measures ANOVA: Interaction, F(1, 286) = 4.48, p < 0.0001; Time, F(22, 286) = 15.91, p < 0.0001; Treatment, F(1, 286) = 14.73, p = 0.0021). Grey-shaded region on × axis represents dark-cycle. c-d, Total distance traveled and average velocity of locomotor activity during 23-h recording period of GFP and TetTox mice prior to and after tumor implantation (Total Distance, two-way repeated measures ANOVA: Interaction, F(1, 13) = 6.21, p = 0.0270; Time, F(1, 13) = 15.91, p = 0.0096; Treatment, F(1, 13) = 4.76, p = 0.0480; Avg Velocity, two-way repeated measures ANOVA: Interaction, F(1, 13) = 2.95, p = 0.1099; Time, F(1, 13) = 4.69, p = 0.0495; Treatment, F(1, 13) = 8.05, p = 0.0140). e-g, Measurements from open-field anxiety test of GFP and TetTox mice prior to and 15 d after tumor implantation (Time in Center, two-way repeated measures ANOVA: Interaction, F(1, 13) = 7.19, p = 0.0189; Time, F(1, 13) = 2.40, p = 0.1453; Treatment, F(1, 13) = 5.64, p = 0.0337; Distance Moved, two-way repeated measures ANOVA: Interaction, F(1, 13) = 1.99, p = 0.1814; Time, F(1, 13) = 26.04, p = 0.0002; Treatment, F(1, 13) = 0.92, p = 0.3547; Time in Hunched Posture, two-way repeated measures ANOVA: Interaction, F(1, 13) = 20.23, p = 0.0006; Time, F(1, 13) = 16.40, p = 0.0014; Treatment, F(1, 13) = 15.35, p = 0.0018). h-j, Measurements from elevated-plus maze anxiety test of GFP and TetTox mice prior to and 15 d after tumor implantation (Time in Open Arm, two-way repeated measures ANOVA: Interaction, F(1, 13) = 14.60, p = 0.0021; Time, F(1, 13) = 16.74, p = 0.0013; Treatment, F(1, 13) = 1.032, p = 0.3283; Distance Moved, two-way repeated measures ANOVA: Interaction, F(1, 13) = 1.59, p = 0.2299; Time, F(1, 13) = 1.02, p = 0.3310; Treatment, F(1, 13) = 0.28, p = 0.6045; Time in Hunched Posture, two-way repeated measures ANOVA: Interaction, F(1, 13) = 9.82, p = 0.0079; Time, F(1, 13) = 5.92, p = 0.0302; Treatment, F(1, 13) = 16.26, p = 0.0014). k-l, Quantification and representative images (24-h time point) of nesting behavior before and 16 d after tumor implantation (two-way ANOVA: Interaction, F(15, 156) = 3.01, p = 0.0003; Time, F(5, 156) = 228.40, p < 0.0001; Treatment, F(3, 156) = 44.61, p < 0.001). m, Daily food intake of GFP and TetTox mice after tumor implantation (two-tailed student's t-test on day 17: t(13) = 6.36, p < 0.0001). TetTox mice were pair-fed to the intake of GFP mice until day 16, after which TetTox mice were allowed ad libitum access to food. Line graphs show mean ± SEM. Box plots show mean (+), median, quartiles (boxes) and range (whiskers) for each treatment. * P ˂ 0.05, ** P ˂ 0.01, *** P ˂ 0.001. See also Supplementary Fig. 8.
After completion of behavioral studies, tumor-bearing TetTox mice were allowed ad libitum access to food. Unlike tumor-bearing controls that by this point had become moribund and anorexic, TetTox mice nearly-doubled their food intake upon termination of the pair-feeding regimen (Fig. 6m). That this hyperphagic response reversed cancer-induced weight loss (Supplementary Fig. 8b) suggests that the ability to mount a compensatory increase of intake in response to weight loss is undermined by cancer anorexia, and that this ability is restored by CGRPPBN neuronal inactivation. These outcomes cannot be attributed to differences in tumor mass, since tumors tended to be larger in TetTox mice than in controls, although the difference did not reach statistical significance in this experiment (Supplementary Fig. 8c).
Discussion
Insight into neural circuits mediating cancer anorexia is essential for both a more complete understanding of the underlying disease process and for the development of effective treatments. Here, using viral and genetic techniques to visualize and selectively manipulate CGRPPBN neurons, we establish that these neurons are activated in tumor-bearing mice and that this activation is required for cancer-induced appetite suppression and malaise.
Because of its key role in energy homeostasis, the hypothalamic arcuate nucleus has been a prominent focus of prior work in this field. In healthy animals, weight loss activates AgRP neurons23, which stimulates appetite24, reduces metabolic rate25 and inhibits neural circuits that suppress appetite, including both POMC26 and CGRPPBN neurons4. One hypothesis invoked to explain cancer anorexia proposes that, despite weight loss and appropriate changes in circulating hormones27, 28, inflammation-mediated activation of POMC neurons increases downstream melanocortin signaling via the melanocortin-4 receptor (MC4R) and thereby inhibits food intake despite ongoing weight loss29, 30. The same mechanism is proposed to simultaneously block activation of AgRP neurons8, which functionally oppose POMC neurons in part by releasing AgRP, an endogenous MC4R antagonist31. Indeed, cancer anorexia can be attenuated by central administration of MC4R antagonists32, 33. Since CGRPPBN neurons express the MC4R34 and are supplied with inhibitory projections from AgRP neurons4, they are potential mediators of cancer anorexia lying downstream of the arcuate nucleus.
However, cancer anorexia is not always ameliorated by central injection of MC4R antagonists35, and cancer anorexia can be associated with seemingly appropriate responses of arcuate nucleus neurons to weight loss 8, 27, 36-38. Furthermore, neurocircuits additional to the arcuate hypothalamus are implicated in other models of inflammatory anorexia39. For example, anorexia following administration of lipopolysaccharide, an endotoxin that induces systemic inflammation and anorexia, cannot be reversed by activation of AgRP neurons40 but is ameliorated by inhibiting CGRPPBN neurons3. Mechanisms underlying cancer anorexia may therefore vary depending on the type of cancer and/or severity of cancer-induced inflammation, and likely involve extra-hypothalamic anorexigenic circuits.
These considerations support a model in which cancer-associated inflammatory cytokines induce anorexia in part by activating the “parabrachial-amygdala threat circuit”9, potentially via effects on upstream vagal and spinal sensory pathways, in addition to effects on arcuate nucleus neurons. In support of this hypothesis, inactivation of CGRPPBN neurons in mice with implanted LLC tumors prevented the onset of cancer anorexia, and chemogenetic inhibition of these neurons reversed established anorexia in these mice, a novel and potentially clinically relevant finding. CGRPPBN neuron inactivation also enabled animals with cancer-associated weight loss to mount a compensatory increase of food intake. In Apcmin/+ mice, this effect prevented cancer-induced weight loss, and in LLC tumor-bearing mice, it enabled a robust hyperphagia after being pair-fed to the intake of LLC tumor-bearing controls.
That CGRPPBN neuron inactivation confers the capacity of tumor-bearing mice to increase food intake in response to weight loss implies that the brain of tumor-bearing mice does in fact receive appropriate energy-deficit signals, but that activation of CGRPPBN neurons blocks their transduction into an adaptive feeding response. Our data suggest that the CeA and BNST lie downstream of CGRPPBN neurons in this anorexigenic pathway. Although CGRPPBN neurons do not have direct axonal projections to the arcuate nucleus, the CeA and BNST have extensive hypothalamic connections that may ultimately be integrated with hypothalamic homeostatic signals that regulate appetite41.
We selected the LLC and Apcmin/+ cancer models for our studies because of differences in several key aspects, including their effect on feeding behavior (anorexia vs. failure to mount a compensatory increase of intake), time course of weight loss (weeks vs. months), source of tumor (implantable vs. genetic mutation), and tumor location (subcutaneous vs. gastrointestinal). Given these differences, we suspect that CGRPPBN neurons represent a common node for suppression of appetite by many cancers, and additional studies are warranted to test this hypothesis. We also note that since activation of CGRPPBN neurons can prevent the expected compensatory increase of food intake during weight loss, this mechanism may contribute to weight loss even when food intake is not obviously affected.
Cancer anorexia, cachexia, and tumor growth
Loss of lean body mass is a major contributor to cancer-related mortalities16 that can potentially arise from circulating factors (released by either the tumor or the animal) acting on muscle tissue, combined with increased energy expenditure, metabolic dysregulation, and reduced food intake16. Using the LLC tumor model, we provide evidence implicating activation of CGRPPBN neurons in this wasting process, since cancer-induced loss of lean body mass was ameliorated by inactivation of these neurons and prevention of anorexia. From this observation, one might predict that provision of sufficient calories would prevent or reverse weight loss in cancer patients. In the clinic, however, this is not typically observed, presumably because of an ongoing catabolic state that is not remedied by providing nutritional support42. This observation has diverted attention from the problem of anorexia because it implies that restoring normal food intake will not suffice to prevent cachexia, a problem compounded by the fact that conventional therapeutic agents used to stimulate appetite in cancer patients have glucocorticoid-like effects43 that may exacerbate muscle wasting44, 45. In this context, our finding that inhibition of CGRPPBN neurons protects against loss of lean body mass raises the possibility that these neurons influence processes involved in cachexia independently of their effect on food intake. Future studies to examine the role of these neurons in cancer cachexia are therefore warranted.
Although our studies were not designed to investigate the roles of either CGRPPBN neurons or anorexia on tumor growth, we observed larger tumors in two separate experiments in which mice with inactive CGRPPBN neurons had ad libitum access to food. That this increase in tumor growth depends on increased food intake is consistent with evidence that mice fed the same amount of food as tumor-bearing control mice did not develop larger tumors. It remains possible, however, that activation of CGRPPBN neurons also elicits food intake-independent responses that limit tumor growth. Recent studies suggest that activation of CGRPPBN neurons contributes to chemotherapy-induced anorexia and weight loss46. Examination of tumor growth in mice receiving chemotherapy treatment will be needed to examine the potential clinical utility of inhibiting CGRPPBN neurons in cancer patients.
Cancer-induced malaise
Cancer patients often experience profound deterioration in quality of life as their disease progresses, marked by feelings of malaise and associated ‘sickness behaviors’. Although these behavioral consequences of cancer likely have a complex, multifactorial etiology, the fact that tumor-bearing mice exhibit similar responses indicates that at least some of the underlying mechanisms are shared across species. We found that mice with implantable LLC tumors exhibit behavioral phenotypes suggestive of lethargy, anxiety, and malaise. The observation that these behaviors were ameliorated by inactivation of CGRPPBN neurons suggests that in addition to suppressing appetite, cancer-induced activation of CGRPPBN neurons contributes to the associated affective-motivational state. These findings are consistent with an emerging view that the external lateral PBN (including CGRP neurons) plays a critical role in coordinating behavioral, affective, and neuroendocrine responses to diverse noxious stimuli47.
Future dissection of downstream CGRPPBN neuronal pathways may assist in determining whether anorexia and associated sickness behaviors involve separate or overlapping neural pathways. Because our behavioral studies were performed using a pair-feeding regimen that prevented potentially confounding differences of intake between groups, the possibility can be considered that increased hunger (induced by pair-feeding) contributed to the effect of CGRPPBN neuron inactivation to alleviate sickness behaviors. We view this explanation as unlikely, however, since chronic food restriction in healthy mice does not increase home cage locomotor activity48 and because anorexia and decreased locomotor activity are separable features of illness20, 33. Although anxiety-like behaviors are sensitive to perceived energy deficits49,50, we note that even in sated mice experimental activation of CGRPPBN neurons is sufficient to elicit behavioral stress responses9.
Conclusions
In summary, our data indicate that activation of CGRPPBN neurons is both necessary and sufficient to explain major affective-motivational features of cancer, including anorexia, lethargy, anxiety, and malaise. Translation of these findings to the clinic may ultimately assist in the identification of therapeutics with the potential to substantially improve the quality of life of patients with cancer.
Methods
Animals
CalcaCre:GFP/+ mice (C57Bl/6 background) were generated and maintained as previously described 3. Male CalcaCre:GFP/+ mice were used for all behavioral and immunohistochemical Fos studies involving LLC tumor implantation. Both genders were utilized for experiments involving CalcaCre:GFP/+∷Apcmin/+ double-transgenic mice. Each experiment involved mice from at least six different litters. Mice (ranging from 3-6 months of age) were assigned into each group to counterbalance for differences in body weight and age. Investigators were not blinded to treatment conditions. Following stereotaxic surgery, mice were singly housed for at least 3 wk prior to and during experimentation, with ad libitum access (unless noted otherwise) to standard chow diet (LabDiet 5053) in temperature- and humidity-controlled facilities with 12-h light/dark cycles. Behavioral experiments were conducted during the light cycle, unless stated otherwise. The criteria for euthanasia was a cumulative score of 8 from the grading rubric (Supplementary Table 1), which involves body weight and subjective observations of distress-like symptoms. All animal care and experimental procedures were approved by the Institutional Animal Care and Use Committee at the University of Washington.
Virus production
AAV1-CBA-DIO-GFP:TetTox, AAV1-EF1a-DIO-GFP, AAV1-EF1a-DIO-hM4Di:mCherry, and AAV1-EF1a-DIO-mCherry viral vectors were produced by transfecting HEK cells and then purifying cell extracts by pelleting through sucrose and by CsCl-gradient ultracentrifugation. Final pellets were suspended in 0.1 M PBS.
Stereotaxic surgery
All mice were anesthetized with 1.5 to 2.0% isoflurane (mixed with 0.8 L per min of oxygen) for stereotaxic surgeries and virus injections. Virus (0.3 µl per side) was injected using a glass capillary attached to a Nanoject (Drummond, catalogue #3-00-204) using the following coordinates: -4.65 mm posterior to bregma, -1.30 mm lateral from midline, and -2.90 mm ventral to dura. These coordinates were verified with Fluoro-Gold (Sigma-Aldrich, catalogue #39286) injections in non-experimental mice, which produced Fluoro-Gold labeling that was restricted to the lateral PBN.
Tumor cell culturing and implantation
LLC cells were cultured in DMEM with 10% fetal bovine serum (FBS) as recommended by the supplier (American Type Culture Collection; catalogue #CRL-1642; lot #62996849), harvested, and then stored in 1.7 ml aliquots (10% glycerol in culture media) in liquid nitrogen for long-term storage. Cell line was authenticated by supplier, but subcultures were not authenticated prior to tumor implantation. At the beginning of each experiment, cells were defrosted, cultured, harvested, pelleted, and suspended in fresh DMEM with 10% FBS. Approximately 1 × 10⁶ cells (in 0.2 ml of DMEM solution) were injected subcutaneously into the left flank of mice.
Body composition analysis
Measures of fat and lean body mass were determined in live mice using quantitative magnetic resonance (QMR) spectroscopy (EchoMRI 3-in-1, Echo MRI)51. QMR measures of fat content were validated by scanning a calibration holder containing a known amount of fat. Because tumors are detected as lean body mass by the QMR machine (verified with isolated tumor samples), the tumor mass was subtracted from the lean body mass measurement for final analysis of body composition in tumor-bearing mice.
Indirect calorimetry
Mice were acclimated to metabolic cages prior to measurement of energy expenditure using a computer-controlled indirect calorimetry system (Promethion, Sable Systems) made available through the University of Washington Nutrition Obesity Research Center (NORC) Energy Balance and Glucose Metabolism (EBGM) Core. Calorimeter cages (similar to home cages with bedding) were equipped with water bottles and housed in a temperature in a temperature- and humidity-controlled cabinet (Caron Products and Services). O2 consumption and CO2 production was measured for each animal for 1 min at 10-min intervals as described52. Respiratory quotient (RQ) was calculated as the ratio CO2 production and O2 consumption. Energy expenditure was calculated using the Weir equation53. To control for the influence of body size variation on total energy expenditure54, group comparisons were adjusted for total body mass using analysis of covariance55. Data acquisition and analysis were coordinated by MetaScreen v. 1.6.2., and the raw data was processed using ExpeData v. 1.4.3. (Sable Systems). For further details regarding analysis of energy expenditure, see below in ‘Experimental designs’ subsection.
Behavioral measures
Food intake and bodyweight measurements
Food intake and body weights were monitored manually on a daily basis, including an acclimation period (about 3 d) before tumor implantation.
Locomotor activity
Mice were housed in a home-cage PhenoTyper (Noldus) apparatus equipped with infrared videotracking, made available through the University of Washington Center on Human Development and Disability (CHDD) Mouse Behavior Lab. Video files were analyzed with EthoVision software (v. XT 10, Noldus). Mice were housed in these cages for three days prior to tumor implantation (starting on day -8) and for an additional three days after tumor implantation (starting on day 10). Data were analyzed from the third day (for both before and after tumor implant), after mice had acclimated to the cage.
Open-field test
Mice were placed in the center of a 40 × 40 cm square open-field arena with non-transparent white Plexiglas56. The total distance moved and time in center (20 × 20 cm imaginary square), during the 10 min trial, were analyzed with video-tracking software (EthoVision XT 10, Noldus). Hunched posture was defined as ≤ 35% of the maximum body elongation length using the three-point detection setting that detects the distance between the nose, midsection, and base of the tail.
Elevated-plus-maze test
The maze used in this study has two closed arms (5.1. × 30 cm) surrounded by 20-cm high non-transparent walls and two open arms (5.1 × 30 cm)56. The total distance moved and time in closed and open arms (during the 10 min trial) was analyzed with EthoVision.
Nest construction
To examine nesting behavior, mice were transferred to a new home cage with clean bedding and new nest-building material, a 5 × 5 cm square of compressed cotton (Nestlets TM, Ancare). Nest building was scored 2, 4, 6, 8, and 24 h later, as described57.
Experimental designs
LLC cohort 1 (Figure 1)
Tumor-bearing and sham-treated mice (including those pair-fed to the intake of tumor-bearing mice) were euthanized after a statistical difference was observed between the food intake of tumor-bearing mice and sham-treated mice with ab libitum food access. Because CGRPPBN neurons are activated after consuming a large meal 4, brains from tumor-bearing mice and healthy sham-treated controls were obtained during the light-cycle (when food intake is minimal), 4 h after food removal. These mice were sacrificed 14 d after tumor implantation and Fos immunoreactivity was analyzed in the PBN.
LLC cohort 2 (Figure 2)
Five experimental groups were examined for this study that received bilateral PBN injections of either AAV1-DIO-GFP or AAV1-DIO-GFP:TetTox prior to tumor implantation or sham treatment: GFP LLC, TetTox LLC, pair-fed TetTox LLC, GFP Sham, and pair-fed GFP Sham. A sixth group, TetTox Unilat LLC, was added after post-hoc confirmation of (non-purposeful) unilateral viral transduction. To acclimate mice to testing procedures, food intake and body weights were recorded manually on a daily basis (1 h prior to lights out) several days before tumor implantation. Mice had ad libitum access to food, with the exception of pair-fed control groups, which were fed the same amount of food that their tumor-bearing GFP counterparts were consuming after tumor implantation (individually matched prior to tumor implantation based on bodyweight). Fourteen days after tumor implantation, food was withheld for 4 h during the light-cycle, after which mice were sacrificed for immunohistochemical detection of Fos in the CeA, and ovBNST.
LLC cohort 3 (Figure 3)
Four experimental groups were examined for this study that received bilateral PBN injections of either AAV1-DIO-mCherry or AAV1-DIO-hM4Di-mCherry prior to tumor implantation or sham treatment: mCherry LLC, hM4Di LLC, mCherry Sham, and hM4Di Sham. After an acclimation period of daily food intake and body weight monitoring, mice were implanted with LLC cells (or sham-treated) and had ad libitum food access for the entirety of the study. After approximately 2 d of decreased food intake, tumor-bearing mice received twice-daily injections of CNO (2 mg/kg i.p., Sigma) and two-bottle choice of water or CNO-containing water (0.03 mg/ml, NIMH Chemical Synthesis and Drug Supply Program). The criteria for euthanasia involved a cumulative score of 8 from the grading rubric (Supplementary Table 1), which involves body weight and subjective observations of distress-like symptoms. None of the sham-treated and hM4Di tumor-bearing mice reached the criteria for euthanasia, but they were matched with mCherry tumor-bearing mice (based on when CNO treatment began) and sacrificed at the same time as mCherry tumor-bearing counterparts to account for differences in days receiving CNO treatment. All mice received their final CNO injection (2 mg/kg ip) 2 h before euthanasia and extraction of brain tissue for Fos analysis.
LLC cohort 4 (Figure 4)
Mice received bilateral PBN injections of either AV1-DIO-GFP or AAV1-DIO-GFP:TetTox. Three weeks after virus injection, and before tumor implantation, mice underwent a QMR scan to measure body composition, and then single-housed in indirect calorimetry chambers for 4 days. For baseline calorimetry measurements, we analyzed data from the dark cycle on days 2-4 (after acclimation to chambers). After the baseline calorimetry measurements, mice were implanted with tumor cells and placed in their home cage, and then housed in calorimetry chambers starting 13 days after tumor implantation for 4 days. For post-tumor calorimetry, we analyzed dark cycle data from 14-16 days post tumor implantation. On day 17 post tumor implantation, we examined body composition with QMR (this measurement occurred before development of anorexia). After development of anorexia (which occurred 2-7 days after the first post-tumor body composition measurement), mice underwent a final body composition scan prior to euthanasia. We extracted the tumors and subtracted the tumor weight from the final lean body mass measurement.
Apcmin/+ cohorts (Figure 5)
For PBN Fos analysis, the first group of CalcaCre:GFP/+∷Apcmin/+ mice (male and female) were euthanized at 16 wk of age. For feeding behavior analysis, CalcaCre:GFP/+∷Apcmin/+ mice received bilateral PBN injections of either AAV1-DIO-GFP or AAV1-DIO-GFP:TetTox at 10 wk of age and food intake and body weights were monitored starting at 12 wk of age. CalcaCre:GFP/+ littermates were used as controls and received bilateral PBN injections of AAV1-DIO-GFP. The male cohort of animals were euthanized at 17 wk of age (regardless of body weight), or earlier if they met the pre-established criteria for euthanasia (loss of 20% peak body weight or cumulative distress score of 8; Supplementary Table 1). The brains from the male cohort were processed for immunohistochemical analysis of Fos in the CeA and ovBNST. The female cohort of mice was euthanized based on the pre-established criteria for euthanasia (loss of 20% peak body weight or cumulative distress score of 8; Supplementary Table 1).
LLC cohort 5 (Figure 6)
For sickness behavioral analyses of tumor-bearing mice with intact or inactivated CGRPPBN neurons, we utilized a within-subjects experimental design involving GFP and TetTox mice before and after tumor implantation. TetTox mice were pair-fed during days 5-16 post-tumor implantation to control for differences in food intake. We conducted anxiety tests 4 d before and 15 d after tumor implantation. Nesting behavior was analyzed 3 d before and 16 d after tumor implantation. Locomotor activity was analyzed from data collected 5 d before and 13 d after tumor implantation.
Immunohistochemistry
For all immunohistochemical experiments, mice were anesthetized (Beuthanasia, 320 mg/kg delivered ip) and intracardially perfused with 0.1 M PBS followed by 4% paraformaldehyde. Brains were then extracted, post-fixed in 4% paraformaldehyde overnight, and cryoprotected in 0.1 M PBS containing 20% sucrose until the brains sunk in the sucrose solution. Coronal cryostat sections 30-µm thick were collected and every third section of the PBN and BNST, or every fourth section of the CeA, were processed for immunolabeling and quantification. For co-labeling of GFP and Fos, sections were incubated for 16 h at room temperature in chicken anti-GFP (1:10000, catalogue # ab13970, lot #GR236651-4, Abcam) and goat anti-Fos (1:700, catalogue # sc-52-G, lot #F1615, Santa Cruz Biotechnology). Because we ran out of our original Fos antibody, tissue from Figure 4 was stained with goat anti-Fos from a different lot (1:700, catalogue # sc-52-G, lot #F1616 Santa Cruz Biotechnology). The sections were then washed and incubated for 2 h at room temperature in Alexa488-conjugated donkey anti-chicken (1:400, Jackson ImmunoResearch) and CY5-conjugated donkey anti-goat (1:400, Jackson ImmunoResearch).
Microscopy and Fos analysis
Images were acquired at 10× and 20× magnification for figure presentation and quantification, respectively, using a laser-scanning confocal microscope (FV1200, Olympus). Fos and GFP colocalization counts were performed using the Cell Counter feature on ImageJ (v. 1.48). Cell counts were obtained from two sections for each brain region corresponding to the following coordinates58: -5.15 mm and -5.25 mm bregma, PBN (unilateral, left PBN); -1.55 mm and -1.75 mm bregma, CeA (bilateral); 0.15 mm and 0.25 mm bregma, BNST (bilateral).
Statistics
Data were analyzed using Prism 5.0 (GraphPad Software). Sample sizes were estimated based on prior experience4 and expected variability in behaviors between tumor-bearing animals. We excluded an animal from data analysis if post hoc histological analysis showed no viral transduction as indicated by an absence of GFP or mCherry fluorescence. For graphs comparing two experimental conditions, we used unpaired two-tailed Student's test. For graphs comparing multiple treatments (one time-point), we utilized repeated-measures one-way ANOVA tests, with Tukey's post-hoc multiple comparisons test. Data sets with multiple treatments and time-points were analyzed with repeated-measures two-way ANOVA tests (time repeated factor), followed by Bonferroni's post-hoc tests. For analysis of Apcmin/+ experiments, which involved euthanasia of mice during the study, we utilized regular (not repeated measures) two-way ANOVA tests (time repeated factor). Normality and variance were examined with Shapiro-Wilk's test and Bartlett's test, respectively.
Supplementary Material
Acknowledgments
We thank M. Chiang for maintaining the mouse colony, T. Cole for assistance with PhenoTyper data, and H. Nguyen for general assistance. We also thank G. Morton, J. Nelson, and K. Ogimoto for their assistance with conducting and interpreting the body composition and energy expenditure experiments. The research was supported by a fellowship grant from Hope Funds for Cancer Research to C.A.C., National Institutes of Health grants to M.W.S. (CA184630-01, DK090320, DK101997, and DK083042), R.D.P. (R01-DA24908), and the University of Washington CHDD Mouse Behavior Lab (U54 HD083091).
Footnotes
Data availability The authors declare that data supporting the findings of this study are available within the paper and its Supplementary information files.
Author Contributions C.A.C., B.E.W., R.D.P., and M.W.S. conceived and designed the study. C.A.C. and A.J.B. performed and analyzed histological and feeding experiments. C.A.C., A.J.B., and S.H. performed and analyzed sickness behavior tests. R.D.P. and M.W.S. provided equipment and reagents. C.A.C. and M.W.S. wrote the manuscript with input from all authors.
Disclosure summary The authors have nothing to disclose.
References
- 1.Hart BL. Biological basis of the behavior of sick animals. Neurosci Biobehav Rev. 1988;12:123–137. doi: 10.1016/s0149-7634(88)80004-6. [DOI] [PubMed] [Google Scholar]
- 2.Ezeoke CC, Morley JE. Pathophysiology of anorexia in the cancer cachexia syndrome. J Cachexia Sarcopenia Muscle. 2015;6:287–302. doi: 10.1002/jcsm.12059. [DOI] [PMC free article] [PubMed] [Google Scholar]
- 3.Carter ME, Soden ME, Zweifel LS, Palmiter RD. Genetic identification of a neural circuit that suppresses appetite. Nature. 2013;503:111–114. doi: 10.1038/nature12596. [DOI] [PMC free article] [PubMed] [Google Scholar]
- 4.Campos CA, Bowen AJ, Schwartz MW, Palmiter RD. Parabrachial CGRP Neurons Control Meal Termination. Cell Metab. 2016;23:811–820. doi: 10.1016/j.cmet.2016.04.006. [DOI] [PMC free article] [PubMed] [Google Scholar]
- 5.Roman CW, Derkach VA, Palmiter RD. Genetically and functionally defined NTS to PBN brain circuits mediating anorexia. Nature Comm. 2016;7 doi: 10.1038/ncomms11905. [DOI] [PMC free article] [PubMed] [Google Scholar]
- 6.Tsai VW, et al. The anorectic actions of the TGFbeta cytokine MIC-1/GDF15 require an intact brainstem area postrema and nucleus of the solitary tract. PloS One. 2014;9:e100370. doi: 10.1371/journal.pone.0100370. [DOI] [PMC free article] [PubMed] [Google Scholar]
- 7.Ruud J, Blomqvist A. Identification of rat brainstem neuronal structures activated during cancer-induced anorexia. J Comp Neurol. 2007;504:275–286. doi: 10.1002/cne.21407. [DOI] [PubMed] [Google Scholar]
- 8.Scarlett JM, et al. Regulation of agouti-related protein messenger ribonucleic acid transcription and peptide secretion by acute and chronic inflammation. Endocrinology. 2008;149:4837–4845. doi: 10.1210/en.2007-1680. [DOI] [PMC free article] [PubMed] [Google Scholar]
- 9.Han S, Soleiman MT, Soden ME, Zweifel LS, Palmiter RD. Elucidating an Affective Pain Circuit that Creates a Threat Memory. Cell. 2015;162:363–374. doi: 10.1016/j.cell.2015.05.057. [DOI] [PMC free article] [PubMed] [Google Scholar]
- 10.Moser AR, Pitot HC, Dove WF. A Dominant Mutation That Predisposes to Multiple Intestinal Neoplasia in the Mouse. Science. 1990;247:322–324. doi: 10.1126/science.2296722. [DOI] [PubMed] [Google Scholar]
- 11.Mehl KA, Davis JM, Berger FG, Carson JA. Myofiber degeneration/regeneration is induced in the cachectic Apc(Min/+) mouse. J Appl Physiol. 2005;99:2379–2387. doi: 10.1152/japplphysiol.00778.2005. [DOI] [PubMed] [Google Scholar]
- 12.Puppa MJ, et al. Gut barrier dysfunction in the ApcMin/+ mouse model of colon cancer cachexia. Bba-Mol Basis Dis. 2011;1812:1601–1606. doi: 10.1016/j.bbadis.2011.08.010. [DOI] [PMC free article] [PubMed] [Google Scholar]
- 13.Kim JC, et al. Linking genetically defined neurons to behavior through a broadly applicable silencing allele. Neuron. 2009;63:305–315. doi: 10.1016/j.neuron.2009.07.010. [DOI] [PMC free article] [PubMed] [Google Scholar]
- 14.Davis M, Walker DL, Miles L, Grillon C. Phasic vs sustained fear in rats and humans: role of the extended amygdala in fear vs anxiety. Neuropsychopharmacology. 2010;35:105–135. doi: 10.1038/npp.2009.109. [DOI] [PMC free article] [PubMed] [Google Scholar]
- 15.Neugebauer V, Li W, Bird GC, Han JS. The amygdala and persistent pain. Neuroscientist. 2004;10:221–234. doi: 10.1177/1073858403261077. [DOI] [PubMed] [Google Scholar]
- 16.Fearon K, Arends J, Baracos V. Understanding the mechanisms and treatment options in cancer cachexia. Nat Rev Clin Oncol. 2013;10:90–99. doi: 10.1038/nrclinonc.2012.209. [DOI] [PubMed] [Google Scholar]
- 17.Kir S, et al. Tumour-derived PTH-related protein triggers adipose tissue browning and cancer cachexia. Nature. 2014;513:100–104. doi: 10.1038/nature13528. [DOI] [PMC free article] [PubMed] [Google Scholar]
- 18.Brooks SL, Neville AM, Rothwell NJ, Stock MJ, Wilson S. Sympathetic activation of brown-adipose-tissue thermogenesis in cachexia. Biosci Rep. 1981;1:509–517. doi: 10.1007/BF01121584. [DOI] [PubMed] [Google Scholar]
- 19.Tucker JA, et al. Response to 5-fluorouracil chemotherapy is modified by dietary folic acid deficiency in Apc(Min/+) mice. Cancer Lett. 2002;187:153–162. doi: 10.1016/s0304-3835(02)00402-0. [DOI] [PubMed] [Google Scholar]
- 20.Grossberg AJ, et al. Inflammation-Induced Lethargy Is Mediated by Suppression of Orexin Neuron Activity. J Neurosci. 2011;31:11376–11386. doi: 10.1523/JNEUROSCI.2311-11.2011. [DOI] [PMC free article] [PubMed] [Google Scholar]
- 21.Gaskill BN, Karas AZ, Garner JP, Pritchett-Corning KR. Nest Building as an Indicator of Health and Welfare in Laboratory Mice. J Jove-J Vis Exp. 2013 doi: 10.3791/51012. [DOI] [PMC free article] [PubMed] [Google Scholar]
- 22.Szczypka MS, et al. Dopamine production in the caudate putamen restores feeding in dopamine-deficient mice. Neuron. 2001;30:819–828. doi: 10.1016/s0896-6273(01)00319-1. [DOI] [PubMed] [Google Scholar]
- 23.Morton GJ, Meek TH, Schwartz MW. Neurobiology of food intake in health and disease. Nat Rev Neurosci. 2014;15:367–378. doi: 10.1038/nrn3745. [DOI] [PMC free article] [PubMed] [Google Scholar]
- 24.Aponte Y, Atasoy D, Sternson SM. AGRP neurons are sufficient to orchestrate feeding behavior rapidly and without training. Nat Neurosci. 2011;14:351–355. doi: 10.1038/nn.2739. [DOI] [PMC free article] [PubMed] [Google Scholar]
- 25.Krashes MJ, et al. Rapid, reversible activation of AgRP neurons drives feeding behavior in mice. J Clin Invest. 2011;121:1424–1428. doi: 10.1172/JCI46229. [DOI] [PMC free article] [PubMed] [Google Scholar]
- 26.Atasoy D, Betley JN, Su HH, Sternson SM. Deconstruction of a neural circuit for hunger. Nature. 2012;488:172–177. doi: 10.1038/nature11270. [DOI] [PMC free article] [PubMed] [Google Scholar]
- 27.Bing C, Taylor S, Tisdale MJ, Williams G. Cachexia in MAC16 adenocarcinoma: suppression of hunger despite normal regulation of leptin, insulin and hypothalamic neuropeptide Y. J Neurochem. 2001;79:1004–1012. doi: 10.1046/j.1471-4159.2001.00639.x. [DOI] [PubMed] [Google Scholar]
- 28.Shimizu Y, et al. Increased plasma ghrelin level in lung cancer cachexia. Clin Cancer Res. 2003;9:774–778. [PubMed] [Google Scholar]
- 29.Grossberg AJ, et al. Arcuate nucleus proopiomelanocortin neurons mediate the acute anorectic actions of leukemia inhibitory factor via gp130. Endocrinology. 2010;151:606–616. doi: 10.1210/en.2009-1135. [DOI] [PMC free article] [PubMed] [Google Scholar]
- 30.Scarlett JM, et al. Regulation of central melanocortin signaling by interleukin-1 beta. Endocrinology. 2007;148:4217–4225. doi: 10.1210/en.2007-0017. [DOI] [PubMed] [Google Scholar]
- 31.Shutter JR, et al. Hypothalamic expression of ART, a novel gene related to agouti, is up-regulated in obese and diabetic mutant mice. Genes Dev. 1997;11:593–602. doi: 10.1101/gad.11.5.593. [DOI] [PubMed] [Google Scholar]
- 32.Wisse BE, Frayo RS, Schwartz MW, Cummings DE. Reversal of cancer anorexia by blockade of central melanocortin receptors in rats. Endocrinology. 2001;142:3292–3301. doi: 10.1210/endo.142.8.8324. [DOI] [PubMed] [Google Scholar]
- 33.Marks DL, Ling N, Cone RD. Role of the central melanocortin system in cachexia. Cancer Res. 2001;61:1432–1438. [PubMed] [Google Scholar]
- 34.Paues J, Mackerlova L, Blomqvist A. Expression of melanocortin-4 receptor by rat parabrachial neurons responsive to immune and aversive stimuli. Neuroscience. 2006;141:287–297. doi: 10.1016/j.neuroscience.2006.03.041. [DOI] [PubMed] [Google Scholar]
- 35.Chance WT, Sheriff S, Dayal R, Balasubramaniam A. Refractory hypothalamic alpha-mSH satiety and AGRP feeding systems in rats bearing MCA sarcomas. Peptides. 2003;24:1909–1919. doi: 10.1016/j.peptides.2003.09.019. [DOI] [PubMed] [Google Scholar]
- 36.Wisse BE, Schwartz MW, Cummings DE. Melanocortin signaling and anorexia in chronic disease states. Ann NY Acad Sci. 2003;994:275–281. doi: 10.1111/j.1749-6632.2003.tb03190.x. [DOI] [PubMed] [Google Scholar]
- 37.Hashimoto H, et al. Parathyroid hormone-related protein induces cachectic syndromes without directly modulating the expression of hypothalamic feeding-regulating peptides. Clinical Cancer Research. 2007;13:292–298. doi: 10.1158/1078-0432.CCR-06-1487. [DOI] [PubMed] [Google Scholar]
- 38.Suzuki H, et al. Similar changes of hypothalamic feeding-regulating peptides mRNAs and plasma leptin levels in PTHrP-, LIF-secreting tumors-induced cachectic rats and adjuvant arthritic rats. Int J Cancer. 2011;128:2215–2223. doi: 10.1002/ijc.25535. [DOI] [PubMed] [Google Scholar]
- 39.Reyes TM, Sawchenko PE. Involvement of the arcuate nucleus of the hypothalamus in interleukin-1-induced anorexia. J Neurosci. 2002;22:5091–5099. doi: 10.1523/JNEUROSCI.22-12-05091.2002. [DOI] [PMC free article] [PubMed] [Google Scholar]
- 40.Liu Y, et al. Lipopolysacharide Rapidly and Completely Suppresses AgRP Neuron-Mediated Food Intake in Male Mice. Endocrinology. 2016;157:2380–2392. doi: 10.1210/en.2015-2081. [DOI] [PMC free article] [PubMed] [Google Scholar]
- 41.Sah P, Faber ES, Lopez De Armentia M, Power J. The amygdaloid complex: anatomy and physiology. Physiol Rev. 2003;83:803–834. doi: 10.1152/physrev.00002.2003. [DOI] [PubMed] [Google Scholar]
- 42.Nixon DW, et al. Hyperalimentation of the cancer patient with protein-calorie undernutrition. Cancer Res. 1981;41:2038–2045. [PubMed] [Google Scholar]
- 43.Mann M, et al. Glucocorticoidlike activity of megestrol A summary of Food and Drug Administration experience and a review of the literature. Arch Intern Med. 1997;157:1651–1656. doi: 10.1001/archinte.157.15.1651. [DOI] [PubMed] [Google Scholar]
- 44.Simons JP, et al. Effects of medroxyprogesterone acetate on food intake, body composition, and resting energy expenditure in patients with advanced, nonhormone-sensitive cancer: a randomized, placebo-controlled trial. Cancer. 1998;82:553–560. [PubMed] [Google Scholar]
- 45.Schakman O, Kalista S, Barbe C, Loumaye A, Thissen JP. Glucocorticoid-induced skeletal muscle atrophy. Int J Biochem Cell Biol. 2013;45:2163–2172. doi: 10.1016/j.biocel.2013.05.036. [DOI] [PubMed] [Google Scholar]
- 46.Alhadeff AL, Holland RA, Nelson A, Grill HJ, De Jonghe BC. Glutamate Rceptors in the Central Nucleus of the Amygdala Mediate Cisplatin-Induced Malaise and Energy Balance Dysregulation through Direct Hindbrain Projections. J Neurosci. 2015;35:11094–11104. doi: 10.1523/JNEUROSCI.0440-15.2015. [DOI] [PMC free article] [PubMed] [Google Scholar]
- 47.Saper CB. The House Alarm. Cell Metab. 2016;23:754–755. doi: 10.1016/j.cmet.2016.04.021. [DOI] [PubMed] [Google Scholar]
- 48.Yamamoto Y, et al. Changes in behavior and gene expression induced by caloric restriction in C57BL/6 mice. Physiol Genomics. 2009;39:227–235. doi: 10.1152/physiolgenomics.00082.2009. [DOI] [PubMed] [Google Scholar]
- 49.Dietrich MO, Zimmer MR, Bober J, Horvath TL. Hypothalamic Agrp neurons drive stereotypic behaviors beyond feeding. Cell. 2015;160:1222–1232. doi: 10.1016/j.cell.2015.02.024. [DOI] [PMC free article] [PubMed] [Google Scholar]
- 50.Padilla SL, et al. Agouti-related peptide neural circuits mediate adaptive behaviors in the starved state. Nat Neurosci. 2016;19:734–741. doi: 10.1038/nn.4274. [DOI] [PMC free article] [PubMed] [Google Scholar]
- 51.Taicher GZ, Tinsley FC, Reiderman A, Heiman ML. Quantitative magnetic resonance (QMR) method for bone and whole-body-composition analysis. Anal Bioanal Chem. 2003;377:990–1002. doi: 10.1007/s00216-003-2224-3. [DOI] [PubMed] [Google Scholar]
- 52.Kaiyala KJ, et al. Acutely Decreased Thermoregulatory Energy Expenditure or Decreased Activity Energy Expenditure Both Acutely Reduce Food Intake in Mice. PloS One. 2012;7 doi: 10.1371/journal.pone.0041473. [DOI] [PMC free article] [PubMed] [Google Scholar]
- 53.Weir JBD. New Methods for Calculating Metabolic Rate with Special Reference to Protein Metabolism. J Physiol-London. 1949;109:1–9. doi: 10.1113/jphysiol.1949.sp004363. [DOI] [PMC free article] [PubMed] [Google Scholar]
- 54.Butler AA, Kozak LP. A Recurring Problem With the Analysis of Energy Expenditure in Genetic Models Expressing Lean and Obese Phenotypes. Diabetes. 2010;59:323–329. doi: 10.2337/db09-1471. [DOI] [PMC free article] [PubMed] [Google Scholar]
- 55.Kaiyala KJ, et al. Identification of Body Fat Mass as a Major Determinant of Metabolic Rate in Mice. Diabetes. 2010;59:1657–1666. doi: 10.2337/db09-1582. [DOI] [PMC free article] [PubMed] [Google Scholar]
- 56.Han S, Tai C, Jones CJ, Scheuer T, Catterall WA. Enhancement of Inhibitory Neurotransmission by GABA(A) Receptors Having alpha(2,3)-Subunits Ameliorates Behavioral Deficits in a Mouse Model of Autism. Neuron. 2014;81:1282–1289. doi: 10.1016/j.neuron.2014.01.016. [DOI] [PMC free article] [PubMed] [Google Scholar]
- 57.Deacon RM. Assessing nest building in mice. Nat Protoc. 2006;1:1117–1119. doi: 10.1038/nprot.2006.170. [DOI] [PubMed] [Google Scholar]
- 58.Dong HW. Allen reference atlas : a digital color brain atlas of the C57Black/6J male mouse. Wiley; Hoboken, N.J.: 2008. [Google Scholar]
Associated Data
This section collects any data citations, data availability statements, or supplementary materials included in this article.