

Abstract
Studies have shown that single-nucleotide polymorphisms in MDM2 gene may play important roles in the development of malignant tumor. The association of del1518 polymorphism (rs3730485) in the MDM2 promoter with cancer susceptibility has been extensively studied; however, the results are contradictory. To quantify the association between this polymorphism and overall cancer risk, we conducted a meta-analysis with 12,905 cases and 10,026 controls from 16 eligible studies retrieved from PubMed, Embase, and Chinese Biomedical (CBM) databases. We assessed the strength of the connection using odds ratios (ORs) and 95% confidence intervals (CIs). In summary, no significant associations were discovered between the del1518 polymorphism and overall cancer risk (Del/Del vs Ins/Ins: OR =1.01, 95% CI =0.90–1.14; Ins/Del vs Ins/Ins: OR =1.03, 95% CI =0.96–1.12; recessive model: OR =0.98, 95% CI =0.90–1.07; dominant model: OR =1.03, 95% CI =0.94–1.12; and Del vs Ins: OR =1.01, 95% CI =0.94–1.07). In the stratified analysis by source of control, quality score, cancer type, and ethnicity, no significant associations were found. Despite some limitations, the current meta-analysis provides solid statistical evidence of lacking association between the MDM2 del1518 polymorphism and cancer risk.
Keywords: MDM2, del1518, polymorphism, cancer susceptibility, meta-analysis
Introduction
Worldwide cancer incidence and mortality continues to increase greatly. More than 14.1 million cancer cases and 8.2 million cancer-associated deaths were reported by the latest GLOBOCAN estimates. The burden of cancer has become a serious global problem, particularly in economically developing countries, on account of aging society, smoking, nutritional status, obesity, and physical inactivity. Despite restriction on tobacco use, advocation on vaccination, early diagnosis, and treatment that can prevent cancer mortality effectively, the causes of cancer are still far from clear.1 According to molecular epidemiological researches, genetic polymorphisms have been implicated in diverse carcinogenesis mechanisms.2,3
p53, a tumor suppressor protein, is implicated in almost half of all human cancer. In response of genotoxic stress and oncogenic signals, p53 actives a transcriptional program to induce several cellular damage responses, including apoptosis, cell cycle halt, and autophagy.4,5 In certain cases, p53 activity is depressed by the overexpression of MDM2, a cellular antagonist. MDM2 acts as a major node in the P53 pathway. The MDM2 is an ubiquitin ligase E3 for p53, which promotes the degradation of P53 by the proteasome. There is a negative feedback loop between P53 and MDM2, in which activating p53 protein increases MDM2 transcription, and the resulting MDM2 protein interacts with p53, thereby causing p53 degradation.6 Previous reports have clearly shown that polymorphisms associate with diseases susceptibility by altering affected proteins structurally and functionally. Human MDM2 gene is located on chromosome 12q14.3–q15.1, which contains two promoters, an upstream constitutive promoter (P1) and an internal promoter (P2).7,8 The genetic variations within either of promoters may alter the expression of MDM2. For instance, MDM2 SNP309 (rs2279744, T>G) within promoter P2 enhances the affinity of promoter with the transcriptional activator SP1 to increase MDM2 transcription, thereby promoting tumor development in the different tissues.9 In addition, a del1518 polymorphism (rs3730485), a 40 bp insertion/deletion in the MDM2 promoter P1 region, could also affect promoter activity.10 Recently, several lines of evidence have indicated that the del1518 del-allele contributes to an increase in cancer risk;11–13 however, opposite results were also reported.14,15 To explore the precise correlation between del1518 polymorphism and cancer risk, we performed this meta-analysis with all eligible publications.
Methods
Publication search
All possible publications related the association between MDM2 del1518 polymorphism and cancer risk were searched for from PubMed and Embase (up to March 29, 2017). The following items were used: “MDM2 or mouse double minute 2 homolog or human homolog of mouse double minute 2”, “del1518 or rs3730485”, “polymorphism or single-nucleotide polymorphism (SNP) or variant”, and “tumor or cancer or carcinoma or neoplasm”. The reference lists of all eligible studies in the initial search were searched manually to retrieve potentially relevant studies. To broaden our search to find the most relevant research, we also retrieved publications from Chinese Biomedical (CBM) database with items of “MDM2” and “cancer” in Chinese.
Inclusion/exclusion criteria
Studies selected had to meet the following inclusion criteria: 1) evaluating the association between MDM2 del1518 polymorphism and cancer risk, 2) case–control studies, 3) supplying detailed genotype distribution data to estimate the odds ratio (OR) with 95% confidence interval (CI), and 4) published in English or Chinese. Only the latest study was selected from duplicate publications. In addition, studies with genotype frequency distribution of controls departed from Hardy–Weinberg equilibrium (HWE) were excluded from the final analysis.
Data extraction
Information was extracted from studies by two authors (WH and AZ) independently. If two authors had disagreement, a third author would join in the discussion. A final decision would be made by voting. The following information was collected from each study: first author’s surname, year of publication, country of origin, ethnicity, cancer type, control source, total number of cases and controls, genotype methods, percent of males, and numbers of cases and controls with the Ins/Ins, Ins/Del, and Del/Del genotypes for del1518 polymorphism. The subgroup analysis was carried out by ethnicity (Asians and Caucasians), source of control (hospital based [HB] and population based [PB]), and cancer type. Cancer type investigated in only one study was classified into the “others” group.
Statistical methods
Consistency with HWE in the control group was evaluated by Pearson’s goodness-of-fit χ2 test for each study (P<0.05 was considered as statistically significant deviation from HWE). OR and 95% CI were used to assess the strength of the association between the del1518 polymorphism and cancer risk. Pooled risk estimates were calculated under the alleles contrast (Del vs Ins), homozygous (Del/Del vs Ins/Ins), heterozygous (Ins/Del vs Ins/Ins), dominant (Ins/Del and Del/Del vs Ins/Ins), and recessive (Del/Del vs Ins/Del and Ins/Ins) model. We used the chi square-based Q-test to determine the heterogeneity among studies. A P-value of <0.1 means significant heterogeneity. Under such circumstances, the random-effects model would be taken to assess the pooled ORs; otherwise, the fixed-effects would be adopted.16–18 The quality assessment was also performed using the quality assessment criteria (Table S1) as described previously.19 All studies were scored from 0 to 15, and only studies with a score of ≥12 were regarded as high quality. Subgroup analysis was conducted by cancer type, source of control, quality score, and race. Begg’s funnel plots and Egger’s test were used to assess publication bias. The accuracy and reliability of results were verified by sensitivity analysis by sequentially removing one single study at a time to check the influence of deleted study on pooled ORs. All the statistical tests were conducted by STATA Version 11.0 (StataCorp LP, College Station, TX, USA). P<0.05 indicated statistical significance.
Results
Study characteristics
As shown in Figure 1, a total of 14 articles were retrieved from the initial literature search. After careful examination and assessment, three publications were excluded for the following reasons: one had duplicate data with the previous research20 and other two were irrelevant with cancer risk.21,22 All studies were in agreement with HWE, except for an article by Jin et al.11 We included this article for the further study because genotype distribution of the TP53 Arg72 Pro polymorphism was in accordance with HWE in the same study.11 Of these 11 publications, two publications involved two cancer types14,23 and one publication involved four cancer types.24 We divided these articles into different independent studies based on cancer type. And, the controls of these three publications were included into meta-analysis only once. Main characteristics of each study are summarized in Table 1. Totally, there were 12,905 cases ranging from 132 to 2,501 and 10,026 controls ranging from 132 to 3,749 included in the present meta-analysis. Three studies were conducted on esophageal squamous cell carcinoma,14,15,25 two studies were conducted on breast,24,26 colorectal,11,24 ovarian cancer,23,27 and lung,24,28 and five studies were conducted on “others”, such as gastric cardiac adenocarcinoma,14 hepatocellular carcinoma,12 uterine leiomyoma,13 prostate cancer,24 and endometrial cancer.23 Twelve studies were PB,11–14,24–26,28 and four studies were HB.15,23,27 Moreover, there were seven studies performed among Caucasians13,23,24 and nine studies among Asians.11,12,14,15,25–28 In addition, quality scores of seven studies were <12 and scores of the remaining studies were ≥12.
Figure 1.
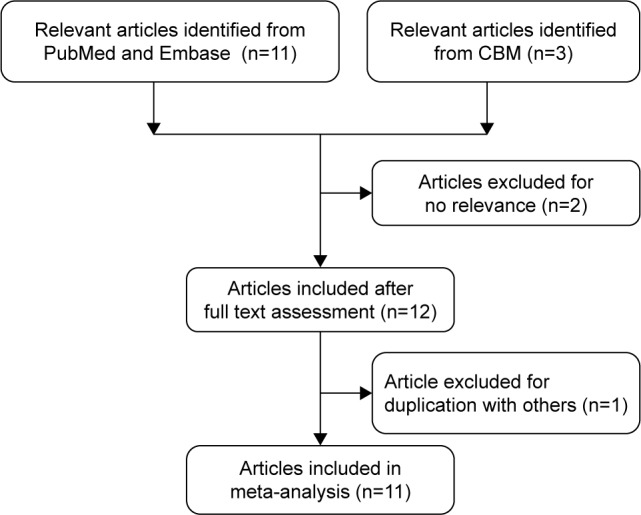
Flowchart of selection of studies included in the current meta-analysis for the correlation between MDM2 del1518 polymorphism and overall cancer susceptibility.
Abbreviation: CBM, Chinese Biomedical.
Table 1.
Characteristics of studies included in the current meta-analysis
| Surname | Year | Cancer type | Country | Ethnicity | Design | Genotype method | Males (%), case/control | Case
|
Control
|
MAF | HWE | Score | ||||||
|---|---|---|---|---|---|---|---|---|---|---|---|---|---|---|---|---|---|---|
| II | ID | DD | All | II | ID | DD | All | |||||||||||
| Hu | 2006 | Lung | China | Asian | PB | PCR | 73.5/72.7 | 349 | 317 | 51 | 717 | 523 | 464 | 96 | 1,083 | 0.30 | 0.631 | 13 |
| Ma | 2006 | Breast | China | Asian | PB | PCR | 0.0/0.0 | 179 | 157 | 30 | 366 | 305 | 241 | 59 | 605 | 0.30 | 0.263 | 9 |
| Cao | 2007 | ESCC | China | Asian | PB | PCR | 67.2/64.6 | 181 | 146 | 24 | 351 | 310 | 285 | 47 | 642 | 0.30 | 0.090 | 11 |
| Cao | 2007 | Gastric | China | Asian | PB | PCR | 63.2/64.6 | 132 | 72 | 8 | 212 | 310 | 285 | 47 | 642 | 0.30 | 0.090 | 11 |
| Jin | 2008 | Colorectal | China | Asian | PB | PCR | NA/NA | 25 | 80 | 95 | 200 | 182 | 319 | 339 | 840 | 0.59 | <0.001 | 12 |
| Kang | 2009 | Ovarian | China | Asian | HB | PCR | 0.0/0.0 | 132 | 106 | 19 | 257 | 122 | 115 | 20 | 257 | 0.30 | 0.318 | 9 |
| Dong | 2012 | HCC | China | Asian | PB | PCR | 65.7/65.0 | 169 | 199 | 52 | 420 | 206 | 178 | 39 | 423 | 0.30 | 0.951 | 12 |
| Ma | 2012 | ESCC | China | Asian | PB | PCR | 55.8/55.8 | 120 | 91 | 15 | 226 | 118 | 92 | 16 | 226 | 0.27 | 0.736 | 10 |
| Salimi | 2015 | UL | Iran | Caucasian | PB | PCR | 0.0/0.0 | 71 | 60 | 23 | 154 | 119 | 64 | 14 | 197 | 0.23 | 0.195 | 9 |
| Zhang | 2015 | ESCC | China | Asian | HB | PCR | 50.8/56.1 | 17 | 59 | 56 | 132 | 13 | 48 | 71 | 132 | 0.72 | 0.257 | 9 |
| Gansmo | 2016 | Colorectal | Norway | Caucasian | PB | PCR | 49.2/50.1 | 478 | 775 | 279 | 1,532 | 1,285 | 1,777 | 687 | 3,749 | 0.42 | 0.095 | 12 |
| Gansmo | 2016 | Lung | Norway | Caucasian | PB | PCR | 62.7/50.1 | 447 | 624 | 260 | 1,331 | 1,285 | 1,777 | 687 | 3,749 | 0.42 | 0.095 | 12 |
| Gansmo | 2016 | Breast | Norway | Caucasian | PB | PCR | 0.0/0.0 | 581 | 809 | 327 | 1,717 | 1,285 | 1,777 | 687 | 3,749 | 0.42 | 0.095 | 12 |
| Gansmo | 2016 | Prostate | Norway | Caucasian | PB | PCR | 100.0/100.0 | 836 | 1,240 | 425 | 2,501 | 1,285 | 1,777 | 687 | 3,749 | 0.42 | 0.095 | 12 |
| Gansmo | 2017 | Ovarian | Norway | Caucasian | HB | PCR | 0.0/0.0 | 484 | 655 | 246 | 1,385 | 636 | 877 | 359 | 1,872 | 0.43 | 0.069 | 12 |
| Gansmo | 2017 | Endometrial | Norway | Caucasian | HB | PCR | 0.0/0.0 | 492 | 664 | 248 | 1,404 | 636 | 877 | 359 | 1,872 | 0.43 | 0.069 | 12 |
Abbreviations: HB, hospital based; HCC, hepatocellular carcinoma; HWE, Hardy–Weinberg equilibrium; ESCC, esophageal squamous cell carcinoma; MAF, minor allele frequency; NA, not available; PB, population based; PCR, polymerase chain reaction; UL, uterine leiomyoma; II, Ins/Ins; DD, Del/Del; ID, Ins/Del.
Meta-analysis results
The results for the association between del1518 del/ins polymorphism and cancer risk are shown in Table 2 and Figure 2. Overall, the pooled risk estimates suggested that no statistically significant association was found between the polymorphism and cancer risk (Del/Del vs Ins/Ins: OR =1.01, 95% CI =0.90–1.14; Ins/Del vs Ins/Ins: OR =1.03, 95% CI =0.96–1.12; Del/Del vs Ins/Del + Ins/Ins: OR =0.98, 95% CI =0.90–1.07; Ins/Del + Del/Del vs Ins/Ins: OR =1.03, 95% CI =0.94–1.12; Del vs Ins: OR =1.01, 95% CI =0.94–1.07). Moreover, the stratified analysis by source of control, quality score, cancer type, and ethnicity showed no evidence of the association between del1518 polymorphism and overall cancer risk.
Table 2.
Meta-analysis of the association between MDM2 del1518 (rs3730485) polymorphism and overall cancer risk
| Variables | Number of studies | Homozygous
|
Heterozygous
|
Recessive
|
Dominant
|
Allele
|
|||||
|---|---|---|---|---|---|---|---|---|---|---|---|
| DD vs II
|
ID vs II
|
DD vs ID + II
|
ID + DD vs II
|
D vs I
|
|||||||
| OR (95% CI) | Phet | OR (95% CI) | Phet | OR (95% CI) | Phet | OR (95% CI) | Phet | OR (95% CI) | Phet | ||
| All | 16 | 1.01 (0.90–1.14) | 0.003 | 1.03 (0.96–1.12) | 0.009 | 0.98 (0.90–1.07) | 0.049 | 1.03 (0.94–1.12) | <0.001 | 1.01 (0.94–1.07) | <0.001 |
| Cancer type | |||||||||||
| Lung | 2 | 0.97 (0.72–1.30) | 0.133 | 1.01 (0.90–1.14) | 0.909 | 0.96 (0.71–1.30) | 0.108 | 1.02 (0.91–1.13) | 0.694 | 1.01 (0.94–1.10) | 0.303 |
| Breast | 2 | 1.03 (0.88–1.20) | 0.449 | 1.03 (0.91–1.15) | 0.526 | 1.03 (0.89–1.18) | 0.333 | 1.03 (0.92–1.15) | 0.780 | 1.02 (0.95–1.10) | 0.822 |
| ESCC | 3 | 0.82 (0.56–1.19) | 0.700 | 0.91 (0.74–1.13) | 0.909 | 0.79 (0.58–1.08) | 0.500 | 0.89 (0.73–1.10) | 0.809 | 0.89 (0.76–1.04) | 0.428 |
| Others | 5 | 1.07 (0.78–1.48) | 0.001 | 1.04 (0.84–1.29) | 0.001 | 1.01 (0.79–1.29) | 0.015 | 1.05 (0.83–1.33) | <0.001 | 1.03 (0.86–1.24) | <0.001 |
| Colorectal | 2 | 1.43 (0.78–2.63) | 0.016 | 1.37 (0.91–2.08) | 0.084 | 1.12 (0.84–1.49) | 0.091 | 1.42 (0.86–2.36) | 0.029 | 1.20 (0.91–1.60) | 0.020 |
| Ovarian | 2 | 0.90 (0.74–1.09) | 0.944 | 0.96 (0.83–1.11) | 0.480 | 0.91 (0.77–1.09) | 0.911 | 0.94 (0.82–1.08) | 0.556 | 0.95 (0.86–1.04) | 0.708 |
| Ethnicity | |||||||||||
| Asians | 9 | 0.95 (0.70–1.29) | 0.005 | 1.01 (0.84–1.21) | 0.004 | 0.92 (0.74–1.15) | 0.071 | 0.99 (0.81–1.21) | <0.001 | 0.96 (0.83–1.12) | <0.001 |
| Caucasians | 7 | 1.02 (0.91–1.13) | 0.055 | 1.05 (0.98–1.12) | 0.246 | 0.99 (0.90–1.08) | 0.104 | 1.04 (0.97–1.12) | 0.082 | 1.02 (0.96–1.08) | 0.020 |
| Source of control | |||||||||||
| PB | 12 | 1.07 (0.92–1.24) | 0.002 | 1.06 (0.96–1.17) | 0.003 | 1.02 (0.92–1.14) | 0.048 | 1.06 (0.95–1.18) | <0.001 | 1.04 (0.96–1.12) | <0.001 |
| HB | 4 | 0.89 (0.77–1.02) | 0.822 | 0.97 (0.87–1.07) | 0.911 | 0.89 (0.79–1.00) | 0.570 | 0.94 (0.86–1.04) | 0.859 | 0.94 (0.88–1.00) | 0.517 |
| Quality score | |||||||||||
| ≥12 | 9 | 1.04 (0.92–1.16) | 0.015 | 1.06 (0.99–1.14) | 0.108 | 0.99 (0.92–1.08) | 0.127 | 1.06 (0.98–1.14) | 0.025 | 1.03 (0.97–1.09) | 0.010 |
| <12 | 7 | 0.89 (0.61–1.30) | 0.026 | 0.94 (0.75–1.16) | 0.027 | 0.89 (0.65–1.21) | 0.080 | 0.93 (0.73–1.18) | 0.003 | 0.93 (0.76–1.14) | <0.001 |
| Bias | 0.919 | 0.921 | 0.920 | 0.921 | 0.990 | ||||||
Abbreviations: CI, confidence interval; DD, Del/Del; ESCC, esophageal squamous cell carcinoma; HB, hospital based; het, heterogeneity; ID, Ins/Del; II, Ins/Ins; OR, odds ratio; PB, population based.
Figure 2.

Forest plots of effect estimates for MDM2 del1518 polymorphism and overall cancer susceptibility under dominant model (ID + DD vs II).
Notes: For each study, the estimation of OR and its 95% CI is plotted with a box and a horizontal line. The diamonds represent the pooled ORs and 95% CIs. Weights are from random effects analysis.
Abbreviations: CIs, confidence intervals; ORs, odds ratios; ID, Ins/Del; II, Ins/Ins; DD, Del/Del.
Heterogeneity and sensitivity analysis
As shown in Table 1, significant between-study heterogeneity was observed under the different models (homozygous model: P=0.003; heterozygous model: P=0.009; recessive model: P=0.049; dominant model: P<0.001; and allele comparing: P<0.001); therefore we adopted the random-effects model to generate wider CIs. Sensitivity analysis suggested that ORs were not significantly altered by any single study, indicating that this meta-analysis result was stable and reliable.
Publication bias
The publication bias was performed by Begg’s funnel plot and Egger’s test. We found no asymmetry of funnel plot (Figure 3). In addition, the results of Egger’s test did not suggest any evidence of publications bias (homozygous: P=0.919; heterozygous: P=0.921; recessive model: P=0.920; dominant model: P=0.921; and allele comparing model: P=0.990).
Figure 3.
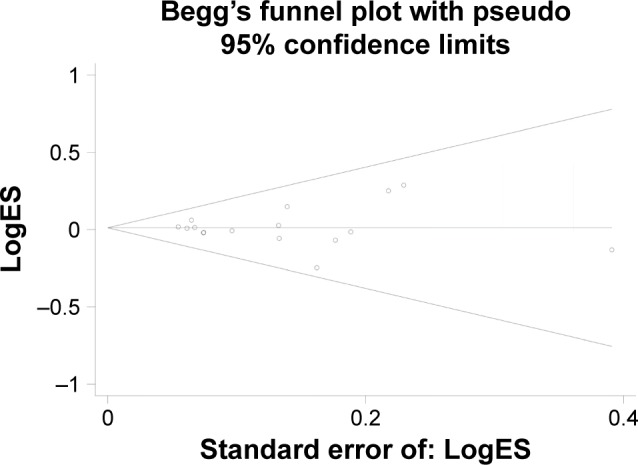
Funnel plot to detect publication bias for MDM2 del1518 polymorphism and overall cancer susceptibility under dominant model.
Note: Each point represents a separate study for the indicated association.
Abbreviation: ES, effect size.
Discussion
The tumor suppressor p53, a transcriptional factor, essentially controls the growth and development of normal cells. p53 instability may lead to cell cycle disorder and aberrant cellular apoptosis, thereby strongly contributing to malignant transformation and progression.29,30 The MDM2 gene, a genomic size of 34 kb, contains two promoters, such as a p53-responsive promoter and a p53-independent promoter.8 MDM2, as a major mechanism of genetic toxicity and carcinogenesis, is a principle regulator of the stabilization of p53 in the no-stress condition.31 MDM2, functioning as an E3 ligase, specifically complexes with p53 by the N-terminus domain and induces its degradation through proteasomal pathway.32,33 The expression of MDM2 is elevated by p53-positive regulation. Given a negative autoregulatory loop between MDM2 and p53, the importance of MDM2 has been proved in the central part of p53-assosiated signal pathway.34,35 Genetic variations, including SNPs and other types of polymorphisms, may modify genetic predisposition to diseases.36 Some genetic alterations located in the MDM2 gene, such as SN309,37 have been proved to be associated with cancer risk.16,38,39 As far as we know, there are at least 4,765 polymorphisms found in the MDM2 gene (http://www.ncbi.nlm.nih.gov/projects/SNP). One of the frequently investigated polymorphisms is MDM2 del1518, a common 40 bp Ins/Del polymorphism, located in constitutive promoter with a putative TATA motif.10,26
Due to the special location of del1518 polymorphism, its association with cancer risk has been a hot spot. Salimi et al suggested that women carrying del allele had an increased risk of uterine leiomyoma compared with the women carrying MDM2 40 bp insert allele.13 Jin et al reported that the 40 bp deletion allele had an important role in the oncogenesis of colorectal cancer, specially for rectal cancer.11 In addition, a genetic association study by Dong et al have found that the del1518 was significantly associated with an increased risk of hepatocellular carcinoma.12 While some studies have considered del1518 del-allele as susceptibility loci for the risk of various cancer types,14,15 other studies failed to confirm its contribution to cancer risk.23–28 The discrepant results might be caused by small sample size, and variations among different study populations. Moreover, it is widely believed that malignancies arising from different tissue had completely distinct molecular mechanisms, and even the same cancer type could display significant heterogeneity among different individuals.
In the current meta-analysis, we combined all eligible investigations comprising 12,905 cases and 10,026 controls from 16 studies on MDM2 del1518 polymorphism. We found no significant association between del1518 polymorphism in the overall analysis and stratification analyses by cancer type, ethnicity, source of control, and scores. A latest meta-analysis conducted by Yu et al found that there was no significant difference between del1518 polymorphism and overall squamous cell carcinoma susceptibility with a total of 309 cases and 1,000 controls from three studies, results of which is consistent with the current study.22
To our knowledge, this investigation is the largest and most comprehensive meta-analysis regarding the association between del1518 polymorphism and all cancer type. However, there were still some limitations to be addressed. First, statistical power might be limited to certain degree, especially for stratified analyses, such as cancer type of gastric, hepatocellular, uterine leiomyoma, prostate, and endometrial. Hence, the results of this meta-analysis should be interpreted with caution. Second, because of the stratification analysis of ethnicity included Asians and Caucasians only, we could not take genetic and geographical differences into consideration. Further analysis should contain diverse area and ethnicities. Third, the results of this study were based on unadjusted estimates by the reason of insufficient data of individual such as age, gender, smoking, environment exposure, and lifestyles. Gene–gene and gene–environment interactions could not be explored. Fourth, there was obvious heterogeneity for the meta-analysis, which might owe to differences in cancer types, the populations, geographical area, and study designs. Finally, the included studies were mainly searched for from PubMed, Embase, and CBM; therefore, publication bias might exist in this meta-analysis for the unavailability of the unpublished studies with negative results.
Conclusion
Our present meta-analysis suggested no association between MDM2 gene del1518 polymorphism and overall cancer susceptibility. Further well-designed study with large sample sizes, different ethnicities, cancer types, and gene–environment interactions is needed to confirm our findings.
Supplementary material
Table S1.
Score of quality assessment
| Criteria | Score |
|---|---|
| Representativeness of cases | |
| Selected from population cancer registry | 2 |
| Selected from hospital | 1 |
| No method of selection described | 0 |
| Representativeness of controls | |
| Population based | 3 |
| Blood donors | 2 |
| Hospital based | 1 |
| Not described | 0 |
| Ascertainment of cancer cases | |
| Histopathologic confirmation | 2 |
| Patient medical record | 1 |
| Not described | 0 |
| Control selection | |
| Controls matched with cases by age and sex | 2 |
| Controls matched with cases only by age or by sex | 1 |
| Not matched or not descried | 0 |
| Genotyping examination | |
| Genotyping done blindly and quality control | 2 |
| Only genotyping done blindly or quality control | 1 |
| Unblinded and without quality control | 0 |
| Total sample size for both cases and controls | |
| >1,000 | 3 |
| >500 but <1,000 | 2 |
| >200 but <500 | 1 |
| <200 | 0 |
Acknowledgments
This study was supported by grants from the introduction of talent scientific research start-up fund of Guangdong Second Provincial General Hospital (YY2016-004), Scientific Research Foundation of Wenzhou (Y20100175), Zhejiang Provincial Medical and Health Science and Technology plan (2013RCA035), Project of Science and Technology Department of Zhejiang Province (2014C37003), and Zhejiang Provincial Natural Science Foundation of China (LY16H160054).
Footnotes
Disclosure
The authors report no conflicts of interest in this work.
References
- 1.Torre LA, Bray F, Siegel RL, Ferlay J, Lortet-Tieulent J, Jemal A. Global cancer statistics, 2012. CA Cancer J Clin. 2015;65(2):87–108. doi: 10.3322/caac.21262. [DOI] [PubMed] [Google Scholar]
- 2.Pharoah PD, Dunning AM, Ponder BA, Easton DF. Association studies for finding cancer-susceptibility genetic variants. Nat Rev Cancer. 2004;4(11):850–860. doi: 10.1038/nrc1476. [DOI] [PubMed] [Google Scholar]
- 3.Xu C, Zhu J, Fu W, et al. MDM4 rs4245739 A > C polymorphism correlates with reduced overall cancer risk in a meta-analysis of 69477 subjects. Oncotarget. 2016;7(44):71718–71726. doi: 10.18632/oncotarget.12326. [DOI] [PMC free article] [PubMed] [Google Scholar]
- 4.Levine AJ. p53, the cellular gatekeeper for growth and division. Cell. 1997;88(3):323–331. doi: 10.1016/s0092-8674(00)81871-1. [DOI] [PubMed] [Google Scholar]
- 5.Levine AJ, Finlay CA, Hinds PW. P53 is a tumor suppressor gene. Cell. 2004;116(suppl 2):S67–S70. doi: 10.1016/s0092-8674(04)00036-4. [DOI] [PubMed] [Google Scholar]
- 6.Michael D, Oren M. The p53 and Mdm2 families in cancer. Curr Opin Genet Dev. 2002;12(1):53–59. doi: 10.1016/s0959-437x(01)00264-7. [DOI] [PubMed] [Google Scholar]
- 7.Barak Y, Gottlieb E, Juvengershon T, Oren M. Regulation of mdm2 expression by p53: alternative promoters produce transcripts with non-identical translation potential. Genes Dev. 1994;8(15):1739–1749. doi: 10.1101/gad.8.15.1739. [DOI] [PubMed] [Google Scholar]
- 8.Zauberman A, Flusberg D, Haupt Y, Barak Y, Oren M. A functional p53-responsive intronic promoter is contained within the human mdm2 gene. Nucleic Acids Res. 1995;23(14):2584. doi: 10.1093/nar/23.14.2584. [DOI] [PMC free article] [PubMed] [Google Scholar]
- 9.Bond GL, Hu W, Bond EE, et al. A single nucleotide polymorphism in the MDM2 promoter attenuates the p53 tumor suppressor pathway and accelerates tumor formation in humans. Cell. 2004;119(5):591–602. doi: 10.1016/j.cell.2004.11.022. [DOI] [PubMed] [Google Scholar]
- 10.Lalonde ME, Ouimet M, Lariviere M, Kritikou EA, Sinnett D. Identification of functional DNA variants in the constitutive promoter region of MDM2. Hum Genomics. 2012;6(1):15. doi: 10.1186/1479-7364-6-15. [DOI] [PMC free article] [PubMed] [Google Scholar]
- 11.Jin MJ, Zhang SS, Zhang YJ, et al. Polymorphisms in P53 pathway genes and colorectal cancer risk. Chin J Dig. 2008;28(10):703–705. [Google Scholar]
- 12.Dong D, Gao X, Zhu Z, Yu Q, Bian S, Gao Y. A 40-bp insertion/deletion polymorphism in the constitutive promoter of MDM2 confers risk for hepatocellular carcinoma in a Chinese population. Gene. 2012;497(1):66–70. doi: 10.1016/j.gene.2012.01.004. [DOI] [PubMed] [Google Scholar]
- 13.Salimi S, Hajizadeh A, Khodamian M, Pejman A, Fazeli K, Yaghmaei M. Age-dependent association of MDM2 promoter polymorphisms and uterine leiomyoma in South-East Iran: a preliminary report. J Obstet Gynaecol Res. 2015;41(5):729–734. doi: 10.1111/jog.12625. [DOI] [PubMed] [Google Scholar]
- 14.Cao YY, Zhang XF, Guo W, Wang R, Ge H, Zhang JH. Association of the MDM2 polymorphisms with susceptibility of esophageal squamous cell carcinoma and that of gastric cardiac adenocarcinoma. Tumor. 2007;27(8):628–632. [Google Scholar]
- 15.Zhang L, Zhu Z, Wu H, Wang K. Association between SNP309 and del1518 polymorphism in MDM2 homologue and esophageal squamous cell carcinoma risk in Chinese population of shandong province. Ann Clin Lab Sci. 2015;45(4):433–437. [PubMed] [Google Scholar]
- 16.He J, Shi TY, Zhu ML, Wang MY, Li QX, Wei QY. Associations of Lys939Gln and Ala499Val polymorphisms of the XPC gene with cancer susceptibility: a meta-analysis. Int J Cancer. 2013;133(8):1765–1775. doi: 10.1002/ijc.28089. [DOI] [PubMed] [Google Scholar]
- 17.He J, Xi B, Ruiter R, et al. Association of LEP G2548A and LEPR Q223R polymorphisms with cancer susceptibility: evidence from a meta-analysis. PLoS One. 2013;8(10):e75135. doi: 10.1371/journal.pone.0075135. [DOI] [PMC free article] [PubMed] [Google Scholar]
- 18.He J, Wang F, Zhu JH, Chen W, Cui Z, Jia WH. No association between MTR rs1805087 A > G polymorphism and non-Hodgkin lymphoma susceptibility: evidence from 11 486 subjects. Leuk Lymphoma. 2015;56(3):763–767. doi: 10.3109/10428194.2014.935370. [DOI] [PubMed] [Google Scholar]
- 19.He J, Liao XY, Zhu JH, et al. Association of MTHFR C677T and A1298C polymorphisms with non-Hodgkin lymphoma susceptibility: evidence from a meta-analysis. Sci Rep. 2014;4:6159. doi: 10.1038/srep06159. [DOI] [PMC free article] [PubMed] [Google Scholar]
- 20.Wang DJ, Li Y, Zhou RM, et al. Association of p73 and MDM2 polymorphisms with the risk of epithelial ovarian cancer. Tumor. 2009;19(4):892–897. doi: 10.1111/IGC.0b013e3181a130ab. [DOI] [PubMed] [Google Scholar]
- 21.Sun P, Zhang Z, Wan J, Zhao N, Jin X, Xia Z. Association of genetic polymorphisms in GADD45A, MDM2, and p14 ARF with the risk of chronic benzene poisoning in a Chinese occupational population. Toxicol Appl Pharmacol. 2009;240(1):66–72. doi: 10.1016/j.taap.2009.07.003. [DOI] [PubMed] [Google Scholar]
- 22.Yu H, Li H, Zhang J, Liu G. Influence of MDM2 polymorphisms on squamous cell carcinoma susceptibility: a meta-analysis. Onco Targets Ther. 2016;9:6211–6224. doi: 10.2147/OTT.S113417. [DOI] [PMC free article] [PubMed] [Google Scholar]
- 23.Gansmo LB, Bjornslett M, Halle MK, et al. MDM2 promoter polymorphism del1518 (rs3730485) and its impact on endometrial and ovarian cancer risk. BMC Cancer. 2017;17(1):97. doi: 10.1186/s12885-017-3094-y. [DOI] [PMC free article] [PubMed] [Google Scholar]
- 24.Gansmo LB, Vatten L, Romundstad P, et al. Associations between the MDM2 promoter P1 polymorphism del1518 (rs3730485) and incidence of cancer of the breast, lung, colon and prostate. Oncotarget. 2016;7(19):28637–28646. doi: 10.18632/oncotarget.8705. [DOI] [PMC free article] [PubMed] [Google Scholar]
- 25.Ma J, Zhang J, Ning T, Chen Z, Xu C. Association of genetic polymorphisms in MDM2, PTEN and P53 with risk of esophageal squamous cell carcinoma. J Hum Genet. 2012;57(4):261–264. doi: 10.1038/jhg.2012.15. [DOI] [PubMed] [Google Scholar]
- 26.Ma H, Hu Z, Zhai X, et al. Polymorphisms in the MDM2 promoter and risk of breast cancer: a case-control analysis in a Chinese population. Cancer Lett. 2006;240(2):261–267. doi: 10.1016/j.canlet.2005.09.019. [DOI] [PubMed] [Google Scholar]
- 27.Kang S, Wang DJ, Li WS, et al. Association of p73 and MDM2 polymorphisms with the risk of epithelial ovarian cancer in Chinese women. Int J Gynecol Cancer. 2009;19(4):572–577. doi: 10.1111/IGC.0b013e3181a130ab. [DOI] [PubMed] [Google Scholar]
- 28.Hu Z, Ma H, Lu D, et al. Genetic variants in the MDM2 promoter and lung cancer risk in a Chinese population. Int J Cancer. 2006;118(5):1275–1278. doi: 10.1002/ijc.21463. [DOI] [PubMed] [Google Scholar]
- 29.Vousden KH, Prives C. Blinded by the light: the growing complexity of p53. Cell. 2009;137(3):413. doi: 10.1016/j.cell.2009.04.037. [DOI] [PubMed] [Google Scholar]
- 30.Ashcroft M, Vousden KH. Regulation of p53 stability. Oncogene. 1999;18(53):7637–7643. doi: 10.1038/sj.onc.1203012. [DOI] [PubMed] [Google Scholar]
- 31.Midgley CA, Lane DP. p53 protein stability in tumour cells is not determined by mutation but is dependent on MDM2 binding. Oncogene. 1997;15(10):1179. doi: 10.1038/sj.onc.1201459. [DOI] [PubMed] [Google Scholar]
- 32.Lain S, Lane D. Improving cancer therapy by non-genotoxic activation of p53. Eur J Cancer. 2003;39(8):1053–1060. doi: 10.1016/s0959-8049(03)00063-7. [DOI] [PubMed] [Google Scholar]
- 33.Lukashchuk N, Vousden KH. Ubiquitination and degradation of mutant p53. Mol Cell Biol. 2007;27(23):8284–8295. doi: 10.1128/MCB.00050-07. [DOI] [PMC free article] [PubMed] [Google Scholar]
- 34.Nag S, Qin J, Srivenugopal KS, Wang M, Zhang R. The MDM2-p53 pathway revisited. J Biomed Res. 2013;27(4):254–271. doi: 10.7555/JBR.27.20130030. [DOI] [PMC free article] [PubMed] [Google Scholar]
- 35.Jin S, Levine AJ. The p53 functional circuit. J Cell Sci. 2001;114(pt 23):4139–4140. doi: 10.1242/jcs.114.23.4139. [DOI] [PubMed] [Google Scholar]
- 36.Engle LJ, Simpson CL, Landers JE. Using high-throughput SNP technologies to study cancer. Oncogene. 2006;25(11):1594–1601. doi: 10.1038/sj.onc.1209368. [DOI] [PubMed] [Google Scholar]
- 37.Wang HG, Wu QY, Zhou H, et al. The MDM2 SNP309T>G polymorphism increases bladder cancer risk among Caucasians: a meta-analysis. Asian Pac J Cancer Prev. 2014;15(13):5277–5281. doi: 10.7314/apjcp.2014.15.13.5277. [DOI] [PubMed] [Google Scholar]
- 38.Zhang Y, Yang D, Zhu JH, Chen MB, Shen WX, He J. The association between NQO1 Pro187Ser polymorphism and urinary system cancer susceptibility: a meta-analysis of 22 studies. Cancer Invest. 2015;33(2):39–40. doi: 10.3109/07357907.2014.998836. [DOI] [PubMed] [Google Scholar]
- 39.Zhang T, Xie S, Zhu JH, Li QW, He J, Zeng AP. Association of IL10 -819C>T and -592C>A polymorphisms with non-Hodgkin lymphoma susceptibility: evidence from published studies. J Cancer. 2015;6(8):709–716. doi: 10.7150/jca.11745. [DOI] [PMC free article] [PubMed] [Google Scholar]
Associated Data
This section collects any data citations, data availability statements, or supplementary materials included in this article.
Supplementary Materials
Table S1.
Score of quality assessment
| Criteria | Score |
|---|---|
| Representativeness of cases | |
| Selected from population cancer registry | 2 |
| Selected from hospital | 1 |
| No method of selection described | 0 |
| Representativeness of controls | |
| Population based | 3 |
| Blood donors | 2 |
| Hospital based | 1 |
| Not described | 0 |
| Ascertainment of cancer cases | |
| Histopathologic confirmation | 2 |
| Patient medical record | 1 |
| Not described | 0 |
| Control selection | |
| Controls matched with cases by age and sex | 2 |
| Controls matched with cases only by age or by sex | 1 |
| Not matched or not descried | 0 |
| Genotyping examination | |
| Genotyping done blindly and quality control | 2 |
| Only genotyping done blindly or quality control | 1 |
| Unblinded and without quality control | 0 |
| Total sample size for both cases and controls | |
| >1,000 | 3 |
| >500 but <1,000 | 2 |
| >200 but <500 | 1 |
| <200 | 0 |