Abstract
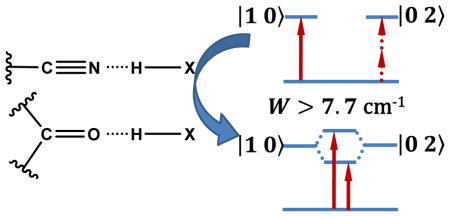
The C=O/C≡N stretching vibration arising from a carbonyl/nitrile functional group in various molecular systems has been frequently used to assess, for example, local hydrogen-bonding interactions, among other applications. However, in practice it is not always easy to ascertain whether the carbonyl or nitrile group in question is engaged in such interactions. Herein, we use 4-cyanoindole and cyclopentanone as models to show that, when a fundamental C=O or C≡N stretching mode is involved in Fermi resonance, the underlying vibrational coupling constant (W) is a convenient reporter of the hydrogen-bonding status of the corresponding carbonyl or nitrile group. Specifically, we find that for both groups a W value of 7.7 cm−1 or greater is indicative of their involvement in hydrogen-bonding interactions. Furthermore, we find that, as observed in similar studies, the Fermi resonance coupling leads to quantum beats in the two-dimensional infrared spectra of 4-cyanoindole in isopropanol, with a period of about 1.9 ps.
Graphical Abstract
INTRODUCTION
Small chemical groups that can be added to an amino acid sidechain have been increasingly used as site-specific infrared (IR) probes of the structure and dynamics of biological molecules.1–3 The most effective probes exhibit a strong, environmentally sensitive, and simple vibrational transition with a frequency located in a uncongested region of the IR spectrum of proteins. Examples include, but are not limited to, –CN, –OCN, –SCN, –SeCN, –N3, –CO, and –COOCH3.4–12 A large body of literature exists, showing how an unnatural amino acid that bears such a vibrational probe can be employed to interrogate a wide range of biochemical and biophysical questions, ranging from protein hydration dynamics13 to electric field changes at the active site of enzymes.14 While several factors can affect the vibrational frequency of these IR probes, a distinct one is hydrogen-bond (HB) formation between the probe in question and its immediate environment. However, in practice it is not always easy and straightforward, or even possible, to tell whether an IR probe is engaged in any hydrogen-bonding (H-bonding) interactions based on its frequency alone.15–17 Herein, we show, using 4-cyanoindole (4-CI) and cyclopentanone (CP) as examples, that for an oscillator exhibiting Fermi resonance, the underlying vibrational coupling constant is a robust and convenient indicator of its H-bonding status.
Fermi resonance18,19 is frequently observed in the vibrational spectra of polyatomic molecules. In contrast to vibrational coupling between two spectrally active fundamental modes, a defining characteristic of Fermi resonance is the sharing of vibrational excitation energy between a (bright) fundamental transition and an overtone or combination mode, which is otherwise dark or has a negligible absorption cross section. According to the treatment of Bertran et al.20 as well as Devendorf et al.21 the frequency gap (Δ) between an observed Fermi resonance doublet is related to the corresponding unperturbed frequency spacing (Δ0) and the anharmonic coupling strength (W) by the equation:
| (1) |
Furthermore, the coupling strength W may be calculated from the experimentally determined spectrum via the following relationship:
| (2) |
where Ia and Ib are the observed peak intensities (or integrated peak areas) of the Fermi resonance doublet. A previous study22 has shown that H-bonding interactions can enhance the coupling strength underlying a Fermi resonance. Specifically, Greve et al. found that, upon increasing the mole fraction of dimethyl sulfoxide (DMSO) in a binary solvent mixture of DMSO and CCl4, the intensity of the (previously dark) NH2 bending overtone mode of d5-aniline, which is coupled to the fundamental N-H symmetric and asymmetric stretching modes of the molecule via Fermi resonance, is increased. They attributed this increase to H-bonding interactions between the amine group of d5-aniline and DMSO. This finding suggests that an oscillator’s Fermi resonance coupling constant (W) could be a useful metric to determine its H-bonding status.
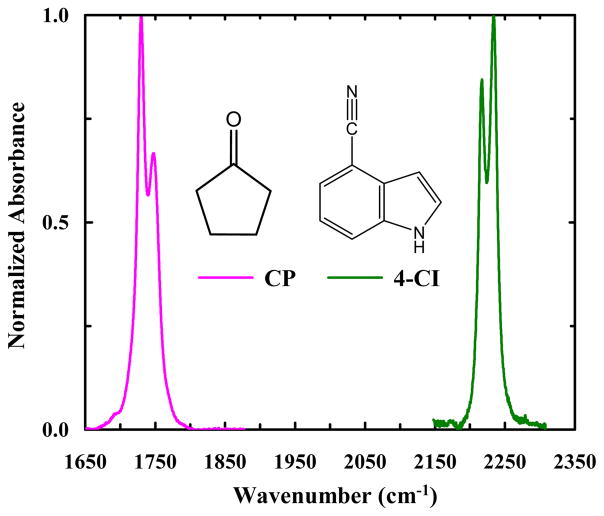
As shown (Figure 1), both 4-CI and CP in isopropanol exhibit two IR bands near the frequency where the respective C≡N or C=O stretching vibrational transition is expected to occur. Previous studies have provided strong evidence indicating that the two IR bands of CP arise from Fermi resonance, due to coupling between the carbonyl stretching fundamental mode and the combination transition of a C-H stretching mode and a ring stretching mode.23 As shown below, the frequencies and relative intensities of the two IR bands of 4-CI are dependent on the choice of solvent, as observed for CP. In addition, two-dimensional IR (2D IR) measurements confirm that these two bands are coupled. Therefore, we conclude that the two IR bands observed in the C≡N stretching vibrational frequency region of 4-CI also result from Fermi resonance. Further evidence supporting this notion comes from ab initio calculations of 4-CI, which show that while there is only one fundamental mode in the nitrile stretching frequency region, this mode (i.e. the nitrile stretching vibration) is likely to be coupled to the overtone transition of a low-frequency mode involving N-H wagging and ring breathing. To test whether Fermi resonance can be used to determine the H-bonding status of a nitrile or carbonyl oscillator, we determine the W values of 4-CI and CP in a series of protic and aprotic solvents. Indeed, we find that for both 4-CI and CP, a W value greater than 7.7 cm−1 is indicative of H-bonding interactions.
Figure 1.
FTIR spectra of CP (pink) and 4-CI (green) in isopropanol, showing the respective vibrational transitions in the C=O and C≡N stretching frequency region.
EXPERIMENTAL DETAILS
Materials and Sample Preparation
All chemicals were used without further purification: 4-cyanoindole (Aldrich, 97%), cyclopentanone (Acros, 99+%), dimethyl sulfoxide (DMSO, Fisher, 99.9%), N, N-dimethylformamide (DMF, Acros, 99.8%), pyridine (Aldrich, 99+%), tetrahydrofuran (THF, Fisher, 99.9%), toluene (Acros, 99.8%), 1,4-dioxane (Acros, 99%), dichloromethane (DCM, Fisher, 99.9%), methanol (Acros, 99.8%), ethanol (Decon Labs, 200 proof), isopropanol (Acros, 99.8%), butanol (EMD Millipore, 99.0%), 2,2,2-trifluoroethanol (TFE, Chem-Impex, 99%), acetic acid (Fisher, glacial), deuterated methanol (Cambridge Isotope, 99 atom % D), and 2,2,2-trifluoroethanol-d1 (Aldrich, 99 atom % D). For FTIR measurements, the solute concentration was about 20 mM, whereas for time-resolved IR experiments the concentration was increased to approximately 300 mM. For all IR measurements, the sample was placed between two 2 mm thick CaF2 windows separated by a 56 μm Teflon spacer.
Static and Time-Resolved IR Measurements
FTIR spectra were collected on a Nicolet iS50 FTIR spectrometer at a resolution of 1 cm−1. For each spectrum, a solvent background was first subtracted and then the resultant data (in the C=O or C≡N stretching frequency region) were fit to two pseudo-Voigt functions, each with a fixed mixing parameter of 0.5. The fitting parameters (i.e., peak frequency and band area) were used to determine Δ and R, which were further used to calculate Δ0 and W via Eqs. (1) and (2). 2D IR spectra were collected on a photon-echo setup with a boxcar geometry, the details of which have been described in detail elsewhere.24 IR transient kinetics were obtained on a home-built, 1 kHz pump-probe apparatus, where the pump pulse (3 μJ) and probe pulse (0.2 μJ) were derived from the same mid-IR pulse (~120 fs and ~150 cm−1 bandwidth) with a center frequency of 2230 cm−1 (1740 cm−1) for 4-CI (CP). After spatial overlap of the pump and probe pulses in the sample, the relative time delay between which was controlled by an optical delay line, the probe beam was directed to a monochromator and dispersed onto a 32 channel mercury cadmium telluride (MCT) array detector (Infrared Systems Development, Winter Park, FL).
Computational Methods
Anharmonic vibrational frequencies for 4-cyanoindole were calculated using Gaussian 09 at the using the hybrid density functional B3LYP and 6–31+(d,p) orbital basis set.25
RESULTS AND DISCUSSION
Dependence of the Fermi resonance doublet of CP on solvent
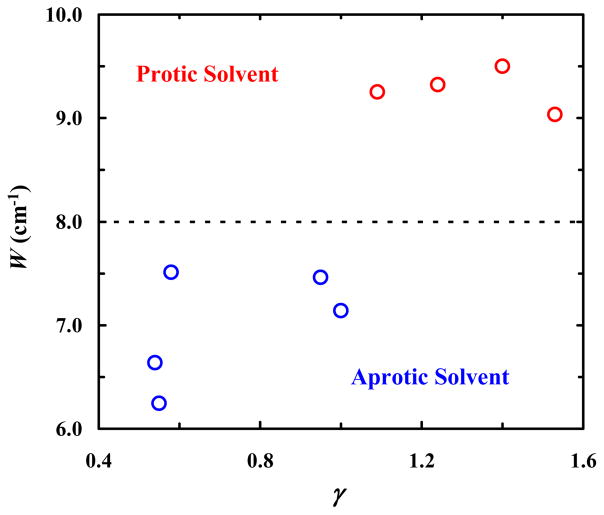
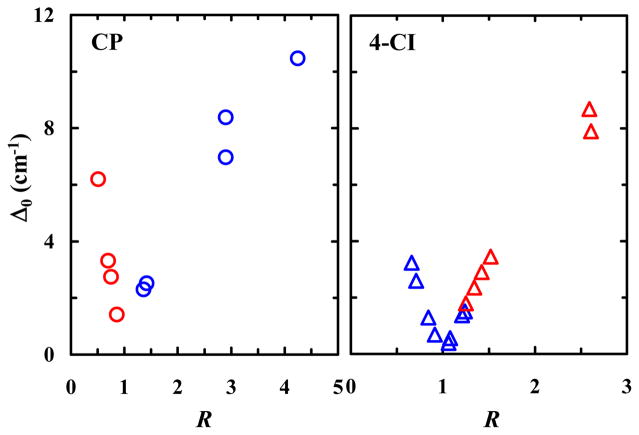
As observed in isopropanol (Figure 1), the FTIR spectra of CP in other solvents also exhibit two peaks in the carbonyl stretching frequency region (Figure S1 in SI). Several previous studies23,26,27 have argued that this IR doublet is a result of Fermi resonance. In support of this assessment, our 2D IR measurements (see Figure S2 in SI) show that these two peaks are indeed coupled. Therefore, we directly applied Eqs. (1) and (2) to extract the underlying Fermi resonance parameters Δ0 and W for every solvent. As indicated (Table 1), consistent with the study of Greve et al.,22 the coupling constant W obtained in protic solvents is larger than that in aprotic solvents, which signifies the effect of H-bonding interactions between the carbonyl group and solvent molecules. To facilitate a better visualization of this H-bonding effect, we plot W as a function of γ, where γ = π* + α with π* and α being the Kamlet-Taft parameters28 that manifest a solvent’s polarizability and HB donating ability, respectively. As indicated (Figure 2), the resultant plot clearly shows that there is a distinct separation between the effects of protic and aprotic solvents, with all protic solvent grouped above a threshold of W ≈ 7.7 cm−1. This result suggests that the Fermi resonance coupling constant is a convenient metric to directly assess the H-bonding status of the carbonyl group in CP. In addition, the calculated unperturbed frequency spacing (Δ0) exhibits a V-shaped dependence on the intensity ratio (R) with minimum at R = 1 (Figure 3); this is in agreement with the result of Bertran et al.20 and indicative of a crossover in frequency (between the fundamental and overtone modes) as the carbonyl fundamental mode is red-shifted due to H-bonding interactions.
Table 1.
Spectral parameters of CP in different solvents, arranged in order of increasing R value.
| Solvent | ω1, cm−1 | ω2, cm−1 | Δ, cm−1 | R | W, cm−1 | Δ0, cm−1 |
|---|---|---|---|---|---|---|
| Methanol | 1747.9 | 1728.8 | 19.0 | 0.51 | 9.03 | 6.20 |
| Butanol | 1747.8 | 1729.0 | 18.7 | 0.70 | 9.25 | 3.32 |
| Ethanol | 1748.4 | 1729.2 | 19.2 | 0.75 | 9.50 | 2.74 |
| Isopropanol | 1748.2 | 1729.5 | 18.7 | 0.86 | 9.32 | 1.41 |
| DCM | 1743.9 | 1728.8 | 15.2 | 1.36 | 7.46 | 2.30 |
| DMSO | 1743.5 | 1729.0 | 14.5 | 1.42 | 7.14 | 2.52 |
| 1,4-dioxane | 1746.4 | 1732.1 | 14.3 | 2.90 | 6.24 | 6.97 |
| THF | 1747.5 | 1730.3 | 17.2 | 2.90 | 7.51 | 8.38 |
| Toluene | 1747.5 | 1730.6 | 17.0 | 4.25 | 6.64 | 10.46 |
Figure 2.
Dependence of the Fermi resonance coupling constant (W) of CP on the empirical solvent parameter γ = π* + α, showing separation of W values obtained in protic (red) and aprotic (blue) solvents.
Figure 3.
Dependence of Δ0 on R for CP (left) and 4-CI (right) obtained in protic (red) and aprotic (blue) solvents. The V-shaped dependence is a characteristic of Fermi resonance.
Dependence of the Fermi resonance doublet of 4-CI on solvent
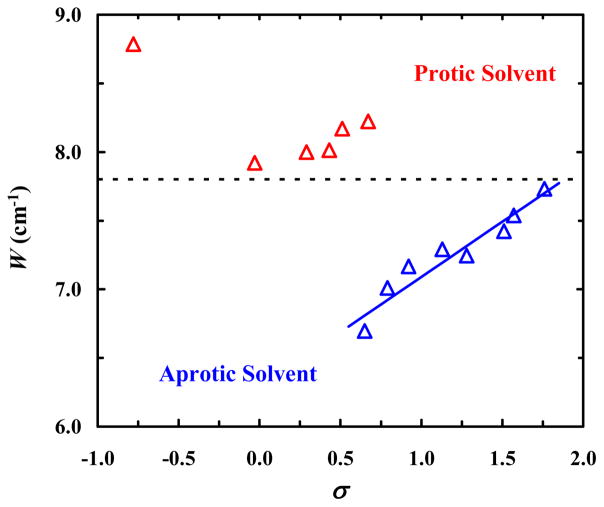
To verify the notion that W is indeed a sensitive metric for the H-bonding status of an oscillator involved in Fermi resonance, we extended our study to 4-CI. As shown (Table 2 and Figure S3 in SI), in all the solvents used 4-CI gives rise to two peaks near 2230 cm−1, where the C≡N stretching vibrational band is expected to be located. However, a normal mode analysis using Gaussian25 predicts that only one vibrational mode (i.e., the C≡N stretching mode) should be present in this spectral region. Therefore, these two observed peaks most likely arise from Fermi resonance. Further evidence supporting this assignment comes from 2D IR measurements (see below) and also the fact that a close analog of 4-CI, 5-cyanoindole (5-CI), only exhibits one peak in the expected C≡N stretching frequency region.29 To this end, we proceeded with the calculation of Δ0 and W. As seen with CP, it is evident from the results (Table 2) that in protic solvents the Fermi resonance coupling interaction is enhanced, resulting in a greater W compared to that obtained in aprotic solvents. Similar to what was done with CP, we seek to use an empirical solvent parameter to help illustrate the dependence of W on the H-bonding status of the nitrile group in 4-CI. A previous study by Zhang et al.30 indicated that the C≡N stretching frequency of 5-CI exhibits a linear correlation with the empirical solvent parameter σ = π* + β − α, where β, like π* and α, is a Kamlet-Taft parameter that characterizes a solvent’s HB accepting ability.28 Because of the structural similarity between 4-CI and 5-CI, we therefore chose σ to distinguish between different solvents. As shown (Figure 4), there is a clear grouping of points in the W versus σ plot, with the W values obtained in protic/aprotic solvents being greater/smaller than 7.7 cm−1. Furthermore, the data obtained in aprotic solvents, where α is either zero or close to zero, show reasonable linearity between W and σ, indicating that a solvent’s specific and non-specific interactions with the indole ring affect the Fermi resonance coupling interaction in question. Similarly, as shown (Figure S4 in SI), the W values obtained in these solvents also exhibit a modest linear dependence on their dielectric constants. Moreover, as observed for CP, the Δ0 values also exhibit a V-shaped dependence on R for 4-CI (Figure 3), providing further corroborating evidence that the two peaks near the C≡N stretching frequency region arise from Fermi resonance. It is worth noting that, because H-bonding interactions shift the C≡N (C=O) stretching frequency to a higher (lower) wavenumber, the Δ0 versus R plot of 4-CI appears to be a mirror image of that of CP. However, taken together the current results obtained with CP and 4-CI suggest that the Fermi resonance coupling constant constitutes a sensitive indicator of the H-bonding status of a functional group that can be used to assess its local solvation environment via simple FTIR experiments.
Table 2.
Spectral parameters of 4-CI in different solvents, arranged in order of increasing R value.
| Solvent | ω1, cm−1 | ω2, cm−1 | Δ, cm−1 | R | W, cm−1 | Δ0, cm−1 |
|---|---|---|---|---|---|---|
| DMSO | 2213.3 | 2229.1 | 15.8 | 0.66 | 7.73 | 3.24 |
| DMF | 2213.8 | 2229.1 | 15.3 | 0.71 | 7.54 | 2.59 |
| Pyridine | 2214.2 | 2229.1 | 14.9 | 0.84 | 7.42 | 1.30 |
| THF | 2215.1 | 2229.7 | 14.6 | 0.91 | 7.29 | 0.69 |
| Toluene | 2217.0 | 2230.4 | 13.4 | 1.06 | 6.70 | 0.39 |
| Cyclopentanone | 2214.0 | 2228.5 | 14.5 | 1.08 | 7.24 | 0.55 |
| 1,4-dioxane | 2216.1 | 2230.5 | 14.4 | 1.21 | 7.17 | 1.36 |
| DCM | 2216.4 | 2230.5 | 14.1 | 1.24 | 7.01 | 1.51 |
| Methanol | 2217.2 | 2233.3 | 16.1 | 1.25 | 8.00 | 1.79 |
| Ethanol | 2216.9 | 2233.1 | 16.2 | 1.34 | 8.01 | 2.35 |
| Isopropanol | 2216.9 | 2233.6 | 16.6 | 1.42 | 8.22 | 2.89 |
| Butanol | 2216.8 | 2233.5 | 16.7 | 1.52 | 8.17 | 3.45 |
| Trifluoroethanol | 2220.3 | 2239.9 | 19.6 | 2.59 | 8.79 | 8.68 |
| Acetic acid | 2217.4 | 2235.1 | 17.7 | 2.61 | 7.92 | 7.89 |
Figure 4.
Dependence of the Fermi resonance coupling constant (W) of 4-CI on the empirical solvent parameter σ = π* + β − α, showing separation of W values obtained in protic (red) and aprotic (blue) solvents. The blue line represents the linear regression of the data obtained in aprotic solvents.
Verification of the Fermi resonance of 4-CI via 2D IR spectroscopy
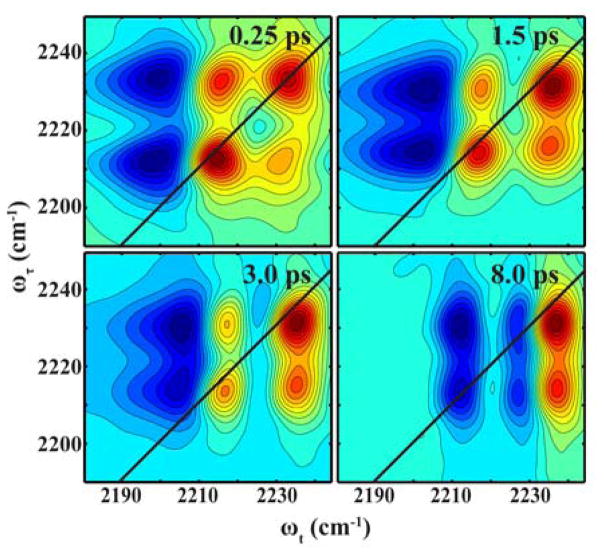
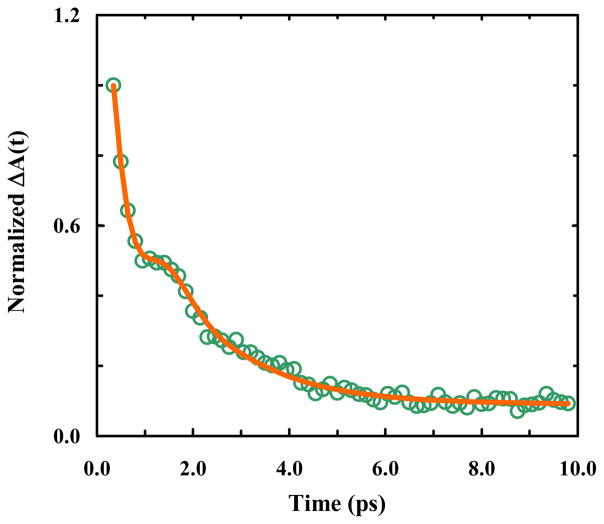
To verify that the two observed bands of 4-CI indeed arise from a coupling interaction, we carried out 2D IR measurements. It is well known that 2D IR spectroscopy is able to reveal the underlying relationship between vibrational modes observed in a FTIR spectrum, among other applications.31 For example, for two vibrational transitions that are coupled, a cross peak between these two modes would develop immediately (i.e., at T = 0), whereas for an energy transfer process, the cross peak would grow in as a function of T. As shown (Figure 5), the absorptive 2D IR spectra of 4-CI in isopropanol exhibit complex features. First, there are two positive diagonal peaks at 2230 and 2215 cm−1, respectively, corresponding to the vibrational transitions (i.e., 0→1 transitions) observed in the linear IR spectrum, which are accompanied by two negative peaks at 2215 and 2205 cm−1 due to the respective 1→2 transitions. These results indicate that the anharmonicity for the high (low) frequency mode is ~25 cm−1 (~10 cm−1), similar to the value of 23 cm−1 previously reported by Fang et al. for a nitrile stretching mode.32 Second, positive signals are observed off the diagonal at {ωτ, ωt} = {2230, 2215} cm−1 and {2215, 2230} cm−1, respectively. These cross peaks appear at early waiting times, hence indicating that the two corresponding peaks in the FTIR spectrum arise from two coupled vibrational modes, rather than due to energy transfer or distinct species. Third, there is an apparent beating between the positive, off-diagonal peaks as the waiting time is increased, as expected for a pair of coupled oscillators and as observed in similar 2D IR studies.22,33–35 A more evident manifestation of this beating feature is revealed by the pump-probe kinetics measured at 2205 cm−1 (Figure 6), which, when fit together with a single-exponential term arising from excited-state population decay, gives rise to a oscillatory trace that can be fit to a damped sine function with a period of 1.9 ± 0.1 ps and a damping time constant of 0.5 ± 0.1 ps. This period of beating is consistent with the analytical value (2 ps) calculated based on the frequency gap (i.e., 16.6 cm−1) between the two vibrational transitions.
Figure 5.
2D IR spectra of 4-CI in isopropanol at representative waiting times, as indicated.
Figure 6.
Excited-state decay kinetics of 4-CI in isopropanol, measured at 2205 cm−1. The smooth line represents the best fit of these data to a function consisting of an exponential decay component with a lifetime of 1.6 ± 0.2 ps and a damped oscillatory component with an exponential damping time constant of 0.5 ± 0.1 ps and a period of 1.9 ± 0.2 ps.
Taken together, these 2D IR results corroborate the idea that the two IR peaks observed in the C≡N stretching region of 4-CI likely result from Fermi resonance. While it is evident that the fundamental and bright mode involved is the C≡N stretching vibration, it is less straightforward to discern the nature of the dark mode involved. To this end, we attempted to look for a potential candidate in the 1000–1200 cm−1 region of the FTIR spectrum of 4-CI for every solvent. However, all the solvents used in this study, except cyclopentanone and dichloromethane, have strong absorption in this lower frequency region and hence prevent the observation of any 4-CI modes for this purpose. As shown (Figure S5 in SI), in cyclopentanone 4-CI exhibits an IR band centered at 1113.7 cm−1 with a width of 13.7 cm−1, whereas in dichloromethane this band is shifted to 1108.9 cm−1 and has a narrower width (5.1 cm−1). Based on the Gaussian frequency analysis, this mode likely consists of indole ring breathing as well as C-H and N-H wagging in the plane of the ring. Therefore, the observed spectral shift and broadening upon changing the solvent from dichloromethane to cyclopentanone could be attributed to the fact that the latter can interact with the indole N-H group in 4-CI via HB formation. Furthermore, the energy of the overtone transition of this mode is close to the vibrational energy of the fundamental C≡N stretching motion and, hence, is likely the one that participates in the aforementioned Fermi resonance. To provide further credence to this assignment, we collected the IR spectrum of N-deuterated 4-cyanoindole (ND-4-CI) in deuterated methanol (MeOD). ND-4-CI was prepared by dissolving 4-CI in deuterated trifluoroethanol (2,2,2-trifluoroethanol-d1), followed by lyophyilization (twice). As indicated (Figure S6 in SI), the IR spectrum of ND-4-CI in MeOD in the nitrile stretching frequency region is dominated by a band centered at 2228 cm−1, thus supporting the notion that the low-frequency mode involved in the Fermi resonance contains contribution from the N-H wagging motion as deuteration of this group will likely change its frequency. However, to yield more insight into the nature of the low-frequency overtone mode involved, further polarization-dependent 2D IR measurements, as those done in the study of Greve et al.,22 are required.
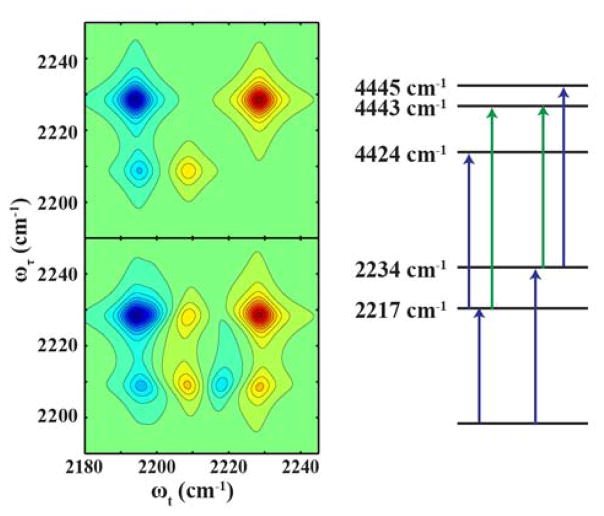
To support the above assignment of the observed 2D IR spectral features, we employed a simple transition dipole coupling model and a simulation protocol based on that of Hamm and Zanni36 to generate 2D IR spectra for comparison, based on the anharmonic IR frequencies and transition dipole vectors calculated using Gaussian ‘09.25 While it is straightforward to calculate the anharmonic frequencies for the states |1 0>, |2 0>, and |0 2>, Gaussian is unable to calculate the anharmonicities for the 3rd overtone of the ring mode |0 4> or the mixed mode |1 2> as it does not consider more than 2 quanta in the anharmonicity calculations. Therefore, in the simulation we simply included a value of 10 cm−1 for the |0 4> anharmonicity, which is a reasonable estimate based on other studies.9 As indicated (Figure 7, top panel), in the absence of coupling between the two modes, a pair of diagonal peaks is observed, however, as shown (Figure 7, bottom panel) when the additional parameter of 8 cm−1 anharmonicity (i.e., coupling) for the |1 2> mixed state is included, a pair of off-diagonal peaks appears. On the upper left side, the negative band is engulfed with the large negative diagonal peak, and a positive band occurs between this large negative peak and the positive peak on the diagonal. These features are in qualitative agreement with the observed experimental spectra collected at early waiting times, thus supporting the assignment of a Fermi resonance interaction between the nitrile stretching vibration and the first overtone of a low-frequency ring mode.
Figure 7.
Simulated 2D IR spectra using the transition dipole model discussed in the main text and the energy levels in the right panel. Top: 2D IR spectrum calculated with a nitrile stretching mode and a ring overtone mode, without coupling. Bottom: 2D IR spectrum calculated with the same vibrational modes, with a 8 cm−1 anharmonic coupling, showing the resultant cross peak.
CONCLUSIONS
Various small diatomic or triatomic functional groups, such as C=O and C≡N, that possess a distinct, strong, and environmentally sensitive IR band, have become increasingly popular as site-specific IR reporters for investigating a wide range of chemical, physical, and biological questions. However, in many cases, it is difficult, if not impossible, to directly determine the H-bonding status of the IR probe in question. Herein, we hypothesize that in cases where the fundamental IR transition of interest is involved in Fermi resonance, the underlying coupling constant (W) could be a useful indicator of the H-bonding status of the respective functional group. To test this hypothesis, we examined two model systems, cyclopentanone and 4-cyanoindole, both of which give rise two IR bands in the vicinity of the stretching vibrational frequency of the corresponding functional group (i.e., C=O and C≡N). Based on previous studies as well as 2D IR measurements, these doublet bands can be attributed to Fermi resonance. In support of our hypothesis, we found that, for both functional groups, the Fermi resonance coupling constants obtained in a series of solvents show distinct clustering into two regions, with those obtained in protic solvents being greater than 7.7 cm−1. Since both groups are expected to engage in H-bonding interactions with protic solvents, this result shows that W could be used as a convenient metric to assess their H-bonding status. In this regard, it would be interesting to find out, in future works, whether the current finding is valid for other systems.
Supplementary Material
Highlight.
This study shows that the Fermi resonance coupling constant (W) is indicative of the hydrogen-bonding status of a C=O or C≡N functional group.
Acknowledgments
We gratefully acknowledge financial support from the National Institutes of Health (P41-GM104605). R.M.A. is an NSF Graduate Research Fellow (DGE-1321851).
Footnotes
Electronic Supplementary Information (ESI) available: Additional FTIR and 2D IR spectra.
References
- 1.Ma J, Pazos IM, Zhang W, Culik RM, Gai F. Annu Rev Phys Chem. 2015;66:357–377. doi: 10.1146/annurev-physchem-040214-121802. [DOI] [PMC free article] [PubMed] [Google Scholar]
- 2.Adhikary R, Zimmermann J, Romesberg FE. Chem Rev. 2017;117:1927–1969. doi: 10.1021/acs.chemrev.6b00625. [DOI] [PubMed] [Google Scholar]
- 3.Błasiak B, Londergan CH, Webb LJ, Cho M. Acc Chem Res. 2017 doi: 10.0120/acs.accounts.7b00002. [DOI] [PubMed] [Google Scholar]
- 4.Getahun Z, Huang CY, Wang T, De León B, DeGrado WF, Gai F. J Am Chem Soc. 2003;125:405–11. doi: 10.1021/ja0285262. [DOI] [PubMed] [Google Scholar]
- 5.Fafarman AT, Webb LJ, Chuang JI, Boxer SG. J Am Chem Soc. 2006;128:13356–13357. doi: 10.1021/ja0650403. [DOI] [PMC free article] [PubMed] [Google Scholar]
- 6.Maienschein-Cline MG, Londergan CH. J Phys Chem A. 2007;111:10020–10025. doi: 10.1021/jp0761158. [DOI] [PubMed] [Google Scholar]
- 7.Oh K, Lee J, Joo C, Han H, Cho M. J Phys Chem B. 2008;112:10352–10357. doi: 10.1021/jp801558k. [DOI] [PubMed] [Google Scholar]
- 8.Watson MD, Gai XS, Gillies AT, Brewer SH, Fenlon EE. J Phys Chem B. 2008;112:13188–13192. doi: 10.1021/jp8067238. [DOI] [PubMed] [Google Scholar]
- 9.Tucker MJ, Kim YS, Hochstrasser RM. Chem Phys Lett. 2009;470:80–84. doi: 10.1016/j.cplett.2009.01.025. [DOI] [PMC free article] [PubMed] [Google Scholar]
- 10.Pazos IM, Ghosh A, Tucker MJ, Gai F. Angew Chemie - Int Ed. 2014;53:6080–6084. doi: 10.1002/anie.201402011. [DOI] [PMC free article] [PubMed] [Google Scholar]
- 11.Schmitz AJ, Hogle DG, Gai XS, Fenlon EE, Brewer SH, Tucker MJ. J Phys Chem B. 2016 doi: 10.1021/acs.jpcb.6b07212. acs.jpcb.6b07212. [DOI] [PMC free article] [PubMed] [Google Scholar]
- 12.Ramos S, Scott KJ, Horness RE, Le Sueur A, Thielges M. Phys Chem Chem Phys. 2017 doi: 10.1039/c7cp00403f. [DOI] [PMC free article] [PubMed] [Google Scholar]
- 13.King JT, Arthur EJ, Brooks CL, Kubarych KJ. J Am Chem Soc. 2014;136:188–194. doi: 10.1021/ja407858c. [DOI] [PMC free article] [PubMed] [Google Scholar]
- 14.Suydam IT, Snow CD, Pande VS, Boxer SG. Science. 2006;313:200–204. doi: 10.1126/science.1127159. [DOI] [PubMed] [Google Scholar]
- 15.Fafarman AT, Sigala PA, Herschlag D, Boxer SG. J Am Chem Soc. 2010;132:12811–12813. doi: 10.1021/ja104573b. [DOI] [PMC free article] [PubMed] [Google Scholar]
- 16.Bagchi S, Fried SD, Boxer SG. J Am Chem Soc. 2012;134:10373–10376. doi: 10.1021/ja303895k. [DOI] [PMC free article] [PubMed] [Google Scholar]
- 17.Błasiak B, Ritchie AW, Webb LJ, Cho M. Phys Chem Chem Phys. 2016;18:18094–18111. doi: 10.1039/c6cp01578f. [DOI] [PubMed] [Google Scholar]
- 18.Fermi E. Z Phys. 1931:250–258. [Google Scholar]
- 19.Amat G, Pimbert M. J Mol Spectrosc. 1965;16:278–290. [Google Scholar]
- 20.Bertran JF, Ballester L, Dobrihalova L, Sanchez N, Arrieta R. Spectrochim Acta - Part A Mol Biomol Spectrosc. 1968;24:1765–1776. [Google Scholar]
- 21.Devendorf GS, Hu MHA, Ben-Amotz D. J Phys Chem A. 1998;102:10614–10619. [Google Scholar]
- 22.Greve C, Nibbering ETJ, Fidder H. J Phys Chem B. 2013;117:15843–15855. doi: 10.1021/jp4084103. [DOI] [PubMed] [Google Scholar]
- 23.Jiang XL, Li DF, Sun CL, Li ZL, Yang G, Zhou M, Li ZW, Gao SQ. Chinese Phys Lett. 2011;28:53301. [Google Scholar]
- 24.Ding B, Hilaire MR, Gai F. J Phys Chem B. 2016;120:5103–5113. doi: 10.1021/acs.jpcb.6b03199. [DOI] [PMC free article] [PubMed] [Google Scholar]
- 25.Frisch MJ, Trucks GW, Schlegel HB, Scuseria GE, Robb MA, Cheeseman JR, Montgomery J, Jr, Vreven T, Kudin KN, Burant JC, Millam JM, Iyengar SS, Tomasi J, Barone V, Mennucci B, Cossi M, Scalmani G, Rega N, Petersson GA, Nakatsuji H, Hada M, Ehara M, Toyota K, Fukuda R, Hasegawa J, Ishida M, Nakajima T, Honda Y, Kitao O, Nakai H, Klene M, Li X, Knox JE, Hratchian HP, Cross JB, Bakken V, Adamo C, Jaramillo J, Gomperts R, Stratmann RE, Yazyev O, Austin AJ, Cammi R, Pomelli C, Ochterski JW, Ayala PY, Morokuma K, Voth GA, Salvador P, Dannenberg JJ, Zakrzewski VG, Dapprich S, Daniels AD, Strain MC, Farkas O, Malick DK, Rabuck AD, Raghavachari K, Foresman JB, Ortiz JV, Cui Q, Baboul AG, Clifford S, Cioslowski J, Stefanov BB, Liu G, Liashenko A, Piskorz P, Komaromi I, Martin RL, Fox DJ, Keith T, Al-Laham MA, Peng CY, Nanayakkara A, Challacombe M, Gill PMW, Johnson B, Chen W, Wong MW, Gonzalez C, Pople JA. Gaussian ‘09. 2009 [Google Scholar]
- 26.Cook CD, George WO. Analyst. 1972;97:250–253. [Google Scholar]
- 27.Kartha VB, Mantsch HH, Jones RN. Can J Chem. 1973;51:1749–1766. [Google Scholar]
- 28.Kamlet MJ, Abboud JLM, Abraham MH, Taft RW. J Org Chem. 1983;48:2877–2887. [Google Scholar]
- 29.Waegele MM, Tucker MJ, Gai F. Chem Phys Lett. 2009;478:249–253. doi: 10.1016/j.cplett.2009.07.058. [DOI] [PMC free article] [PubMed] [Google Scholar]
- 30.Zhang W, Markiewicz BN, Doerksen RS, Smith AB, III, Gai F. Phys Chem Chem Phys. 2016;18:7027–7034. doi: 10.1039/c5cp04413h. [DOI] [PMC free article] [PubMed] [Google Scholar]
- 31.Kim YS, Hochstrasser RM. J Phys Chem B. 2009;113:8231–51. doi: 10.1021/jp8113978. [DOI] [PMC free article] [PubMed] [Google Scholar]
- 32.Fang C, Bauman JD, Das K, Remorino A, Arnold E, Hochstrasser RM. Proc Natl Acad Sci U S A. 2008;105:1472–7. doi: 10.1073/pnas.0709320104. [DOI] [PMC free article] [PubMed] [Google Scholar]
- 33.Merchant KA, Thompson DE, Fayer MD. Phys Rev Lett. 2001;86:3899–3902. doi: 10.1103/PhysRevLett.86.3899. [DOI] [PubMed] [Google Scholar]
- 34.Edler J, Hamm P. J Chem Phys. 2003;119:2709–2715. [Google Scholar]
- 35.Costard R, Tyborski T, Fingerhut BP. Phys Chem Chem Phys. 2015;17:29906–29917. doi: 10.1039/c5cp04502a. [DOI] [PubMed] [Google Scholar]
- 36.Hamm P, Zanni MT. Concepts and Methods of 2D Infrared Spectroscopy. Cambridge University Press; Cambridge: 2011. [Google Scholar]
Associated Data
This section collects any data citations, data availability statements, or supplementary materials included in this article.


