

Abstract
The primary cilium is a plasma membrane‐protruding sensory organelle that undergoes regulated assembly and resorption. While the assembly process has been studied extensively, the cellular machinery that governs ciliary resorption is less well understood. Previous studies showed that the ciliary pocket membrane is an actin‐rich, endocytosis‐active periciliary subdomain. Furthermore, Tctex‐1, originally identified as a cytoplasmic dynein light chain, has a dynein‐independent role in ciliary resorption upon phosphorylation at Thr94. Here, we show that the remodeling and endocytosis of the ciliary pocket membrane are accelerated during ciliary resorption. This process depends on phospho(T94)Tctex‐1, actin, and dynamin. Mechanistically, Tctex‐1 physically and functionally interacts with the actin dynamics regulators annexin A2, Arp2/3 complex, and Cdc42. Phospho(T94)Tctex‐1 is required for Cdc42 activation before the onset of ciliary resorption. Moreover, inhibiting clathrin‐dependent endocytosis or suppressing Rab5GTPase on early endosomes effectively abrogates ciliary resorption. Taken together with the epistasis functional assays, our results support a model in which phospho(T94)Tctex‐1‐regulated actin polymerization and periciliary endocytosis play an active role in orchestrating the initial phase of ciliary resorption.
Keywords: branched actin dynamics, Cdc42, clathrin‐dependent endocytosis, primary ciliary resorption, Tctex‐1
Subject Categories: Cell Adhesion, Polarity & Cytoskeleton; Membrane & Intracellular Transport
Introduction
Research interest in cilia has grown immensely in the past two decades because alterations in cilia have been linked to a family of ciliopathy diseases 1. The primary cilium is a hair‐like plasma membrane projection supported by a 9 + 0 microtubule axoneme that extends from the basal body 2. A specialized, depressed plasma membrane domain that surrounds the proximal region of the ciliary axoneme is called the ciliary pocket (CiPo). The CiPo has been recently recognized as a central hub for membrane trafficking and signal transduction 3, 4, 5, 6. The plasma membrane of the CiPo is decorated by abundant clathrin‐coated pits and F‐actin filaments, and the CiPo is a site of robust clathrin‐mediated endocytosis (CME). A strong body of evidence indicates that actin polymerization is important for ciliogenesis and ciliary length control 7, 8, 9, 10, 11. While the dynamic organization of actin, particularly branched actin, is known to regulate endosomal trafficking 12, 13, 14, 15, 16, strategies that inhibit CME do not affect ciliogenesis 3, 4.
The primary cilium is dynamically expressed in cycling cells. It appears at G0/G1 and undergoes biphasic resorption, first at the G1‐S transition and then at the G2‐M transition 17, 18. Emerging evidence shows that ciliary resorption is linked with cell cycle progression and neural cell fate choice 19, 20, 21. Dysregulation of ciliary dynamics has been implicated in a broad spectrum of clinical conditions, including microcephaly and cancer 21, 22. Despite recent characterization of several signaling pathways that trigger ciliary resorption 23, 24, the cellular machinery that carries out this process remains largely unexplored.
Tctex‐1 (or DYNLT1) was originally identified as a light chain of the cytoplasmic dynein motor complex, and has a cargo‐adapting role 25, 26, 27, 28. Tctex‐1 phosphorylated at Thr94 (or phospho(T94)Tctex‐1) is not associated with the dynein complex and has several dynein‐independent functions 29, 30, 31. Our previous studies showed that phospho(T94)Tctex‐1 is recruited to the ciliary transition zone of cells at the G1‐S border. Silencing Tctex‐1 blocks both ciliary resorption and G1‐S progression 20. Expression of either wild‐type (WT) Tctex‐1 or the phospho‐mimetic variant Tctex‐1T94E, but not phospho‐dead variant Tctex‐1T94A, can rescue the Tctex‐1 knockdown (KD)‐induced ciliary resorption and S‐phase entry defects 20. These results suggest that Tctex‐1T94E represents a functionally active form of Tctex‐1 in ciliary disassembly.
While actin appears to have a role in phospho(T94)Tctex‐1‐regulated ciliary resorption 20, the precise mechanism of action remains elusive. Previous studies showed that in growth cones, phospho(T94)Tctex‐1 activates Rac1GTPases and promotes neurite outgrowth by regulating actin dynamics 29. In the present paper, we address the mechanisms of Tctex‐1 by combining proteomics, biochemical assays, and cilium assembly/disassembly assays in an immortalized retinal pigment epithelial cell line (RPE‐1). Our data suggest that phospho(T94)Tctex‐1 plays a determining role in early‐phase ciliary resorption through Cdc42 GTPase activation, branched actin reorganization, and CME at CiPo membranes.
Results
Tctex‐1 and actin dynamics are important for early‐phase ciliary resorption
We employed an established protocol to induce ciliogenesis by serum starvation and then ciliary resorption by adding serum back to the culture medium. Immunostaining of the acetylated α‐tubulin (Ac‐Tub) was used to identify primary cilia. Like naïve RPE‐1 cells 17, 20, 32, control cells transfected with GFP control underwent a biphasic resorption at 2‐h and 24‐h time points after serum re‐addition. No significant ciliary resorption was detected prior to the 2‐h time point (Figs 1A and B, and EV1A). By contrast, the expression of GFP‐Tctex‐1T94E accelerated the onset of ciliary resorption; significantly fewer GFP‐Tctex‐1T94E‐transfected cells had cilia at 0.5 and 1 h post‐serum addition (Figs 1A and B, and EV1A). However, at the 2‐h and 24‐h time points, the degree of ciliary resorption was no longer significantly different between GFP and GFP‐Tctex‐1T94E‐transfected cells (Fig 1A).
Figure 1. Tctex‐1 and actin polymerization are involved in early‐phase ciliary resorption.
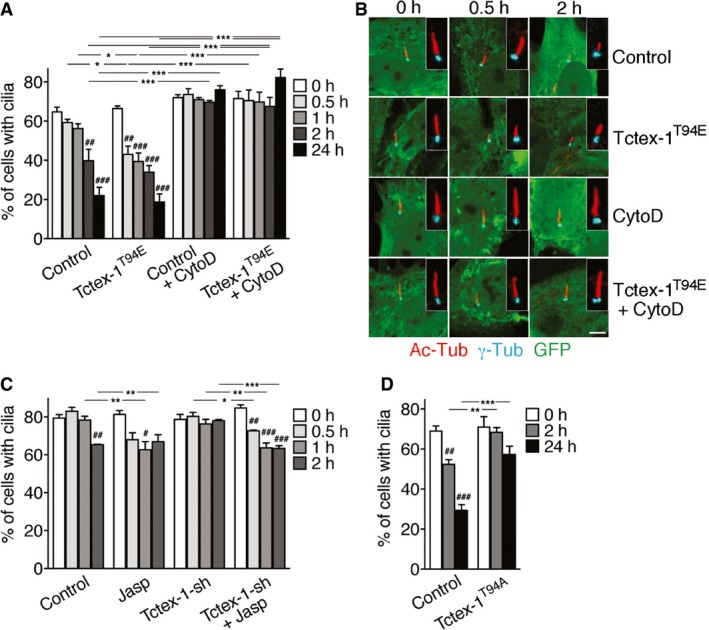
- RPE‐1 cells expressing GFP alone (control) or GFP‐Tctex‐1T94E were subjected to a ciliary resorption assay in the presence (+) or absence of CytoD and harvested at the indicated time points after serum re‐addition (see Materials and Methods). A histogram shows the percentages of GFP+ cells expressing cilia.
- Representative confocal microscope images of Ac‐Tub‐labeled cilia (red) and γ‐Tub‐labeled basal body (cyan) in GFP+ cells described in (A). Scale bar = 5 μm.
- RPE‐1 cells transfected with GFP (control) or Tctex‐1‐shRNA(‐IRES‐GFP) plasmid were subjected to ciliary disassembly assay with or without jasplakinolide (Jasp). A histogram shows the percentages of GFP+‐transfected cells expressing cilia.
- Quantification of a ciliary disassembly assay of cells transfected with GFP alone (control) or together with Flag‐Tctex‐1T94A. Percentage of GFP+ cells expressing cilia was counted.
Figure EV1. Tctex‐1, actin, and dynamin regulated CiPo membrane remodeling (related to Figs 1 and 2).
-
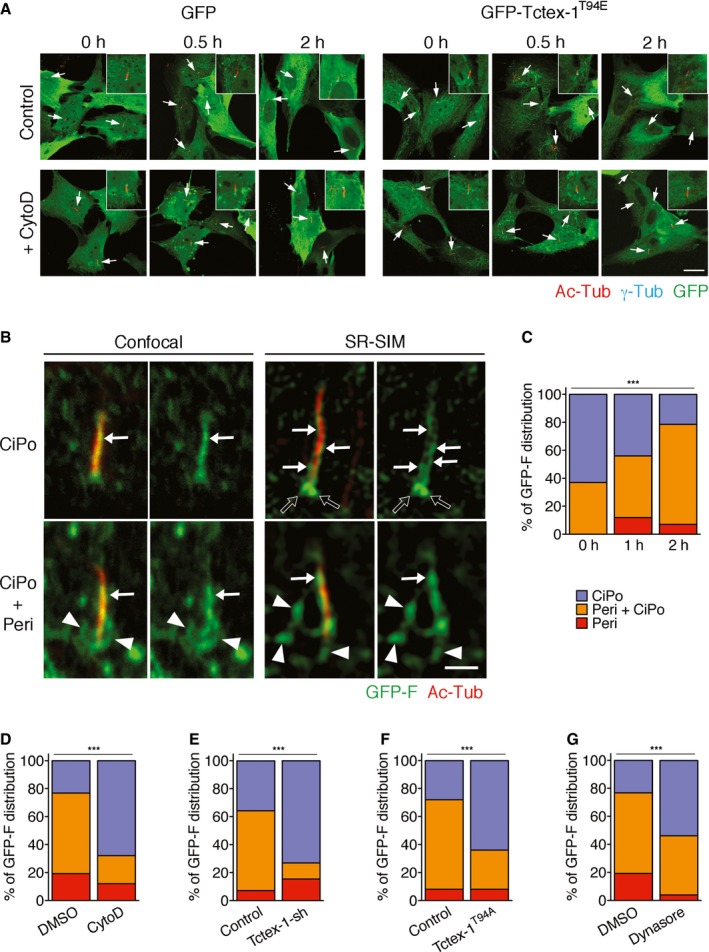
ARepresentative low‐magnification confocal images of GFP or GFP‐Tctex‐1T94E‐transfected RPE‐1 cells presented in part of Fig 1B. These cells, treated with serum for the indicated times in the absence (control) or presence of CytoD, were co‐stained for GFP and cilium marker Ac‐Tub (red), and basal body marker γ‐tubulin (γ‐Tub; cyan) (arrows). Insets show enlarged views of the representative cilia in each treatment.
-
BRepresentative images taken by confocal microscopy or SR‐SIM reveal the CiPo (arrows) and periciliary (peri; arrowheads) membrane expression of transfected GFP‐F harvested at 0 h (top panels) and 2 h (bottom panels) after serum stimulation. Under confocal microscopy, the cilium‐associated GFP‐F signals largely overlap with Ac‐Tub labeling (red; arrows). Under SR‐SIM, the GFP‐F signals highlight the invaginated (pocket) membrane at the base of the cilium (black arrows) and also delineate thin line(s) in close apposition to and in parallel to the Ac‐Tub‐labeled ciliary axoneme (arrows). The periciliary GFP‐F signals (arrowheads) taken by SR‐SIM are less fuzzy than those taken by confocal microscopy, allowing the quantification described in main Fig 2B and E–G.
-
C–GQuantifications of GFP‐F membrane remodeling, showing the percentages of cells that had GFP‐F+ structures distributed in three different categories (i) CiPo only (blue), (ii) periciliary membrane only (red), and (iii) both CiPo and periciliary membranes (orange). These cells, with or without treatment or transfection, as indicated, were serum‐treated and harvested at the indicated time points (C) or 2 h later (D–G). Data are means ± s.e.m. ***P < 0.001; chi‐square test. n = 30 cilia per experiment, three independent experiments.
As expected 20, we found that pretreatment with the actin polymerization inhibitor cytochalasin D (CytoD) blocked serum‐stimulated ciliary resorption at all time points tested (i.e., 0.5–24 h) (Fig 1A and B). Furthermore, CytoD almost completely inhibited Tctex‐1T94E‐accelerated ciliary resorption (Figs 1A and B, and EV1A). A converse approach showed that stimulating actin polymerization with jasplakinolide (20 nM, 15 min; 33) hastened ciliary resorption, mimicking the effect of Tctex‐1T94E overexpression. Significantly fewer jasplakinolide‐treated cells displayed cilia at the 1‐h time point (Fig 1C). Moreover, jasplakinolide was able to reverse the ciliary resorption inhibition caused by Tctex‐1 silencing (via transfection of a previously validated Tctex‐1‐shRNA‐IRES‐GFP plasmid 20) (Fig 1C). These results collectively suggest that actin dynamics plays an important role downstream of Tctex‐1 in the first phase of ciliary resorption.
Similar to the effect caused by Tctex‐1 KD (Fig 1C, 20), overexpression of Tctex‐1T94A, but not control vector, drastically inhibited serum‐mediated ciliary resorption (Fig 1D). These results suggest that Tctex‐1T94A blocks Tctex‐1‐regulated ciliary resorption through a dominant‐negative (DN) mechanism.
Tctex‐1 and actin regulate CiPo membrane remodeling during ciliary resorption
Given the abundant actin filaments attached to CiPo membranes, we investigated whether CiPo membrane participates in the process of ciliary resorption. We used transfected farnesylation motif‐fused GFP (GFP‐F), a previously characterized CiPo membrane reporter 3, to track CiPo membrane remodeling in response to serum addition. At the 0‐h time point, we found a high percentage of cells had GFP‐F signal closely associated with Ac‐Tub labeling (0 h in Fig 2A, arrows in Fig EV1B and C). In fact, the cilium‐associated GFP‐F signals were often unresolvable from the Ac‐Tub‐labeled ciliary axonemes by confocal microscopy. Thus, we turned to super‐resolution structured illumination microscopy (SR‐SIM). The SR‐SIM images showed that GFP‐F‐labeled CiPo membranes appeared as 1–2 thin lines immediately adjacent to the Ac‐Tub‐labeled axonemal microtubules as well as the “invaginated pockets” bordering the proximal ends of the cilia (Fig EV1B). As early as 1–2 h after serum treatment, the periciliary GFP‐F signals became much more prominent (arrowheads, Figs 2A and B, and EV1B). These signals formed a randomly oriented network of tubules that were attached to one another and to the base of the cilia. Concomitantly, the number of cells with exclusive CiPo GFP‐F signal was reduced (Fig EV1C).
Figure 2. CiPo membrane remodeling during early‐phase ciliary resorption.
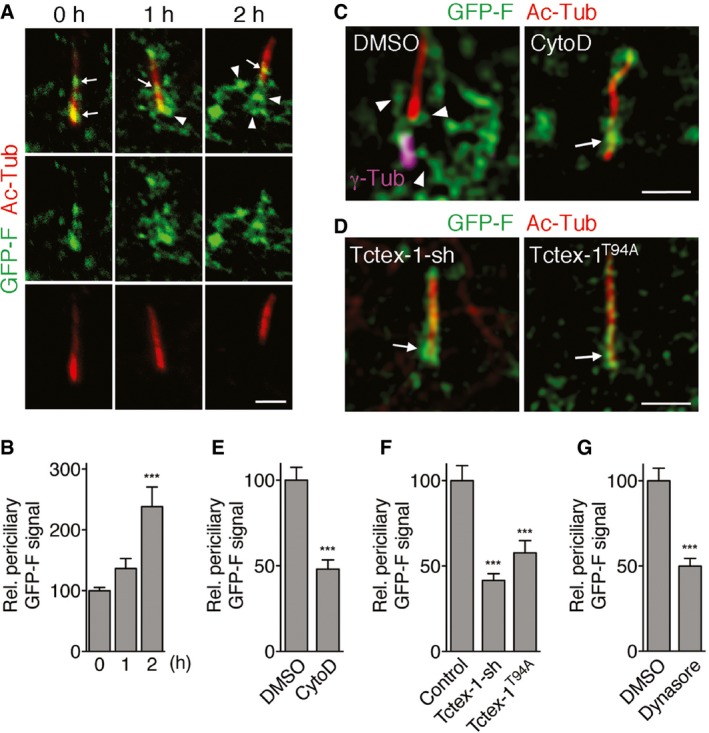
- Representative SR‐SIM images of Ac‐Tub (red) and transfected GFP‐F (green) in RPE‐1 cells harvested at the indicated times post‐serum stimulation. Arrows and arrowheads mark the CiPo and periciliary signals of GFP‐F, respectively. GFP‐F signals are occasionally seen at more distal regions of cilia, as previously described 3.
- Quantification of the periciliary signal of GFP‐F in cells harvested at the indicated time points post‐serum stimulation. The signal of the 0‐h time point is considered as 100%.
- Representative SR‐SIM images of transfected GFP‐F and Ac‐Tub (red) labeling in cells treated with DMSO or CytoD and harvested 2 h post‐serum stimulation. Arrows and arrowheads mark the CiPo and periciliary signals of GFP‐F, respectively. The basal body, labeled by γ‐tubulin (γ‐Tub; magenta), is also shown in left panel.
- Representative SR‐SIM images of Ac‐Tub (red) labeling in cells transfected with GFP‐F together with (non‐colored) Tctex‐1‐shRNA (left) or Flag‐Tctex‐1T94A (right) and harvested 2 h post‐serum treatment. Arrows point to the CiPo signal of GFP‐F.
- Quantification of (C). Relative periciliary GFP‐F+ signal intensity between DMSO‐ and CytoD‐treated cells 2 h post‐serum addition is shown. The signal of the DMSO control is considered as 100%.
- Quantification of (D). Relative periciliary GFP‐F+ signal intensity between vector (control)‐, Tctex‐1‐shRNA (sh)‐, and Flag‐Tctex‐1T94A‐transfected cells. The signal of the control‐transfected cells is considered as 100%.
- Relative periciliary GFP‐F+ signal intensity between DMSO‐ and dynasore‐treated cells 2 h post‐serum addition is shown. The signal of the DMSO control is considered as 100%.
The increase in the serum‐stimulated periciliary GFP‐F signal was significantly suppressed by CytoD treatment, Tctex‐1 silencing, or Tctex‐1T94A overexpression (Figs 2C–F and EV1D–F). Thus, CiPo membrane remodeling is temporally coupled to ciliary resorption through the regulation of phospho(T94)Tctex‐1, and this process is actin‐dependent.
Tctex‐1, actin, and dynamin are required for the serum‐stimulated acceleration of CiPo membrane endocytosis
The aforementioned periciliary GFP‐F tubules were frequently associated with EEA1‐labeled early endosomes (Fig 3A), indicating that these tubules represented endocytosed CiPo membrane. In agreement with this, we showed that inhibiting CME using dynasore, a specific cell‐permeable inhibitor of dynamin GTPase 34, significantly suppressed the number of cells that had periciliary GFP‐F signal (Fig EV1G) as well as the intensity of the periciliary GFP‐F signal (Fig 2G).
Figure 3. CiPo membrane endocytosis acceleration during ciliary resorption is dependent on actin, Tctex‐1, and dynamin.
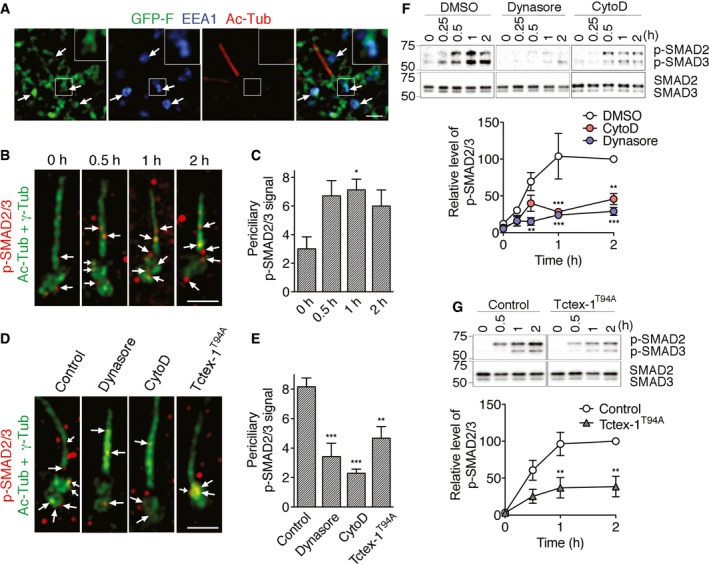
- Representative SR‐SIM images of EEA1 (blue) and Ac‐Tub (red) labeling of GFP‐F‐transfected cells 2 h post‐serum re‐addition. Arrows point to GFP‐F signal on EEA1‐labeled early endosomes; insets show enlarged views of the boxed areas.
- Starved RPE‐1 cells, treated with serum for the indicated time periods, were fixed and stained for p‐SMAD2/3 (red), Ac‐Tub (green), and γ‐tubulin (γ‐Tub) (green). Note that Alexa 488‐conjugated donkey anti‐mouse antibodies were used to detect both anti‐Ac‐Tub and γ‐Tub mouse antibodies. Representative SR‐SIM images are shown. Arrows point to p‐SMAD2/3 associated with CiPo or periciliary membranes.
- Quantification of (B). The average p‐SMAD2/3 puncta associated with CiPo or periciliary membranes per cell is shown.
- Starved RPE‐1 cells were treated with serum for 1 h in the absence (i.e., control) or presence of CytoD, or dynasore, then immunostained for p‐SMAD2/3 (red), Ac‐Tub (green), and γ‐Tub (green) as described in (B). For the Flag‐Tctex‐1T94A and GFP‐co‐transfected cells, Ac‐Tub and γ‐Tub labeling were detected by Alexa 405‐conjugated secondary antibodies and then false‐colored in green for presentation. Arrows point to p‐SMAD2/3 puncta associated with CiPo or periciliary membranes.
- Quantification of (D). The average p‐SMAD2/3 puncta associated with CiPo or periciliary membranes per cell is shown.
- p‐SMAD2/3 activation assays. (Top) Representative immunoblots of SMAD2/3 and p‐SMAD2/3 in RPE‐1 cells treated with the indicated reagents and harvested at different time points post‐serum stimulation. (Bottom) Relative p‐SMAD2/3 level change (i.e., ratio of p‐SMAD2 + p‐SMAD3 signal to total SMAD2 + SMAD3 signal) plotted over time; the ratio of control cells harvested at 2‐h time point is considered as 100%.
- p‐SMAD2/3 activation assays of RPE‐1 cells transfected with vector control or Flag‐Tctex‐1T94A. The representative immunoblots and the relative p‐SMAD2/3 level change plotted over time are shown. The signal from control cells harvested at the 2‐h time point is considered as 100%.
Previous studies showed that cilium‐localized transforming growth factor‐β (TGFβ) receptor, upon activation, is internalized from CiPo membrane and rapidly phosphorylates its effector SMAD2/3 in the early endosome at the ciliary base 4. Thus, we used periciliary phosphorylated SMAD2/3 (p‐SMAD2/3) signal as a surrogate marker for CiPo membrane endocytosis. Our results showed that serum addition rapidly increased the number of periciliary p‐SMAD2/3‐positive puncta, peaking at the 1‐h time point (Fig 3B and C). The periciliary p‐SMAD2/3 up‐regulation was significantly suppressed by the treatment of dynasore and CytoD, as well as by Tctex‐1T94A overexpression (Fig 3D and E).
In addition, we used the ratio of p‐SMAD2/3 vs. total SMAD2/3 on immunoblots to demonstrate that the p‐SMAD2/3 activation was stimulated by the serum treatment (Fig 3F and G). These experiments independently confirmed not only the kinetics of p‐SMAD2/3 activation, but also its sensitivity to CytoD, dynasore, and Tctex‐1T94A overexpression (Fig 3F and G).
The CiPo is also a robust transferrin endocytic site 3. Our previous studies showed that like serum, the insulin‐like growth factor‐1 (IGF‐1), can trigger ciliary resorption and periciliary transferrin uptake 5. We showed that IGF‐1 addition led to a rapid increase (0.5–1 h) in the periciliary appearance of Alexa 594‐conjugated transferrin internalized from the culture medium (Fig EV2A). Furthermore, we found that the application of CytoD, dynasore, and Tctex‐1T94A overexpression detectably inhibited periciliary transferrin uptake (Fig EV2B and C). These results, taken together, suggest that phospho(T94)Tctex‐1 and actin critically participate in activating CiPo membrane endocytosis prior to the first phase of ciliary resorption.
Figure EV2. CiPo membrane endocytosis assay using transferrin uptake (related to Fig 3).
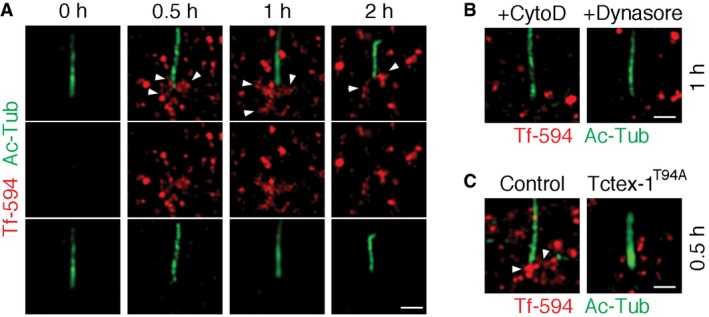
- Starved RPE‐1 cells were treated with IGF‐1 to stimulate ciliary resorption 5. Alexa 594‐conjugated transferrin (Tf‐594) was added in the culture medium during this process, and cells were harvested at the indicated times. The surface‐bound transferrin was removed by ice‐cold mild acid wash, and then fixed for immunolabeling for Ac‐Tub. Representative SR‐SIM images are shown. Arrowheads point to internalized Tf‐594 localized to the periciliary region.
- Representative SR‐SIM images show the Tf‐594 endocytosed in the periciliary regions of RPE‐1 cells treated with CytoD or dynasore, followed by 1‐h serum stimulation.
- Representative SR‐SIM images show the Tf‐594 endocytosed in the periciliary regions of RPE‐1 cells transfected with GFP alone (control) or together with Flag‐Tctex‐1T94A. Ac‐Tub signal, detected by Alexa 405‐conjugated secondary antibody, was false‐colored in green in these images. Arrowheads point to internalized Tf‐594 localized to the periciliary region. Scale bars = 1 μm.
Tctex‐1 physically and functionally interacts with ANXA2 and Arp2/3 during ciliary resorption
To uncover the molecular components underlying Tctex‐1‐regulated ciliary resorption, we set out to identify the protein(s) that binds to Tctex‐1. We generated RPE‐1 stable lines expressing either GFP‐Tctex‐1 or GFP. Protein lysates extracted from the cells harvested at 2 h after serum re‐addition were subjected to immunoprecipitation using anti‐GFP antibody (Fig EV3A); protein bands specifically pulled down by GFP‐Tctex‐1 but not by GFP were analyzed by mass spectrometry. These analyses identified several actin‐binding proteins. Among them, Tctex‐1's interaction with annexin A2 (ANXA2) and subunit 2 of actin‐related protein 2/3 (Arp2/3) complex (ARPC2; Table EV1) were investigated and confirmed. First, we showed that endogenous Tctex‐1 formed a protein complex with ANXA2 and ARPC2. Anti‐Tctex‐1 antibody, but not control antibody, specifically co‐immunoprecipitated endogenous Tctex‐1 with ANXA2 and ARPC2 from protein lysates of embryonic mouse brain (Fig 4A). Embryonic mouse brains were employed because they are a rich source of neural progenitors whose ciliary resorption is regulated by phospho(T94)Tctex‐1 20.
Figure EV3. Biochemical analyses of Tctex‐1's interacting proteins and their gene silencing effect (related to Fig 4).
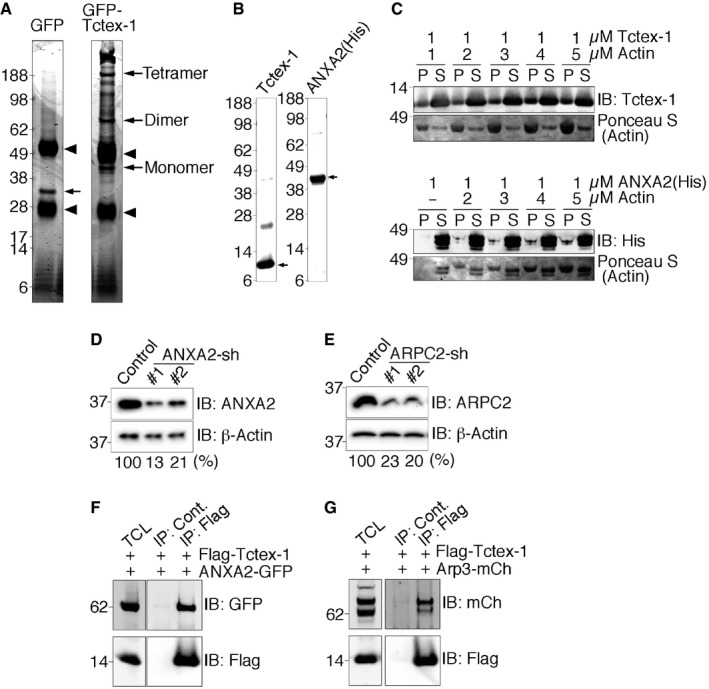
-
AAnalytic gels of proteomic samples. Cell lysates of RPE‐1 stable line expressing GFP or GFP‐Tctex‐1 were incubated with Dynabeads protein G non‐covalently conjugated with anti‐GFP rabbit antibody. The Coomassie blue dye‐stained “analytic” gels of these GFP immunoprecipitates are shown. Arrowheads point to the co‐eluted immunoglobulin heavy and light chains. Arrows point to the precipitated GFP, or GFP‐Tctex‐1. Since Tctex‐1 forms dimers 66, GFP‐Tctex‐1 dimers and tetramers are also seen on the gel. Note that several bands appearing in the GFP‐Tctex‐1 immunoprecipitates are absent in the GFP immunoprecipitates. Furthermore, for the preparative proteomic analysis we used Dynabeads M‐270 Epoxy, which is covalently conjugated with anti‐GFP antibody.
-
BValidation of purity of recombinant Tctex‐1 and His‐ANXA2 used in experiments described in (C) and main Fig 4B. Approximately 1 μg of each purified recombinant protein was run on SDS–PAGE and stained with Coomassie brilliant blue. Arrows point to the protein bands with expected sizes. Note that Tctex‐1 dimers are also seen.
-
CF‐actin co‐sedimentation. Tctex‐1 or His‐tagged ANXA2 was incubated with various concentrations of polymerized F‐actin filaments and subjected to ultracentrifugation. Equal amounts of proteins from the resulting supernatant (S) or pellet (P) fractions were loaded into SDS–PAGE and detected by immunoblotting (IB) for recombinant proteins or Ponceau S for actin. Note that, due to the similar molecular masses, ANXA2 protein was also seen in the Ponceau S staining.
-
D, EValidation of shRNA‐mediated gene silencing effect of ANXA2 and ARPC2. Representative immunoblots of cell lysates of RPE‐1 transfected with GFP alone (control) or together with one of the two shRNAs (#1, #2) against the indicated target genes are shown. The relative amount of the target protein was normalized by the β‐actin shown below the blots (%).
-
F, GValidation of specific protein–protein interactions with Tctex‐1. Immunoprecipitation using 293T cells transfected with the indicated plasmids for 1 day. Approximately 400 μg of lysate was immunoprecipitated with an anti‐Flag antibody or a species‐matched control (Cont.) IgG, followed by immunoblotting (IB) with the indicated antibodies. Immunoblots of 10 μg of total cell lysate (TCL) were also shown to reveal the input.
Figure 4. Tctex‐1's physical and functional interaction with ANXA2 and Arp2/3 complex proteins.
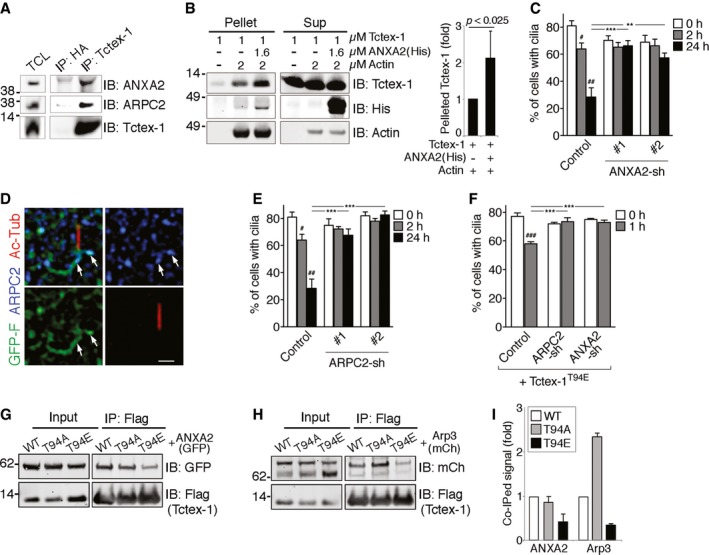
-
ATotal cell lysates (TCL; 20 μg), and Tctex‐1 (or HA control) antibody immunoprecipitates (IP) of embryonic day 13.5 mouse brains were immunoblotted (IB) with ANXA2, ARPC2, and Tctex‐1.
-
BF‐actin co‐sedimentation assays. (Left) Purified Tctex‐1 and His‐tagged ANXA2 of indicated concentrations were incubated with or without polymerized F‐actin filaments, and subjected to ultracentrifugation. Equal amounts of proteins from the resulting supernatant (Sup) or pellet fractions were loaded into SDS–PAGE and detected by immunoblotting with the indicated antibodies. (Right) Quantification of the co‐pelleted Tctex‐1. After subtracting the intensity of the background control (first lane), the intensity of the F‐actin‐co‐pelleted fraction in the absence of the other recombinant protein (second lane) was set as 100%.
-
CQuantification of ciliary disassembly assay of cells transfected with control vector, ANXA2‐shRNA#1‐IRES‐GFP (#1), ANXA2‐shRNA#2‐IRES‐GFP (#2) were subjected to ciliary disassembly assay. A histogram shows the percentages of GFP+‐transfected cells expressing cilia. The KD validation of these shRNA plasmids is shown in Fig EV3D.
-
DRepresentative SR‐SIM images of 2‐h serum‐stimulated, GFP‐F (green)‐transfected RPE‐1 cells stained for Ac‐Tub (red) and ARPC2 (blue). Arrows point to the ARPC2‐associated GFP‐F signals. Scale bar = 1 μm.
-
EQuantification of ciliary disassembly assay of cells transfected with vector control or two independent ARPC2‐shRNA‐IRES‐GFP (#1, #2). The KD validation of these shRNA plasmids is shown in Fig EV3E.
-
FA histogram shows percentages of cells transfected with Flag‐Tctex‐1T94E together with control vector, ANXA2‐shRNA‐IRES‐GFP, or ARPC2‐shRNA‐IRES‐GFP expressing cilia.
-
G, HTotal cell lysates (input) of 293T cells transfected with GFP‐ANXA2 (G) or mCherry(mCh)‐Arp3 (H) together with Flag‐tagged Tctex‐1 (WT), Tctex‐1T94A (T94A), or Tctex‐1T94E (T94E) were immunoblotted with the indicated antibodies. Flag immunoprecipitates of these cell lysates were also immunoblotted similarly.
-
IQuantification assays of (G, H). The relative amounts of GFP‐ANXA2 and mCherry‐Arp3 co‐immunoprecipitated with different Flag‐Tctex‐1 variants of two independent experiments are shown.
ANXA2 has an actin assembly role on both plasma and endosomal membranes 3, 35, 36. We showed that purified ANXA2 or Tctex‐1 recombinant protein could individually co‐sediment with polymerized F‐actin in a dose‐dependent fashion (Fig EV3B and C). Moreover, ANXA2 significantly enhanced Tctex‐1's ability to co‐sediment with F‐actin (Fig 4B). Using two validated ANXA2‐shRNAs (Fig EV3D), we showed that ANXA2‐KD significantly inhibited ciliary resorption without affecting ciliogenesis (Fig 4C).
ARPC2 is a subunit of the Arp2/3 protein complex, which consists of seven proteins. The Arp2/3 complex has several pivotal roles in actin organization, particularly in stabilizing the branching points on the sides of existing F‐actin filaments, and hence branched actin formation 37. The Arp2/3 complex is concentrated in the CME sites; perturbing Arp2/3 activity compromises endocytosis 9, 38. Our SR‐SIM analyses showed ARPC2+ puncta were in frequent association with periciliary GFP‐F tubules (Fig 4D). Silencing ARPC2 also specifically blunted ciliary resorption (Figs 4E and EV3E). Importantly, either ARPC2 or ANXA2‐KD effectively suppressed Tctex‐1T94E‐induced ciliary resorption acceleration (Fig 4F). These results indicate that ARPC2 and ANXA2 are downstream effectors of phospho(T94)Tctex‐1‐regulated ciliary resorption.
To gain further insights into phospho(T94)Tctex‐1‐mediated actin reorganization, we asked whether the phospho‐dead Tctex‐1T94A and the phospho‐mimetic Tctex‐1T94E bound differently to ANXA2 and Arp2/3. In these experiments, we tested the ability of Flag‐Tctex‐1 (transfected into 293T cells) to specifically pull down co‐transfected GFP‐ANXA2 or mCherry‐Arp3 using anti‐Flag antibody (Fig EV3F and G). We found that the binding of ANXA2 to Tctex‐1T94E, Tctex‐1T94A, and wild‐type Tctex‐1 was similar (Fig 4G and I). By contrast, Tctex‐1T94E and Tctex‐1T94A had greatly reduced and increased affinity for Arp3, respectively (Fig 4H and I), indicating that Thr94 phosphorylation of Tctex‐1 modulates its interaction with the Arp2/3 complex.
Tctex‐1‐regulated Cdc42 activation is involved in ciliary resorption
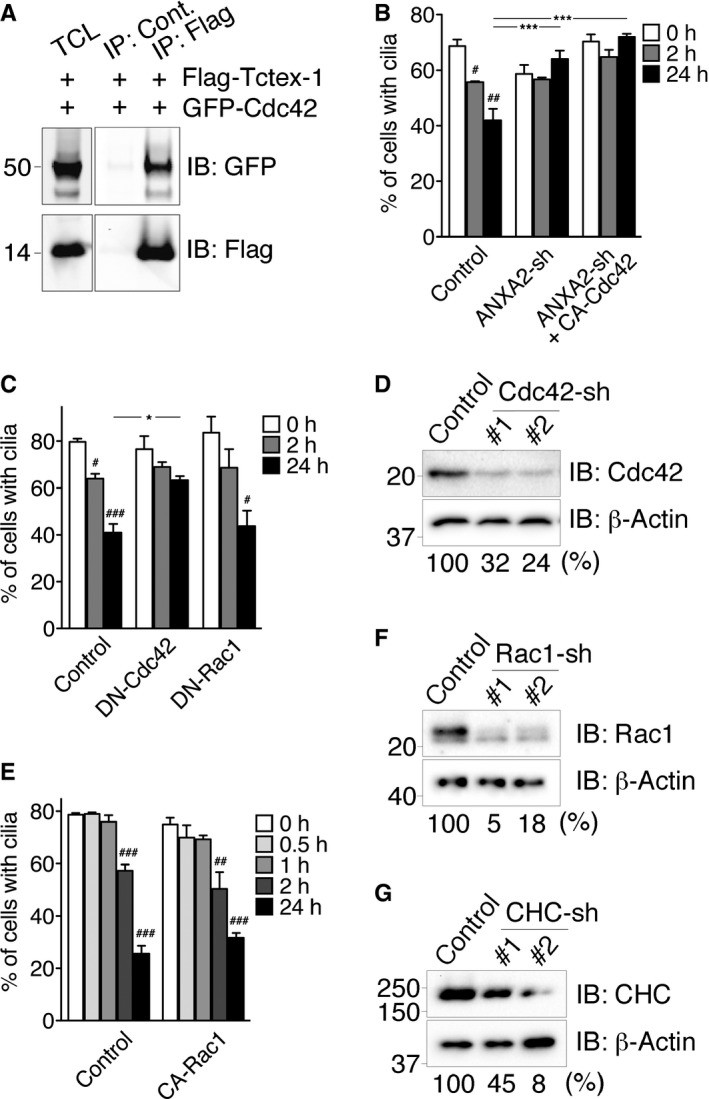
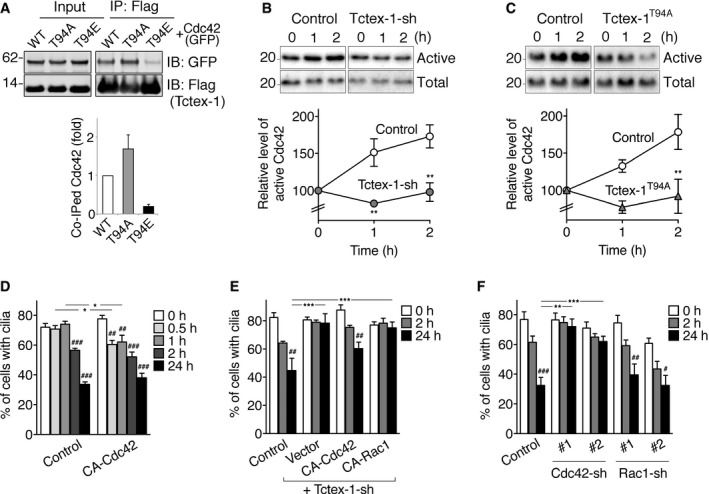
The small GTPase Cdc42 is a key regulator of actin dynamics, linking signal transduction to actin polymerization through effector proteins such as the Arp2/3 complex 39, 40, 41. ANXA2 is also a Cdc42‐binding protein 42. We found that GFP‐Cdc42 was also specifically co‐immunoprecipitated by co‐transfected Flag‐Tctex‐1 (Fig EV4A). Moreover, like Arp3, GFP‐Cdc42 had a stronger affinity for Tctex‐1T94A, and a weaker affinity for Tctex‐1T94E, than for WT Tctex‐1 (Fig 5A).
Figure EV4. Protein interaction, ciliary disassembly, and gene silencing assay of Tctex‐1's interacting proteins and downstream effectors (related to Figs 5 and 6).
-
AValidation of Cdc42‐Tctex‐1 interaction. Immunoprecipitation using 293T cells transfected with the indicated plasmids for 1 day. Approximately 400 μg of lysate was immunoprecipitated with an anti‐Flag antibody or a species‐matched control (Cont.) IgG, followed by immunoblotting (IB) with the indicated antibodies. Immunoblots of 10 μg of total cell lysate (TCL) were also shown to reveal the input.
-
B–G(B, C, E) Quantification of ciliary disassembly assay of cells transfected with GFP alone (control), or ANXA2‐shRNA‐IRES‐GFP alone, or together with HA‐tagged CA‐Cdc42 (in B); GFP together with pcDNA3 vector (control), HA‐tagged DN‐Cdc42, or HA‐tagged DN‐Rac1 (in C); GFP together with pcDNA3 vector (control) or HA‐tagged CA‐Rac1 (in E). Histograms show the percentages of GFP+ cells expressing cilia at different time points. Data are the means ± s.e.m. # P < 0.05, ## P < 0.01, ### P < 0.001; one‐way ANOVA followed by Tukey's test (comparing with 0 h of each group). *P < 0.05, ***P < 0.001; two‐way ANOVA followed by Bonferroni's test (comparing between groups). n = 100 cells per experiment, three independent experiments. (D, F, G) Validation of shRNA‐mediated gene silencing effect of Cdc42, Rac1, and clathrin heavy chain (CHC). Representative immunoblots of cell lysates of RPE‐1 transfected with GFP alone (control) or together with one of the two shRNAs (#1, #2) against the indicated target genes are shown. The relative amount of the target protein was normalized by the β‐actin shown below the blots (%).
Figure 5. Cdc42 is downstream of Tctex‐1‐regulated ciliary resorption.
-
ATotal cell lysates (input) of 293T cells transfected with GFP‐Cdc42 together with Flag‐tagged WT Tctex‐1, Tctex‐1T94A, or Tctex‐1T94E were immunoblotted with the indicated antibodies. Immunoblots of Flag immunoprecipitates of these cell lysates are also shown. Quantification results of the relative amounts of GFP‐Cdc42 co‐immunoprecipitates with different Flag‐Tctex‐1 variants of two independent experiments are shown.
-
B, CCdc42 activity assays. Representative immunoblots probed with anti‐Cdc42 antibody show the total and the active Cdc42 that bound to PAK‐PBD beads. Quantification shows the Cdc42 activity (ratio of active Cdc42: total Cdc42) of RPE‐1 cells, transfected with GFP alone (control in B), Tctex‐1‐shRNA (in B), pcDNA3 empty vector (control in C), or Flag‐Tctex‐1T94A (in C) at different time points post‐serum stimulation. The values of control cells at 0‐h time point are considered as 100%.
-
DQuantification of ciliary disassembly assay of cells transfected with GFP alone (control), or together with HA‐tagged CA‐Cdc42. A histogram shows the percentages of GFP+ cells expressing cilia at different time points.
-
EQuantification of ciliary disassembly assay of cells transfected with GFP alone (control), or co‐transfected with Tctex‐1‐shRNA‐IRES‐GFP together with pcDNA3 alone (vector), HA‐tagged CA‐Cdc42, or HA‐tagged CA‐Rac1.
-
FQuantification of ciliary disassembly assay of cells transfected with control vector, two independent Cdc42‐shRNA‐IRES‐GFP (#1, #2), or two independent Rac1‐shRNA‐IRES‐GFP (#1, #2). The KD validation of these shRNA plasmids is shown in Fig EV4D and F.
To test Cdc42's role in ciliary resorption, we showed that serum re‐addition led to rapid Cdc42 activation within 1–2 h in RPE‐1 cells (Fig 5B and C). Either Tctex‐1 KD or Tctex‐1T94A overexpression significantly abrogated serum‐stimulated Cdc42 activation (Fig 5B and C), indicating that phospho(T94)Tctex‐1 is required for serum‐stimulated Cdc42 activation.
Functionally, we showed that mimicking Tctex‐1T94E overexpression by overexpressing the constitutively active (CA) variant of Cdc42 (G12V) also hastened ciliary resorption (Fig 5D). Furthermore, the expression of the CA Cdc42 variant overcame the ciliary resorption defect caused by Tctex‐1‐KD (Fig 5E). By contrast, the CA Cdc42 variant failed to rescue ANXA2 KD‐mediated ciliary resorption inhibition (Fig EV4B). The loss‐of‐function experiments showed that either the expression of a DN variant of Cdc42 (T17N) (Fig EV4C) or silencing Cdc42 using shRNA (Figs 5F and EV4D) significantly blocked ciliary resorption. These results collectively placed Cdc42 downstream of Tctex‐1 and upstream of ANXA2 in the serum‐stimulated ciliary resorption pathway.
Since previous studies showed that Tctex‐1 activates Rac1 (but not RhoA) in growth cones 29, we tested whether Rac1 is also involved in ciliary resorption using both gain‐of‐function and loss‐of‐function approaches. Unlike the CA Cdc42 variant, the CA Rac1 variant failed to accelerate ciliary resorption (Fig EV4E) nor to rescue the ciliary resorption defect induced by Tctex‐1 KD (Fig 5E). Furthermore, overexpressing the DN Rac1 variant (Fig EV4C) or silencing Rac1 (Figs 5F and EV4F) failed to significantly affect either the assembly or disassembly of primary cilia. These results together support a pivotal role for Tctex‐1‐regulated Cdc42 activation in serum‐stimulated ciliary resorption.
CME is actively involved in serum‐stimulated ciliary resorption
Finally, we addressed the issue of whether CME is essential for ciliary resorption. In support of this notion, we showed that RPE‐1 cells with the clathrin heavy chain suppressed, using two validated shRNAs (Fig EV4G), had compromised ciliary resorption but normal ciliary assembly (Fig 6A). Clathrin heavy chain KD also effectively blocked the accelerated ciliary resorption caused by Tctex‐1T94E (Fig 6B), consistent with the idea that endocytosis is downstream of phospho(T94)Tctex‐1 in ciliary resorption. Furthermore, treating starved cells with dynasore 1 h before serum re‐addition almost completely blocked ciliary resorption (Fig 6C).
Figure 6. The role of CME and a working model of ciliary resorption.
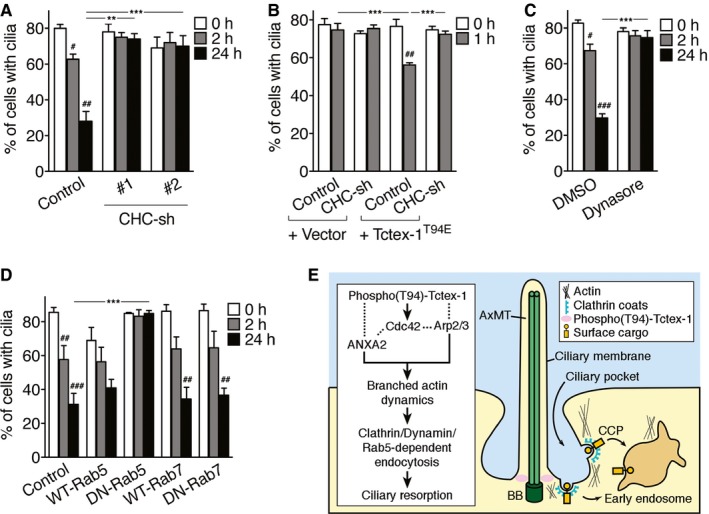
- Quantification of ciliary disassembly assay of cells transfected with GFP alone (control), clathrin heavy chain (CHC)‐shRNA#1‐IRES‐GFP, or CHC‐shRNA#2‐IRES‐GFP. A histogram shows the percentages of GFP+ cells expressing cilia. The KD validation of these shRNA plasmids is shown in Fig EV4G.
- Genetic interaction between Tctex‐1 and clathrin heavy chain (CHC) in ciliary resorption. Quantification of ciliary disassembly assay of cells transfected with indicated plasmid mixtures. Control and vector represent GFP and pcDNA3 plasmid, respectively.
- Starved RPE‐1 cells were treated with DMSO or dynasore for 1 h before and during the serum treatment. Percentages of cells, harvested at the indicated time points, expressing cilia are shown.
- RPE‐1 cells were co‐transfected with GFP together with Flag‐tagged Rab5, GFP‐tagged Rab7 variants, or pcDNA3 (control), and followed by ciliary assembly/disassembly assays. Percentages of GFP+ cells expressing cilia are shown.
- Diagram depicting the model in which phospho(T94)‐Tctex‐1 activates Cdc42. The downstream effectors, Arp2/3 and ANXA2, regulate the branched actin dynamics and clathrin‐, dynamin‐, and Rab5‐dependent endocytosis at CiPo membrane sites. AxMT, axonemal microtubule; BB, basal body; CCP, clathrin‐coated pit.
Rab5GTPase is known to regulate clathrin‐coated vesicle‐mediated transport from the plasma membrane to the early endosome as well as homotypic fusion between early endosomes 43, 44. In further support of our model, we showed that while the expression of WT Rab5 did not affect either the assembly or disassembly of the cilia, the expression of a GTP‐deficient DN mutant Rab5 (S34N) specifically blocked the ciliary resorption without affecting ciliogenesis (Fig 6D). In contrast, overexpressing either WT or DN mutant Rab7 (T22N), which perturbs Rab7's role in the late endocytic trafficking pathway 45, did not affect ciliary dynamics during either the assembly or disassembly process (Fig 6D).
Discussion
Ciliary resorption represents a concerted effort coordinated by multiple processes: the disassembly of axonemal microtubules, the blockage of ciliary (re)assembly, and the removal of ciliary (lumen, membrane) components 21, 23. The temporal relationship, interplay, and relative importance of each of these events are not well understood. There has been substantial progress in our understanding of the signaling pathway involved in ciliary axonemal disassembly, particularly the kinases that participate in this pathway (e.g., AuroraA, Plk1, Nek2) 32, 46, 47. However, our current knowledge of the cellular machinery involved in ciliary resorption lags behind what we know about ciliogenesis. In this paper, we show that phospho(T94)Tctex‐1 regulates ciliary resorption through a process requires actin polymerization. Inhibiting actin polymerization (by CytoD) suppresses Tctex‐1T94E‐accelerated ciliary resorption, whereas stimulating actin polymerization (by jasplakinolide or Cdc42) overcomes the Tctex‐1 KD caused ciliary resorption defect. We show that Tctex‐1 directly binds to F‐actin, and forms multivalent, cooperative protein–protein interactions with three actin polymerization regulators: ANXA2, ARPC2, and Cdc42. Perturbing the expression and/or function of either ANXA2, ARPC2, or Cdc42 blocks ciliary resorption as well. The epistasis analyses further suggest that Cdc42, Arp2/3, and ANXA2 are all downstream of phospho(T94)Tctex‐1 in the process of ciliary resorption (Fig 6E).
The present study shows that Tctex‐1 is required for serum‐stimulated Cdc42 activation. Like Tctex‐1 KD, Tctex‐1T94A suppresses ciliary resorption and serum‐stimulated Cdc42 activation. Tctex‐1, which lacks a Dbl homology domain 48, is unlikely to be a guanine exchange factor itself. We found that, compared to WT Tctex‐1, Tctex‐1T94A and Tctex‐1T94E have, respectively, higher and lower binding to Cdc42 and Arp3. One simple explanation for these observations is that Tctex‐1 is a dynein cargo adaptor, which is required for the periciliary targeting of Cdc42; however, the GTPase activity of Cdc42 can only occur after its release from dynein and Tctex‐1. Therefore, it is tempting to propose that the phospho‐dead Tctex‐1T94A replaces endogenous Tctex‐1 and concurrently hampers the production of phospho(T94)Tctex‐1. As a result, Tctex‐1T94A‐expressing cells had Cdc42 locked onto the dynein complex, impeding its activation and its effects on actin polymerization. Furthermore, we showed that neither the activation nor suppression of Rac1 detectably affects ciliary resorption. This indicates that the role of Tctex‐1 in ciliary resorption occurs through selective cooperation with Cdc42 but not Rac1. Delineating the spatial relationship of Tctex‐1 and activated Cdc42 in the periciliary region will aid in validating our working model in the future.
Actin polymerization is known to participate in CME by coordinating membrane invagination, vesicle pinching off, and/or the transporting of vesicles away from the plasma membrane and to the early endosome 49. We observed that several signs of CiPo membrane endocytosis, including CiPo membrane remodeling, the periciliary activation of p‐SMAD2/3, and the periciliary uptake of transferrin, take place shortly after serum re‐addition (0.5–1 h) and prior to the first phase of ciliary axonemal disassembly. Congruently, we show that approaches that block CME (i.e., dynasore treatment, KD of clathrin heavy chain) effectively inhibit ciliary resorption. These observations collectively support a model in which phospho(T94)Tctex‐1 regulates branched actin assembly, and the resulting CME induces ciliary resorption (Fig 6E).
The results of the kinetics study strongly argue that CME does not simply play a passive role (e.g., by removing the excess ciliary membrane components after axonemal microtubule disassembly). Rather, it has an active and causal role in priming ciliary resorption. It is now widely recognized that endocytosis goes beyond the inactivation of surface signaling, but rather entails the organizing of a complex signaling circuit in the “signaling endosome” 50. Ciliary resorption could be a net “output” of the activated periciliary signaling endosome; this concept further expands the increasingly diversified roles assigned to endocytosis. Further investigation is needed to decipher whether sequestration of any particular component(s) from the (peri)ciliary membrane and/or from the CiPo‐surrounded extracellular milieu is critical to drive the disassembly of ciliary axonemal microtubules. Recent studies showed that F‐actin polymerization is also required for distal ciliary decapitation (shedding, ectocytosis) ~2–4 h after serum or ligand stimulation 51, 52. While this and the current studies point to actin's importance in modulating ciliary dynamics, the relationship between actin's involvement in ciliary membrane endocytosis and ectocytosis remained to be determined.
Tctex‐1's ciliary resorption function is causally linked to the G1‐S transition during the cell cycle 20. Coincidently, the expression level of ANXA2 is cell cycle‐dependent, peaking at the G1‐S border 53. Furthermore, the disruption of Cdc42 or actin filaments also leads to G1 arrest 54, 55, 56, 57, 58. Future investigation is warranted to test whether the regulation of the cell cycle by Cdc42 and actin is related to cilium‐mediated cell signaling.
Materials and Methods
Reagents
All chemicals were purchased from Sigma unless otherwise mentioned. The following antibodies were used: Ac‐Tub mouse IgG2b antibody (Sigma T6793; IF: 1:2,000), γ‐tubulin mouse IgG1 antibody (Sigma T6557; IF: 1:1,000), β‐actin rabbit antibody (Sigma A5316; IB: 1:10,000), β‐actin mouse antibody (Sigma A5441; IB: 1:1,000), Flag M2 mouse antibody (Sigma F1804; IB: 1:3,000; 1 μg for immunoprecipitation), ARPC2 rabbit antibody (Millipore 07‐227; IB: 1:2,000), clathrin heavy chain rabbit antibody (Abcam ab21679; IB: 1:1,000), GFP chicken antibody (Abcam ab13970; IB: 1:2,000), ANXA2 mouse antibody (BD bioscience 610069; IB: 1:1,000), Cdc42 mouse antibody (BD bioscience 610929; IB: 1:500), Rac1 mouse antibody (BD bioscience 610650; IB: 1:1,000), Cdc42 mouse antibody (Cytoskeleton ACD03; IB: 1:500), His mouse antibody (Novagen 70796‐3; IB: 1:4,000), p‐SMAD2/3 rabbit monoclonal antibody (Cell Signaling 8828, IB: 1:2,000), p‐SMAD2/3 goat antibody (Santa Cruz sc‐11769, IF: 1:100), SMAD2/3 rabbit monoclonal antibody (Cell Signaling 8685, IB: 1:2,000), mCherry goat antibody (Sicgen AB0040‐200; IB: 1:3,000), HA mouse (Covance MMS‐101P; 1 μg for immunoprecipitation), and affinity‐purified Tctex‐1 mouse antibody (homemade 20; IB: 1:1,000). Alexa‐dye‐conjugated secondary antibodies, biotinylated anti‐IgG2b, and CF488A‐conjugated anti‐chicken IgY were purchased from Thermo Scientific, Jackson ImmunoResearch, and Biotium, respectively.
The expression plasmids used in this paper were as follows: GFP‐F (pAcGFP1‐F; TaKaRa‐Clontech); HA‐tagged Cdc42‐G12V, Cdc42‐T17N, Rac1‐G12V, or Rac1‐T17N (Guthrie cDNA Resource Center); GFP‐ANXA2 (gift from Dr. Kathleen Hajjar; 59), Arp3‐mCherry (Addgene 27682; 60), GFP‐Rab7‐WT, GFP‐Rab7‐Q67L, GFP‐Rab7‐T22N (gift from Dr. Colin Parrish 61); GFP‐Tctex‐1T94E, Flag‐Tctex‐1, Flag‐Tctex‐1T94A, Flag‐Tctex‐1T94E, Tctex‐1 shRNA‐IRES‐GFP, Tctex‐1‐shRNA 20, Flag‐Rab5, Flag‐Rab5‐Q79L, and Flag‐Rab5‐S34N 62. The targeting sequences of shRNA were synthesized, annealed, and inserted into pCAG‐IRES‐GFP control plasmid, so that the targeted cells can be identified by the co‐expressed GFP. Sequences used were as follows: human ARPC2 (#1; 5′‐GGG ATG ATG AGA CCA TGT ATG‐3′, #2: 5′‐GGG TGA CAA CAT TGG CTA CAT‐3′), human ANXA2 (#1; 5′‐GGG CCT ATT GAA GAC ACC TGC‐3′, #2; 5′‐GGG ACG CGA GAT AAG GTC CTG A‐3′), human clathrin heavy chain (#1; 5′‐GGG CTG TGA GGA GCC TGC TAC‐3′, #2; 5′‐GGG AGC TAT GCA GCT ATA TTC‐3′), human Cdc42 (#1; 5′‐GGG CAA GAG GAT TAT GAC AGA‐3′, #2; 5′‐GGG TGC CTG AGA TAA CTC ACC A‐3′), and human Rac1 (#1; 5′‐GGG CTT ATG GGA TAC AGC TGG A‐3′, #2; 5′‐GGG ATG ATA AAG ACA CGA TCG‐3′). Purified untagged Tctex‐1 63 and His‐tagged ANXA2 64 were gift from Drs. Mingjie Zhang and Kathy Hajjar, respectively.
Ciliary assembly/disassembly assay
The cilium assembly and disassembly assays were carried out as previously described 20. Briefly, RPE‐1 cells (ATCC CRL‐4000, gift from Steve Doxsey) were serum‐starved for 36 h to induce ciliogenesis; serum was then added back to the medium to trigger ciliary resorption. For chemical treatment, CytoD (0.5 μM in DMSO), dynasore (80 μM in DMSO), or DMSO was included in the medium in the last 1 h of starvation as well as after serum re‐addition until the time of harvest. Jasplakinolide (20 nM in DMSO, Merck) was included in the last 15 min of starvation and thereafter. In some experiments, cells were transfected using Nucleofector (Lonza) or Neon transfection system (Thermo Fisher Scientific), and subjected to serum starvation ~16 h after transfection for ciliary assembly/disassembly. Cells transfected with more than one plasmid were routinely immunostained 24 h post‐transfection to confirm that the co‐transfection efficiency was > 90%. The number of cells expressing Ac‐Tub (see staining protocol below) was counted under epifluorescent microscopy in a double‐blind fashion. In the experiments involving transfection, only transfected cells expressing GFP (encoded by one of the plasmids) were counted. More than 100 cells were counted in each experiment, and at least three independent experiments were performed for each condition. Confocal microscope images were acquired with a 63× objective on either a Leica TCS SP2 spectral confocal system or Zeiss LSM 780 confocal microscope enabling the acquisition of images at the z‐interval of 0.2 μm.
Immunostaining, transferrin uptake, and GFP‐F imaging assays
To stain primary cilia, cells were fixed by 4% paraformaldehyde (PFA; Electron Microscopy Sciences) in PBSc/m (phosphate‐buffered saline supplemented with 0.2 mM Ca2+ and 2 mM Mg2+) for 10 min. Whenever γ‐tubulin was co‐labeled, the PFA‐fixed cells were further treated with methanol for 30 s at −20°C. For p‐SMAD2/3 staining, methanol (−20°C, 5 min) was used for fixation. All fixed cells were quenched (50 mM NH4Cl, 10 min), blocked (0.5% BSA, 30 min), and incubated with primary antibodies for 60 min, followed by Alexa‐dye‐conjugated secondary antibodies for 45 min.
A transferrin uptake assay was carried out as described 5. Briefly, starved RPE‐1 cells were incubated with 25 μg/ml Alexa 594‐conjugated transferrin in the presence of 10 nM IGF‐1 and 0.5% BSA at 37°C for various time periods. The cells were quickly rinsed with ice‐cold PBSc/m and then mild acid wash buffer (500 mM NaCl, 0.5% acetic acid) before 4% PFA fixation and Ac‐Tub immunostaining.
To visualize the transfected GFP‐F, cells were pre‐extracted by 0.05% saponin‐containing PMEG buffer (80 mM PIPES, 1 mM EGTA, 3 mM MgCl2, 30% glycerol, pH 6.9) for 1 min at room temperature and then fixed by 3% PFA in PMEG buffer 16. SR‐SIM images were acquired with Nikon SR Apo TIRF 100×/1.49 oil objective and iXon3 EMCCD camera (DU‐897E, Andor Technology) on a Nikon N‐SIM system with excitation laser light of 405, 488, 561, and 640 nm wavelengths. The images were reconstructed using NIS‐Elements AR software (Nikon). For quantification of periciliary GFP‐F signal, the total fluorescence of periciliary GFP‐F was quantified in the projection confocal images of 0.8‐μm‐thick Z‐series sections of cilium‐containing regions (x = 6 μm, y = 6 μm) in randomly selected cells using NIH ImageJ 64 software. GFP‐F+ membrane tubules that were connected to but not closely opposing to or overlapping with the Ac‐Tub labeling were considered as a periciliary signal. All experiments were repeated at least three times, and the numbers of the cells scored were described in figure legends. For presentation purposes, the brightness of the images was adjusted by Photoshop Elements 12 software (Adobe Systems).
Immunoprecipitation, immunoblotting, and proteomics analysis
Co‐immunoprecipitation was carried out in 293T cells (gift from Jeremy Nathans) that were transfected with indicated plasmids. In these experiments, protein extracts were prepared using lysis buffer (50 mM Tris–HCl, pH 7.4, 150 mM NaCl, 0.5% NP‐40, 0.5% Na‐deoxycholate, 0.5% CHAPS, 1 mM EGTA, 5% glycerol, and freshly added proteinase inhibitor cocktails, phosphatase inhibitors, and 1 mM PMSF). After centrifugation at 15,000 × g for 15 min at 4°C, the post‐nuclear supernatants were precleared with Dynabeads Protein G (Thermo Fisher Scientific) for 1 h at 4°C, and then subjected to immunoprecipitation as directed by the manufacturer's instructions. The binding reaction was carried out overnight at 4°C, followed by five washes using the same lysis buffer. The proteins were eluted using Laemmli buffer, separated by SDS–PAGE, and detected by immunoblotting. All immunoblotting was carried out using a standard protocol 20 and quantified by Odyssey Infrared Scanner (LI‐COR) or ChemiDoc XRS+/Image Lab software (Bio‐Rad).
RPE‐1 stable lines expressing GFP‐Tctex‐1 or GFP alone were selected and maintained in G418‐containing medium. After serum starvation and 2‐h serum re‐addition, the cell lysates (9 mg) were subjected to immunoprecipitation by anti‐GFP rabbit antibody (gift from Dr. Brian T. Chait, Rockefeller University) covalently conjugated to Dynabeads M‐270 Epoxy (Thermo Fisher). The beads were washed and then eluted by ammonium hydroxide. The elutes were lyophilized, dissolved in sample buffer, and run on 10% SDS gel followed by silver staining.
The GFP‐Tctex‐1‐specific bands were cut into small pieces followed by trypsin digestion. Peptides were then subjected to liquid chromatogram and quadrupole/time‐of‐flight mass spectrometer (QSTAR, Applied Biosystems) as described previously 65.
F‐actin co‐sedimentation and Cdc42 activation
For co‐sedimentation assay, actin subunits (> 99% pure; Cytoskeleton, cat# AKL99) were polymerized according to the manufacturer's instructions. Purified recombinant proteins were incubated with polymerized F‐actin in reaction buffer (5 mM Tris–HCl, pH 8.0, 100 mM NaCl, 0.2 mM CaCl2, 0.2 mM ATP) at room temperature for 1 h. The reaction was then spun down at ~120,000 × g in a LTA‐100.3 rotor for 50 min at room temperature. Equivalent fractions of supernatant and pellet were analyzed by SDS–PAGE followed by immunoblotting (or Ponceau S staining for actin).
The Cdc42 activity assay was carried out according to the manufacturer's manual (Cytoskeleton, cat# BK034‐S). Briefly, samples containing equivalent amounts of protein lysates were incubated with PAK‐PBD beads (1 h, 4°C) to pull down the active form of Cdc42. The active and total Cdc42 (in total cell lysates) were detected by anti‐Cdc42 antibody using immunoblotting assays.
Statistics
Statistical analysis was performed with GraphPad Prism v5.0 (GraphPad Software). Data are presented as the mean ± s.e.m. from at least three representative independent experiments. One‐way analysis of variance (ANOVA) was followed by Tukey's test (as a post hoc test); two‐way ANOVA was followed by Bonferroni's test (as a post hoc test); Student's t‐test or chi‐square test was performed. A P‐value < 0.05 was considered significant.
Author contributions
MS, TY, and C‐HS conceived and designed the experiments, supervised the project, and wrote the manuscript. MS, WO, K‐SH, J‐ZC, and VS designed the study, performed the experiments, and analyzed the data. TK, F‐YW, and KT performed the proteomic analysis.
Conflict of interest
The authors declare that they have no conflict of interest.
Supporting information
Expanded View Figures PDF
Table EV1
Source Data for Expanded View
Review Process File
Source Data for Figure 3
Source Data for Figure 4
Source Data for Figure 5
Acknowledgements
This work is supported by NIH RO1 EY11307, EY016805, Starr Foundation, and Research To Prevent Blindness (to C.‐H. S.); Grant‐in‐Aid for Scientific Research from the Japan Society for Promotion of Science (No. 23770136 and No. 15K20856 to M.S., and No. 15H04850 to K.T.) and Takeda Science Foundation (to M.S.); and START program from Japan Science and Technology Agency (to K.T.). We are grateful to our colleagues for sharing reagents. We would also like to acknowledge the Biomedical Research Core (Tohoku University Graduate School of Medicine) and Mrs. Sayuri Saito for technical support.
EMBO Reports (2017) 18: 1460–1472
Contributor Information
Masaki Saito, Email: saimasa@med.tohoku.ac.jp.
Ching‐Hwa Sung, Email: chsung@med.cornell.edu.
References
- 1. Waters AM, Beales PL (2011) Ciliopathies: an expanding disease spectrum. Pediatr Nephrol 26: 1039–1056 [DOI] [PMC free article] [PubMed] [Google Scholar]
- 2. Sung CH, Leroux MR (2013) The roles of evolutionarily conserved functional modules in cilia‐related trafficking. Nat Cell Biol 15: 1387–1397 [DOI] [PMC free article] [PubMed] [Google Scholar]
- 3. Molla‐Herman A, Ghossoub R, Blisnick T, Meunier A, Serres C, Silbermann F, Emmerson C, Romeo K, Bourdoncle P, Schmitt A, et al (2010) The ciliary pocket: an endocytic membrane domain at the base of primary and motile cilia. J Cell Sci 123: 1785–1795 [DOI] [PubMed] [Google Scholar]
- 4. Clement CA, Ajbro KD, Koefoed K, Vestergaard ML, Veland IR, Henriques de Jesus MP, Pedersen LB, Benmerah A, Andersen CY, Larsen LA, et al (2013) TGF‐β signaling is associated with endocytosis at the pocket region of the primary cilium. Cell Rep 3: 1806–1814 [DOI] [PubMed] [Google Scholar]
- 5. Yeh C, Li A, Chuang JZ, Saito M, Caceres A, Sung CH (2013) IGF‐1 activates a cilium‐localized noncanonical Gβγ signaling pathway that regulates cell‐cycle progression. Dev Cell 26: 358–368 [DOI] [PMC free article] [PubMed] [Google Scholar]
- 6. Benmerah A (2013) The ciliary pocket. Curr Opin Cell Biol 25: 78–84 [DOI] [PubMed] [Google Scholar]
- 7. Kim J, Lee JE, Heynen‐Genel S, Suyama E, Ono K, Lee K, Ideker T, Aza‐Blanc P, Gleeson JG (2010) Functional genomic screen for modulators of ciliogenesis and cilium length. Nature 464: 1048–1051 [DOI] [PMC free article] [PubMed] [Google Scholar]
- 8. Avasthi P, Onishi M, Karpiak J, Yamamoto R, Mackinder L, Jonikas MC, Sale WS, Shoichet B, Pringle JR, Marshall WF (2014) Actin is required for IFT regulation in Chlamydomonas reinhardtii . Curr Biol 24: 2025–2032 [DOI] [PMC free article] [PubMed] [Google Scholar]
- 9. Benesch S, Polo S, Lai FP, Anderson KI, Stradal TE, Wehland J, Rottner K (2005) N‐WASP deficiency impairs EGF internalization and actin assembly at clathrin‐coated pits. J Cell Sci 118: 3103–3115 [DOI] [PubMed] [Google Scholar]
- 10. Cao J, Shen Y, Zhu L, Xu Y, Zhou Y, Wu Z, Li Y, Yan X, Zhu X (2012) miR‐129‐3p controls cilia assembly by regulating CP110 and actin dynamics. Nat Cell Biol 14: 697–706 [DOI] [PubMed] [Google Scholar]
- 11. Pitaval A, Tseng Q, Bornens M, Thery M (2010) Cell shape and contractility regulate ciliogenesis in cell cycle‐arrested cells. J Cell Biol 191: 303–312 [DOI] [PMC free article] [PubMed] [Google Scholar]
- 12. Duleh SN, Welch MD (2010) WASH and the Arp2/3 complex regulate endosome shape and trafficking. Cytoskeleton (Hoboken) 67: 193–206 [DOI] [PMC free article] [PubMed] [Google Scholar]
- 13. Gomez TS, Billadeau DD (2009) A FAM21‐containing WASH complex regulates retromer‐dependent sorting. Dev Cell 17: 699–711 [DOI] [PMC free article] [PubMed] [Google Scholar]
- 14. Rotty JD, Wu C, Bear JE (2013) New insights into the regulation and cellular functions of the ARP2/3 complex. Nat Rev Mol Cell Biol 14: 7–12 [DOI] [PubMed] [Google Scholar]
- 15. Puthenveedu MA, Lauffer B, Temkin P, Vistein R, Carlton P, Thorn K, Taunton J, Weiner OD, Parton RG, von Zastrow M (2010) Sequence‐dependent sorting of recycling proteins by actin‐stabilized endosomal microdomains. Cell 143: 761–773 [DOI] [PMC free article] [PubMed] [Google Scholar]
- 16. Derivery E, Sousa C, Gautier JJ, Lombard B, Loew D, Gautreau A (2009) The Arp2/3 activator WASH controls the fission of endosomes through a large multiprotein complex. Dev Cell 17: 712–723 [DOI] [PubMed] [Google Scholar]
- 17. Tucker RW, Pardee AB, Fujiwara K (1979) Centriole ciliation is related to quiescence and DNA synthesis in 3T3 cells. Cell 17: 527–535 [DOI] [PubMed] [Google Scholar]
- 18. Pan J, Snell W (2007) The primary cilium: keeper of the key to cell division. Cell 129: 1255–1257 [DOI] [PubMed] [Google Scholar]
- 19. Gabriel E, Wason A, Ramani A, Gooi LM, Keller P, Pozniakovsky A, Poser I, Noack F, Telugu NS, Calegari F, et al (2016) CPAP promotes timely cilium disassembly to maintain neural progenitor pool. EMBO J 35: 803–819 [DOI] [PMC free article] [PubMed] [Google Scholar]
- 20. Li A, Saito M, Chuang JZ, Tseng YY, Dedesma C, Tomizawa K, Kaitsuka T, Sung CH (2011) Ciliary transition zone activation of phosphorylated Tctex‐1 controls ciliary resorption, S‐phase entry and fate of neural progenitors. Nat Cell Biol 13: 402–411 [DOI] [PMC free article] [PubMed] [Google Scholar]
- 21. Hsu KS, Chuang JZ, Sung CH (2017) The biology of ciliary dynamics. Cold Spring Harb Perspect Biol 9: a027904 [DOI] [PMC free article] [PubMed] [Google Scholar]
- 22. Kim S, Tsiokas L (2011) Cilia and cell cycle re‐entry: more than a coincidence. Cell Cycle 10: 2683–2690 [DOI] [PMC free article] [PubMed] [Google Scholar]
- 23. Liang Y, Meng D, Zhu B, Pan J (2016) Mechanism of ciliary disassembly. Cell Mol Life Sci 73: 1787–1802 [DOI] [PMC free article] [PubMed] [Google Scholar]
- 24. Izawa I, Goto H, Kasahara K, Inagaki M (2015) Current topics of functional links between primary cilia and cell cycle. Cilia 4: 12 [DOI] [PMC free article] [PubMed] [Google Scholar]
- 25. Tai AW, Chuang J‐Z, Bode C, Wolfrum U, Sung C‐H (1999) Rhodopsin's carboxy‐terminal cytoplasmic tail acts as a membrane receptor for cytoplasmic dynein by binding to the dynein light chain Tctex‐1. Cell 97: 877–887 [DOI] [PubMed] [Google Scholar]
- 26. Yano H, Lee FS, Kong H, Chuang JZ, Arevalo JC, Perez P, Sung CH, Chao MV (2001) Association of Trk neurotrophin receptors with components of the cytoplasmic dynein motor. J Neurosci 21: RC125 [DOI] [PMC free article] [PubMed] [Google Scholar]
- 27. Machado RD, Rudarakanchana N, Atkinson C, Flanagan JA, Harrison R, Morrell NW, Trembath RC (2003) Functional interaction between BMPR‐II and Tctex‐1, a light chain of Dynein, is isoform‐specific and disrupted by mutations underlying primary pulmonary hypertension. Hum Mol Genet 12: 3277–3286 [DOI] [PubMed] [Google Scholar]
- 28. Lai M, Wang F, Rohan JG, Maeno‐Hikichi Y, Chen Y, Zhou Y, Gao G, Sather WA, Zhang JF (2005) A tctex1‐Ca2+ channel complex for selective surface expression of Ca2+ channels in neurons. Nat Neurosci 8: 435–442 [DOI] [PubMed] [Google Scholar]
- 29. Chuang JZ, Yeh TY, Bollati F, Conde C, Canavosio F, Caceres A, Sung CH (2005) The dynein light chain Tctex‐1 has a dynein‐independent role in actin remodeling during neurite outgrowth. Dev Cell 9: 75–86 [DOI] [PMC free article] [PubMed] [Google Scholar]
- 30. Sachdev P, Menon S, Kastner DB, Chuang JZ, Yeh TY, Conde C, Caceres A, Sung CH, Sakmar TP (2007) G protein βγ subunit interaction with the dynein light‐chain component Tctex‐1 regulates neurite outgrowth. EMBO J 26: 2621–2632 [DOI] [PMC free article] [PubMed] [Google Scholar]
- 31. Liu C, Chuang JZ, Sung CH, Mao Y (2015) A dynein independent role of Tctex‐1 at the kinetochore. Cell Cycle 14: 1379–1388 [DOI] [PMC free article] [PubMed] [Google Scholar]
- 32. Pugacheva EN, Jablonski SA, Hartman TR, Henske EP, Golemis EA (2007) HEF1‐dependent Aurora A activation induces disassembly of the primary cilium. Cell 129: 1351–1363 [DOI] [PMC free article] [PubMed] [Google Scholar]
- 33. Bubb MR, Senderowicz AM, Sausville EA, Duncan KL, Korn ED (1994) Jasplakinolide, a cytotoxic natural product, induces actin polymerization and competitively inhibits the binding of phalloidin to F‐actin. J Biol Chem 269: 14869–14871 [PubMed] [Google Scholar]
- 34. Macia E, Ehrlich M, Massol R, Boucrot E, Brunner C, Kirchhausen T (2006) Dynasore, a cell‐permeable inhibitor of dynamin. Dev Cell 10: 839–850 [DOI] [PubMed] [Google Scholar]
- 35. Morel E, Parton RG, Gruenberg J (2009) Annexin A2‐dependent polymerization of actin mediates endosome biogenesis. Dev Cell 16: 445–457 [DOI] [PubMed] [Google Scholar]
- 36. Hayes MJ, Shao D, Bailly M, Moss SE (2006) Regulation of actin dynamics by annexin 2. EMBO J 25: 1816–1826 [DOI] [PMC free article] [PubMed] [Google Scholar]
- 37. Pollard TD (2007) Regulation of actin filament assembly by Arp2/3 complex and formins. Annu Rev Biophys Biomol Struct 36: 451–477 [DOI] [PubMed] [Google Scholar]
- 38. Merrifield CJ, Perrais D, Zenisek D (2005) Coupling between clathrin‐coated‐pit invagination, cortactin recruitment, and membrane scission observed in live cells. Cell 121: 593–606 [DOI] [PubMed] [Google Scholar]
- 39. Machesky LM, Mullins RD, Higgs HN, Kaiser DA, Blanchoin L, May RC, Hall ME, Pollard TD (1999) Scar, a WASp‐related protein, activates nucleation of actin filaments by the Arp2/3 complex. Proc Natl Acad Sci USA 96: 3739–3744 [DOI] [PMC free article] [PubMed] [Google Scholar]
- 40. Miki H, Yamaguchi H, Suetsugu S, Takenawa T (2000) IRSp53 is an essential intermediate between Rac and WAVE in the regulation of membrane ruffling. Nature 408: 732–735 [DOI] [PubMed] [Google Scholar]
- 41. Rohatgi R, Ma L, Miki H, Lopez M, Kirchhausen T, Takenawa T, Kirschner MW (1999) The interaction between N‐WASP and the Arp2/3 complex links Cdc42‐dependent signals to actin assembly. Cell 97: 221–231 [DOI] [PubMed] [Google Scholar]
- 42. Martin‐Belmonte F, Gassama A, Datta A, Yu W, Rescher U, Gerke V, Mostov K (2007) PTEN‐mediated apical segregation of phosphoinositides controls epithelial morphogenesis through Cdc42. Cell 128: 383–397 [DOI] [PMC free article] [PubMed] [Google Scholar]
- 43. Bucci C, Parton RG, Mather IH, Stunnenberg H, Simons K, Hoflack B, Zerial M (1992) The small GTPase rab5 functions as a regulatory factor in the early endocytic pathway. Cell 70: 715–728 [DOI] [PubMed] [Google Scholar]
- 44. Gorvel JP, Chavrier P, Zerial M, Gruenberg J (1991) Rab5 controls early endosome fusion in vitro. Cell 64: 915–925 [DOI] [PubMed] [Google Scholar]
- 45. Bucci C, Thomsen P, Nicoziani P, McCarthy J, van Deurs B (2000) Rab7: a key to lysosome biogenesis. Mol Biol Cell 11: 467–480 [DOI] [PMC free article] [PubMed] [Google Scholar]
- 46. Kim S, Lee K, Choi JH, Ringstad N, Dynlacht BD (2015) Nek2 activation of Kif24 ensures cilium disassembly during the cell cycle. Nat Commun 6: 8087 [DOI] [PMC free article] [PubMed] [Google Scholar]
- 47. Wang G, Chen Q, Zhang X, Zhang B, Zhuo X, Liu J, Jiang Q, Zhang C (2013) PCM1 recruits Plk1 to the pericentriolar matrix to promote primary cilia disassembly before mitotic entry. J Cell Sci 126: 1355–1365 [DOI] [PubMed] [Google Scholar]
- 48. Hart MJ, Eva A, Evans T, Aaronson SA, Cerione RA (1991) Catalysis of guanine nucleotide exchange on the CDC42Hs protein by the dbl oncogene product. Nature 354: 311–314 [DOI] [PubMed] [Google Scholar]
- 49. Kaksonen M, Toret CP, Drubin DG (2006) Harnessing actin dynamics for clathrin‐mediated endocytosis. Nat Rev Mol Cell Biol 7: 404–414 [DOI] [PubMed] [Google Scholar]
- 50. Scita G, Di Fiore PP (2010) The endocytic matrix. Nature 463: 464–473 [DOI] [PubMed] [Google Scholar]
- 51. Phua SC, Chiba S, Suzuki M, Su E, Roberson EC, Pusapati GV, Setou M, Rohatgi R, Reiter JF, Ikegami K, et al (2017) Dynamic remodeling of membrane composition drives cell cycle through primary cilia excision. Cell 168: 264–279.e215 [DOI] [PMC free article] [PubMed] [Google Scholar]
- 52. Nager AR, Goldstein JS, Herranz‐Perez V, Portran D, Ye F, Garcia‐Verdugo JM, Nachury MV (2017) An actin network dispatches ciliary GPCRs into extracellular vesicles to modulate signaling. Cell 168: 252–263.e214 [DOI] [PMC free article] [PubMed] [Google Scholar]
- 53. Chiang Y, Schneiderman MH, Vishwanatha JK (1993) Annexin II expression is regulated during mammalian cell cycle. Cancer Res 53: 6017–6021 [PubMed] [Google Scholar]
- 54. Lamarche N, Tapon N, Stowers L, Burbelo PD, Aspenstrom P, Bridges T, Chant J, Hall A (1996) Rac and Cdc42 induce actin polymerization and G1 cell cycle progression independently of p65PAK and the JNK/SAPK MAP kinase cascade. Cell 87: 519–529 [DOI] [PubMed] [Google Scholar]
- 55. Olson MF, Ashworth A, Hall A (1995) An essential role for Rho, Rac, and Cdc42 GTPases in cell cycle progression through G1 . Science 269: 1270–1272 [DOI] [PubMed] [Google Scholar]
- 56. Villalonga P, Ridley AJ (2006) Rho GTPases and cell cycle control. Growth Factors 24: 159–164 [DOI] [PubMed] [Google Scholar]
- 57. Heng YW, Koh CG (2010) Actin cytoskeleton dynamics and the cell division cycle. Int J Biochem Cell Biol 42: 1622–1633 [DOI] [PubMed] [Google Scholar]
- 58. Reshetnikova G, Barkan R, Popov B, Nikolsky N, Chang LS (2000) Disruption of the actin cytoskeleton leads to inhibition of mitogen‐induced cyclin E expression, Cdk2 phosphorylation, and nuclear accumulation of the retinoblastoma protein‐related p107 protein. Exp Cell Res 259: 35–53 [DOI] [PubMed] [Google Scholar]
- 59. He KL, Deora AB, Xiong H, Ling Q, Weksler BB, Niesvizky R, Hajjar KA (2008) Endothelial cell annexin A2 regulates polyubiquitination and degradation of its binding partner S100A10/p11. J Biol Chem 283: 19192–19200 [DOI] [PMC free article] [PubMed] [Google Scholar]
- 60. Taylor MJ, Perrais D, Merrifield CJ (2011) A high precision survey of the molecular dynamics of mammalian clathrin‐mediated endocytosis. PLoS Biol 9: e1000604 [DOI] [PMC free article] [PubMed] [Google Scholar]
- 61. Harbison CE, Lyi SM, Weichert WS, Parrish CR (2009) Early steps in cell infection by parvoviruses: host‐specific differences in cell receptor binding but similar endosomal trafficking. J Virol 83: 10504–10514 [DOI] [PMC free article] [PubMed] [Google Scholar]
- 62. Hu Y, Chuang JZ, Xu K, McGraw TE, Sung CH (2002) SARA, a FYVE domain protein, affects Rab5‐mediated endocytosis. J Cell Sci 115: 4755–4763 [DOI] [PMC free article] [PubMed] [Google Scholar]
- 63. Mok YK, Lo KW, Zhang M (2001) Structure of Tctex‐1 and its Interaction with cytoplasmic dynein intermediate chain. J Biol Chem 276: 14067–14074 [DOI] [PubMed] [Google Scholar]
- 64. Jacovina AT, Deora AB, Ling Q, Broekman MJ, Almeida D, Greenberg CB, Marcus AJ, Smith JD, Hajjar KA (2009) Homocysteine inhibits neoangiogenesis in mice through blockade of annexin A2‐dependent fibrinolysis. J Clin Invest 119: 3384–3394 [DOI] [PMC free article] [PubMed] [Google Scholar]
- 65. Liang S, Wei FY, Wu YM, Tanabe K, Abe T, Oda Y, Yoshida Y, Yamada H, Matsui H, Tomizawa K, et al (2007) Major Cdk5‐dependent phosphorylation sites of amphiphysin 1 are implicated in the regulation of the membrane binding and endocytosis. J Neurochem 102: 1466–1476 [DOI] [PubMed] [Google Scholar]
- 66. Talbott M, Hare M, Nyarko A, Hays TS, Barbar E (2006) Folding is coupled to dimerization of Tctex‐1 dynein light chain. Biochemistry 45: 6793–6800 [DOI] [PMC free article] [PubMed] [Google Scholar]
Associated Data
This section collects any data citations, data availability statements, or supplementary materials included in this article.
Supplementary Materials
Expanded View Figures PDF
Table EV1
Source Data for Expanded View
Review Process File
Source Data for Figure 3
Source Data for Figure 4
Source Data for Figure 5