

This novel human study examined the effects of FFA elevation in the setting of hyperinsulinemia on accumulation of fat in specific types of muscle fibers. Within the context of the hyperinsulinemic-euglycemic clamp, we found that an increase of FFAs to a physiological range sufficient to reduce insulin sensitivity is associated with preferential IMCL accumulation in type 1 fibers.
Keywords: intramyocellular lipid, muscle fiber, insulin sensitivity, free fatty acid
Abstract
It is well described that increasing free fatty acids (FFAs) to high physiological levels reduces insulin sensitivity. In sedentary humans, intramyocellular lipid (IMCL) is inversely related to insulin sensitivity. Since muscle fiber composition affects muscle metabolism, whether FFAs induce IMCL accumulation in a fiber type-specific manner remains unknown. We hypothesized that in the setting of acute FFA elevation by lipid infusion within the context of a hyperinsulinemic-euglycemic clamp, IMCL will preferentially accumulate in type 1 fibers. Normal-weight participants (n = 57, mean ± SE: age 24 ± 0.6 yr, BMI 22.2 ± 0.3 kg/m2) who were either endurance trained or sedentary by self-report were recruited from the University of Minnesota (n = 31, n = 15 trained) and University of Pittsburgh (n = 26, n = 14 trained). All participants underwent a hyperinsulinemic-euglycemic clamp in the context of a 6-h infusion of either lipid or glycerol control. A vastus lateralis muscle biopsy was obtained at baseline and end-infusion (6 h). The muscle biopsies were processed and analyzed at the University of Pittsburgh for fiber type-specific IMCL accumulation by Oil-Red-O staining. Regardless of training status, acute elevation of FFAs to high physiological levels (~400–600 meq/l) increased IMCL preferentially in type 1 fibers (+35 ± 11% compared with baseline, +29 ± 11% compared with glycerol control: P < 0.05). The increase in IMCL correlated with a decline in insulin sensitivity as measured by the hyperinsulinemic-euglycemic clamp (r = −0.32, P < 0.01) independent of training status. Regardless of training status, increase of FFAs to a physiological range within the context of hyperinsulinemia shows preferential IMCL accumulation in type 1 fibers.
NEW & NOTEWORTHY This novel human study examined the effects of FFA elevation in the setting of hyperinsulinemia on accumulation of fat in specific types of muscle fibers. Within the context of the hyperinsulinemic-euglycemic clamp, we found that an increase of FFAs to a physiological range sufficient to reduce insulin sensitivity is associated with preferential IMCL accumulation in type 1 fibers.
insulin resistance plays a critical role in the development of type 2 diabetes, with skeletal muscle the largest site of insulin resistance in the human body (35). In sedentary participants, it is well described that insulin resistance correlates with intramyocellular lipid (IMCL) levels (26) and accumulation of lipid metabolites (23, 27). It is well established that increasing free fatty acid (FFA) to supraphysiological levels within the context of hyperinsulinemia is associated with development of insulin resistance (2, 3, 23). Likewise, it has been recently shown that increasing FFA levels during a hyperinsulinemic-euglycemic clamp to the high physiological range alters IMCL composition consistent with the FFA exposure (8) and reduces insulin sensitivity regardless of training status (9, 12).
Skeletal muscle contains both type 1 and type 2 fibers. Type 1 fibers have more IMCL and more mitochondria than type 2 fibers (21). Presumably, then, type 1 fibers should accumulate IMCL more readily than type 2 fibers in the setting of FFA exposure. However, whether an acute FFA elevation (9, 12) is sufficient to distribute IMCL in a fiber type-specific manner remains unknown.
The impact of training on acute IMCL accumulation also remains unknown. Endurance training is associated with higher type 1 fiber content (11, 21, 30) and higher IMCL in many (11, 21, 30, 37), but not all studies (5, 17, 19). This inconsistent observation may be related to measuring muscle lipids by extraction (5, 19) which can be confounded by extramyocellular lipid. In contrast, measurement of IMCL by histology (11, 21, 30, 37) circumvents the potential contamination by extramyocellular lipid and additionally permits fiber type-specific IMCL measurement. These findings provide a strong rationale to measure IMCL accumulation by histology to examine the effects of acute FFA elevation within the physiological range on fiber type-specific IMCL accumulation. We hypothesized that in the setting of acute FFA elevation to high physiological levels, IMCL will preferentially accumulate in type 1 fibers and trained participants will accumulate more IMCL in type 1 fibers than sedentary participants.
MATERIALS AND METHODS
Participants
The studies were conducted at the University of Minnesota (n = 31, n = 15 trained) and University of Pittsburgh (n = 26, n = 14 trained). In total, 57 participants (n = 29 trained) were used for analysis. At the University of Minnesota, participants were identified as “trained” if they self-reported participation in a running program at least 45 min/day, 5 days/wk, with a focused recruitment of recent (within 1 yr) marathon participants. At the University of Pittsburgh, participants were identified as “trained” if they self-reported participation in structured exercise 3–5 days/wk for at least 2 yr with <3 yr of interrupted training. The protocol for these two studies has been previously published (9, 12). Both studies were approved by the Institutional Review Board from their respective institutions. All participants provided written informed consent before participation.
The studies shared the following similar features: 1) recruitment of normal-weight, endurance-trained and normal-weight, sedentary participants; 2) infusion of either lipid or glycerol for 6 h in the setting of a concurrent hyperinsulinemic-euglycemic clamp; 3) measurement of fat-free mass (FFM) by DXA (GE, Fairfield CT); 4) similar protocol in preparation for the biopsy with participants abstaining from scheduled exercise for at least 48 h before admission, admission the night before the biopsy visit, and remaining NPO after 10 PM until completion of the 2nd biopsy the next day; 5) vastus lateralis muscle biopsies before and after prolonged lipid/glycerol infusion (340–360 min); and 6) measurement of IMCL and muscle fiber type at a central site (University of Pittsburgh).
Differences between the studies include the following: 1) study design (University of Minnesota: prospective interventional trial between sedentary and trained participants matched for age, sex, and BMI; University of Pittsburgh: crossover interventional trial between sedentary and trained participants): in the design of University of Minnesota study (n = 31), the subjects received either a lipid (n = 14) or glycerol (n = 17) infusion; the design of the University of Pittsburgh (n = 26) study enabled the analysis of IMCL accumulation with subject-specific declines in insulin sensitivity (see Fig. 3), as each subject received either a 6-h lipid/glycerol infusion followed by the alternate infusion several weeks later; 2) V̇o2max measurement (University of Minnesota: treadmill; University of Pittsburgh: cycle ergometer); 3) difference in measurement of insulin sensitivity [University of Minnesota, glucose infusion rate (GIR) calculated from a 3 h hyperinsulinemic-euglycemic clamp at a separate visit; University of Pittsburgh: GIR calculated from the 6 h hyperinsulinemic-euglycemic clamp during glycerol control infusion]; 4) difference in glycerol infusion (University of Minnesota: 2.25 g/100 ml at 90 ml/h; University of Pittsburgh: 1.7 g/100 ml at 90 ml/h); and 5) difference in insulin exposure when the lipid/glycerol infusion was infused within the context of the hyperinsulinemic-euglycemic clamp (University of Minnesota: 1.5 mU·kg FFM−1·min−1 for 6 h; University of Pittsburgh: 80 mU·m−2·min−1 for 6 h). A portion of the baseline demographics of the enrolled subjects has been previously published (8, 9, 12). However, the main analysis of the paper, the effects of lipid infusion on fiber type-specific IMCL change, remains novel and not yet published.
Fig. 3.

IMCL accumulation in type 1 fibers inversely correlates with insulin sensitivity. A shows a significant correlation between the decline in insulin sensitivity and increasing area stained by IMCL within type 1 fibers (LAI). B shows a similar finding. Here, the decline in insulin sensitivity correlates inversely with change in area stained by IMCL after adjustment for percent distribution of type 1 fibers (adjusted LAI). Only data from the University of Pittsburgh (n = 26) is presented, as the crossover study design (lipid vs. glycerol infusion) enabled the direct comparison of IMCL accumulation on insulin sensitivity within the same subject. GIR, glucose infusion rate.
FFA Measurements
At the University of Minnesota, the nonesterified free fatty acids (FFA) were measured with an enzymatic colorimetric assay (NEFA C, Wako). At the University of Pittsburgh, this was measured by gas chromatography flame ionization detection (24).
Muscle Biopsy Technique
Both studies used similar techniques to obtain muscle tissue for analysis. Specifically, before the lipid/glycerol infusion, a percutaneous muscle biopsy of the vastus lateralis using a Bergstrom needle was performed (9, 11). Another muscle biopsy was performed at 340–360 min of the lipid/glycerol infusion roughly 2 cm away from the first biopsy site. After acquisition of the biopsy, the tissue was trimmed of excess fat at the bedside, immediately mounted in Optimal Cutting Temperature compound [Fisher HistoPrep (SH75125D), Fisher Scientific, Waltham MA] frozen in liquid nitrogen-cooled isopentane, and stored at −80°C.
Muscle Analysis
Histochemical analysis was performed on serial sections using previously established methods at the University of Pittsburgh (11, 17). Briefly, tissue blocks from pre- and postinfusion were sectioned (10 µm) on a cryostat (cryotome e: Shandon Scientific) at −20°C and placed on individual precleaned glass slides. Slides representing 45 subjects were analyzed together to minimize staining bias. Each analysis included data from at least 100–300 total fibers. Images were visualized using a Leica microscope (Leica DM 4000B; Leica Microsystems) at 20×, digitally captured (Retiga 2000R Camera; Q Imaging), and analyzed using specialized software (Northern Eclipse, V6.0; Empix Imaging). For analysis of staining intensity, 4 to 5 images from pre- and postinfusion were captured in 16-bit grayscale and averaged.
Fiber type analysis.
Immunohistochemistry was used to determine type 1 and type 2 fiber types. Briefly, antibodies specific for type 1 (T1) fibers (A4.840, DSHB, Univ. of Iowa) or type 2 (T2) fibers (A4.74, DSHB, Univ. of Iowa) were applied. Signals for specific fibers recorded using a fluorescein isothiocyanate excitation filter (type 1) or a tetramethylrhodamine isothiocyanate excitation filter (type 2a; T2a). Type 2x fibers (T2x) were assumed to be the fiber type which did not fluoresce with either filter. Fiber type percentages were determined from manually counting observed fibers used in histochemical analysis.
Intramyocellular lipid (IMCL) content.
Lipid content was measured by Oil-Red-O staining (17). We calculated the lipid accumulation index (LAI), which is the area stained by lipid, within the specific fiber type [LAI = 100 × (area stained within specific fiber type/total area of specific fiber type)]. We also examined whether the distribution of fiber type within the sample was important, by calculating adjusted LAI, which adjusts for the percent distribution of the specific fiber type [adjusted LAI = 100 × (area stained within specific fiber type/total muscle fiber area)]. Total muscle IMCL was calculated by adding the adjusted LAI of type 1 fibers and adjusted LAI of type 2 fibers (15).
Statistical Analysis
The results from both studies were pooled for analysis. The primary outcome was the change in percent IMCL staining by Oil-Red-O (LAI, adjusted LAI). A linear mixed model was used to analyze the results between baseline and end-infusion. We also adjusted for relevant covariates including the effect of pairing, infusion effects, training status (trained vs. sedentary), fiber type, age, sex, and study site. As there was no significant effect of training on the outcome, the trained and sedentary groups were combined and the comparison was between the lipid infusion vs. glycerol control group. Results are reported as means ± SE. P < 0.05 was considered significant. The Pearson correlational coefficient was used to quantify the association between change in insulin sensitivity and IMCL. All analyses were performed using Statistical Analysis Software (version 9.3, SAS Institute, Cary, NC) with Tukey-Kramer adjustment for multiple comparisons.
RESULTS
Table 1 shows the baseline demographic information between trained and sedentary participants. Site-specific measures were described when relevant. As all of the muscle biopsies had muscle fiber typing and lipid quantification performed at the same site (University of Pittsburgh), these results were combined. As the FFA results were not significantly different between the two sites, the results were combined as well.
Table 1.
Baseline characteristics of study participants
| Characteristic | Trained (n = 29) | Sedentary (n = 28) | P Value |
|---|---|---|---|
| Female/Male | 13/16 | 13/15 | 0.90 |
| Age, yr | 25.9 (0.9) | 22.6 (0.6) | <0.01 |
| Body mass index, kg/m2 | 22.1 (0.4) | 22.3 (0.4) | 0.72 |
| V̇o2max | |||
| Absolute treadmill V̇o2max, ml/min (Minnesota) | 2,601.8 (217.1) | 1,730.7 (108.5) | <0.01 |
| Treadmill V̇o2max, ml·kg FFM−1·min−1 (Minnesota) | 61.6 (1.4) | 55.8 (1.6) | 0.01 |
| Absolute cycling V̇o2max, ml/min (Pittsburgh) | 3,815.7 (290.7) | 2,640.5 (192.6) | <0.01 |
| Cycling V̇o2max, ml·kg FFM−1·min−1 (Pittsburgh) | 70.7 (2.3) | 52.6 (1.8) | <0.01 |
| Free fatty acid levels | |||
| Baseline, μM | 386 (55) | 430 (38) | 0.51 |
| End of lipid infusion, μM | 489 (44) | 641 (62) | 0.05 |
| Insulin sensitivity | |||
| Glucose infusion rate, mg glucose infused·kg FFM−1·min−1 at the end of a 3 h clamp (Minnesota) | 12.2 (0.8) | 9.1 (0.6) | <0.01 |
| Glucose infusion rate, mg glucose infused·kg FFM−1·min−1 at the end of a 6 h clamp (Pittsburgh) | 13.4 (0.5) | 10.7 (1.0) | 0.02 |
| Muscle fiber type | |||
| Type 1 fibers, % | 47.5 (3.6) | 36.5 (2.0) | 0.01 |
| Type 2 fibers, % | 52.4 (3.6) | 63.5 (2.0) | 0.01 |
| Type 2a fibers, % | 44.3 (3.0) | 43.4 (1.5) | 0.80 |
| Type 2x fibers, % | 9.0 (2.3) | 20 (2.0) | <0.01 |
| Fiber type-specific lipid staining (LAI) | |||
| % of type 1 fibers, au | 38.3 (3.3)* | 51.3 (4.0)* | 0.01 |
| % of type 2 fibers, au | 29.4 (2.2) | 28.8 (2.9) | 0.88 |
| % of type 2a fibers, au | 29.7 (2.1) | 28.6 (2.4) | 0.72 |
| % of type 2x fibers, au | 28.1 (3.6) | 31.8 (0.1) | 0.60 |
| Fiber type specific lipid staining, considering fiber type distribution within sample (Adjusted LAI) | |||
| % of type 1 fibers, au | 18.5 (2.3)* | 18.6 (2.0)* | 0.97 |
| % of type 2 fibers, au | 13.0 (1.0) | 15 (1.6) | 0.28 |
| % of type 2a fibers, au | 12.0 (1.1) | 13.0 (1.4) | 0.59 |
| % of type 2x fibers, au | 1.6 (0.2) | 5.7 (1.0) | <0.01 |
| Total IMCL in muscle (adjusted LAI type 1 fibers + adjusted LAI type 2 fibers) | 31.4 (2.4) | 30.9 (2.4) | 0.89 |
Results are reported as means (±SE) if a continuous variable; 57 participants were available for analysis. These were derived from the University of Minnesota (n = 31, n = 15 trained) and University of Pittsburgh (n = 26, n = 14 trained). FFA, free fatty acids; FFM, fat-free mass; LAI, % area stained by lipid. LAI = 100 × (area stained within specific fiber type/total area of specific fiber type). Adjusted LAI = 100 × (area stained within specific fiber type/total muscle fiber area).
Significant difference (P < 0.05) compared with other fiber types within same training status.
Compared with the sedentary participants, the trained participants were slightly older, with higher absolute V̇o2max (ml/min) and relative V̇o2max (ml·FFM−1·min−1). FFA levels were similar between the trained and sedentary groups at baseline (Table 1). At the end of the lipid infusion, the FFA levels were in the high physiological range (489–641 μM) which was slightly higher in the sedentary group (P = 0.05). Insulin sensitivity, as measured by the GIR at the end of the hyperinsulinemic-euglycemic clamp, was higher in the trained participants than sedentary participants. Compared with sedentary participants, trained participants had more type 1 fibers, less type 2 fibers, and specifically less type 2x fibers. Regardless of training status, each group had more type 2 fibers (52–63% area stained) than type 1 fibers (37–48% of area stained). Regardless of training status, type 1 fibers had significantly more lipid (as measured by LAI or adjusted LAI) than the other fiber types. This is relevant as LAI and adjusted LAI are physiologically different. LAI uses the specific fiber type (i.e., type 1 fibers) area as the denominator. Adjusted LAI uses the total muscle fiber area (i.e., sum of all muscle fibers) as the denominator.
In particular, type 1 fibers from trained participants had significantly less lipid (LAI: 38.3% ± 3.3) than sedentary participants (LAI: 51.3% ± 4.0). However, the contribution of lipid in type 1 fibers to overall muscle lipid content (adjusted LAI) remained similar as trained participants had more type 1 fibers (% type 1 fibers: 47.5 ± 3.6) than sedentary participants (% type 1 fibers: 36.5 ± 2.0). As sedentary participants had more type 2x fibers (% type 2x fibers: 20 ± 2.0) than trained participants (% type 2x fibers: 9.0 ± 2.2), sedentary participants had higher contribution of lipid in type 2x fibers to overall muscle lipid content (adjusted LAI: 5.7 ± 1.0) than trained participants.(adjusted LAI: 1.6 ± 0.2) Total IMCL between trained and sedentary participants (adjusted LAI of type 1 fibers + adjusted LAI of type 2 fibers) was not different between trained and sedentary participants.
We examined whether fitness, as quantified by tertiles of V̇o2max, might influence fiber-specific IMCL accumulation. We accommodated for differences in V̇o2max measurement between sites by designating the highest tertile of site-specific V̇o2max of group as “fit” and the lowest tertile of site-specific V̇o2max of group as “unfit.” As no significant interaction between fitness and IMCL accumulation was noted, the results from the trained and sedentary groups were pooled in the final analysis.
Effects of Acute FFA on Total IMCL Accumulation
As noted in Fig. 1, lipid infusion was significantly increased total IMCL by 22.8% (P < 0.05). Glycerol infusion did not alter total IMCL levels. To generate Fig. 1, all subjects who received a glycerol infusion (n = 43) and all subjects who received a lipid infusion (n = 40) were used.
Fig. 1.
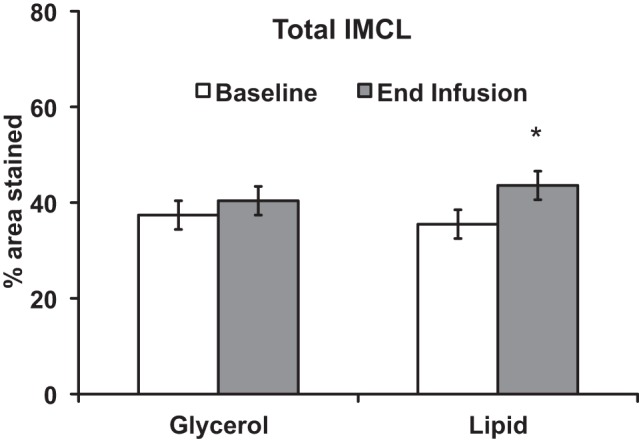
Acute free fatty acid elevation increases total IMCL. Total IMCL (% of muscle stained) increased with lipid infusion. *P < 0.05. Results presented as means ± SE. To generate this figure, all subjects who received a glycerol infusion (n = 43) and all subjects who received a lipid infusion (n = 40) were used. From the University of Minnesota, subjects received either a lipid (n = 14) or glycerol (n = 17) infusion in a prospective design. From the University of Pittsburgh, subjects (n = 26) received both a lipid and glycerol infusion in a crossover design.
Effect of Acute Increase in FFA on Fiber Type-Specific IMCL Accumulation
Representative images of IMCL (Oil-Red-O) levels before (Fig. 2A) and after a 6-h glycerol infusion (Fig. 2B) or 6-h lipid infusion (Fig. 2C) are shown in Fig. 2. Specific fiber types (type 1 fibers in red, type 2 fibers in green) are identified (Fig. 2, D and E).
Fig. 2.

Acute free fatty acid elevation preferentially increases IMCL in type I fibers. Representative images of IMCL staining before and after 6-h lipid exposure. Vastus lateralis muscle was stained for IMCL using Oil-Red-O at baseline (A), after 6 h of glycerol exposure (B), and after 6 h of lipid exposure (C). The muscle was then stained for type 1 fibers (red stain) and type 2 fibers (green stain) (D–F). Images are at 20× magnification. G shows the percent area stained by lipid within the specific fiber type. H shows the percent area stained by lipid after adjustment for percent distribution of specific fiber type. Notable findings include: 1) type 1 fibers having higher lipid content and a significant increase in percent area stained in the setting of FFA elevation (G); 2) no significant change in lipid content with glycerol infusion (G and H); 3) lower IMCL in type 2x fibers when adjusting for percentage of type 2x fibers which did not change with either lipid or glycerol infusion (H); 4) no change in adjusted lipid area for type 1 fibers given FFA elevation, although there is a trend toward significance (H). To generate this figure, all subjects who received a glycerol infusion (n = 43) and all subjects who received a lipid infusion (n = 40) were used. Results are presented as means ± SE. *Significant compared with baseline. #Significant compared with glycerol at end infusion. +Significant compared with other fibers at same time point and same infusion exposure with exceptions noted. T1, type 1 fibers; T2, type 2 fibers; T2a, type 2a fibers; T2x, type 2x fibers.
Figure 2, G and H, quantifies the fiber type (type 1, type 2, type 2a, type 2x)-specific IMCL content before and after a 6-h lipid or glycerol control infusion. To generate Fig. 2, all subjects who received a glycerol infusion (n = 43) and all subjects who received a lipid infusion (n = 40) were used. At baseline, type 1 fibers had significantly more lipid, as measured by LAI or adjusted LAI, than the other fiber types. In the setting of acute FFA elevation from the lipid infusion, IMCL (LAI) increased specifically in type 1 fibers compared with baseline levels (+35 ± 11%, P < 0.05) or the equivalent glycerol control (+29 ± 11%, P < 0.05) (Fig. 2G). In contrast, the glycerol infusion did not alter IMCL content. With lipid infusion, the adjusted LAI (Fig. 2H) did not significantly increase for the different fiber types, although the trend was positive for increased adjusted LAI in type 1 fibers (P = 0.02 unadjusted for multiple comparisons, P = 0.19 adjusted for multiple comparisons).
We examined the correlation between fiber type-specific IMCL accumulation and insulin sensitivity (as measured by GIR) using University of Pittsburgh specific data (n = 26). This was possible as the crossover study design (lipid vs. glycerol infusion) enabled the direct comparison of IMCL accumulation on insulin sensitivity within the same subject. There was a significant correlation between change in % area stained by IMCL in type 1 fibers and decreasing insulin sensitivity (r = −0.48, P = 0.05) (Fig. 3A), which was not significant for type 2 fibers (−0.26, P = 0.29), type 2A fibers (−0.30, P = 0.22), or type 2x fibers (−0.25, P = 0.49). Likewise, there was a significant correlation between increasing % adjusted area stained by IMCL from type 1 fibers and decreasing insulin sensitivity (r = −0.52 P = 0.03) (Fig. 3B), which was not significant for type 2 fibers (−0.26, P = 0.29), type 2A fibers (−0.41, P = 0.11), or type 2x fibers (0.09, P = 0.77).
DISCUSSION
The objective of this study was to examine the effects of increasing free fatty acid (FFA) levels to the high physiological range within the context of a hyperinsulinemic-euglycemic clamp, on fiber type-specific intramyocellular lipid (IMCL) accumulation. The main finding was that FFA elevation by lipid infusion increases IMCL specifically in type 1 fibers of both trained and sedentary subjects, which is associated with a reduction in insulin sensitivity. These findings suggest that IMCL accumulation in type 1 fibers may be a compensatory response when FFA is preferentially used over glucose.
There may be several mechanisms driving the observed IMCL accumulation, particularly in type 1 fibers. In our study design, FFA exposure is combined with insulin infusion. Insulin enhances fatty acid uptake into the muscle (28). Fatty acids enter muscle fibers by fatty acid transport proteins such as fatty acid translocase (FAT)/CD36 (28), plasma membrane associated fatty acid binding protein (FABPpm), and fatty acid transport proteins 1–6 (FATP1–6) (33). In humans, type 1 fibers are enriched in FAT/CD36 (39). In rats, higher levels of FAT/CD36 were observed in red muscle than white muscle, paralleling elevated rates of fatty acid transport in red muscle than white muscle (7). Although it is well established that type 1 fibers have higher IMCL than other muscle fibers (18), we make the novel observation that acute FFA elevation is sufficient to promote preferential accumulation of IMCL in type I fibers. These findings may be influenced by the context of our hyperinsulinemic-euglycemic clamp. Although muscle cells exposed to insulin and glucose increase triglyceride synthesis and reduce triglyceride hydrolysis (20), this might not be seen in vivo as hyperinsulinemia reduces plasma FFA levels as reported by our group (9) and others (22). In the current study, FFA and glycerol were supplied at a high physiological level within the context of hyperinsulinemia, likely enhancing the observed IMCL accumulation compared with FFA infusion alone . We acknowledge that further delineation of the relative role of FFA infusion on IMCL accumulation would require a lipid infusion without hyperinsulinemia and preferably with the use of stable isotopes to identify the contribution of IMCL synthesis (1).
We examined whether a history of training may influence our results. Aerobically trained participants have more type 1 fibers than sedentary participants (14). In addition, in the setting of hyperinsulinemia, trained participants have higher influx of FFA into muscle than sedentary participants (22). Consequently, we hypothesized a potential training effect with trained participants having greater increase in total IMCL than sedentary participants. This was not observed in the current study. There are several potential reasons. The similar accumulation of IMCL in type 1 fibers regardless of training status suggests that training might not alter resting fatty acid transport at the fiber level. This is supported by the observation that FAT/CD36 and FATP1 protein were not different between trained cyclists vs. patients with diabetes or sedentary controls (29), although we acknowledge that effect of training on the different muscle fatty acid transport proteins depends greatly on the training program (6, 25, 36, 38). Alternatively, in trained participants, increased fatty acid uptake in type 1 fibers may be paralleled by increased IMCL turnover, resulting in similar IMCL levels compared with sedentary participants. In support of this alternative explanation, we had previously shown in this cohort that acute FFA elevation increased diacylglycerol, a lipotoxic metabolite, in sedentary participants but not trained participants (8). Likewise, we had previously shown that lipid infusion was associated with higher fat oxidation in trained participants than sedentary participants, suggesting improved metabolic flexibility (12). Last, our muscle samples regardless of training status, had more type 2 fibers than type 1 fibers. This higher proportion of type 2 fibers relative to type 1 fibers might blunt the training related effect on total IMCL accumulation.
The accumulation of IMCL in type I fibers inversely correlated with insulin sensitivity. This was not seen in type 2 fibers. One potential explanation might be that FFA alters type I fiber metabolism to reduce insulin sensitivity. However, we had previously observed that lipid infusion did not affect p-Akt, a critical insulin signaling molecule (12). A more likely explanation is that FFA reduction in insulin sensitivity is paralleled by increasing IMCL storage in type I fibers, potentially as a compensatory mechanism. It is well established that acute FFA elevation increases total IMCL and reduces muscle glucose uptake (10). This FFA-induced reduction in muscle glucose uptake has been attributed to reduced glucose oxidation (31) and reduced glucose transport (32). Specific to the current study, we had previously shown that acute lipid oversupply reduced glucose uptake (9, 12) due to reductions in carbohydrate oxidation with variable effects on nonoxidative glucose disposal depending on training status (12). Consequently, our observed acute lipid accumulation in type I fibers may reflect compensatory storage to preserve metabolic benefit in the setting of repeated lipid oversupply. As training tends to increase total IMCL while preserving insulin sensitivity, an explanation for this apparent “athlete’s paradox” may be related to type I-specific changes beyond IMCL accumulation, with a need for future studies to focus on lipid droplet organization and dynamics (4, 13, 34).
It is important to understand our results within the context of current literature. Previously, it has been reported that IMCL is generally ~1–3% of total area (15, 16). This discrepancy with our current findings (~30%) is likely related to the limitations of the ORO technique. The ORO technique is a semiquantitative measure and is best for comparison between groups within the same study. The previous work (15, 16) captured the image using an 8-bit gray scale, which represents 256 shades of gray. Our current study used a 16-bit gray scale, which represents 65,000 shades of gray, allowing for greater sensitivity for IMCL staining. Additional refinements in software (Northern Eclipse currently vs. ImageJ previously) permitted adjustment in background light and direct measurement of cross-sectional area in microns to augment sensitivity, such that our reported IMCL levels are roughly 10× higher than previously reported (15, 16). We acknowledge that our IMCL results are not directly comparable with previous literature due to differences in technique. Nevertheless, our results remain applicable for comparison within the same study. We found a significant increase in lipid content of type 1 fibers when measured by LAI (relative to type 1 fibers) and a trend to increase in type 1 fibers when measured by adjusted LAI (relative to the total muscle area). We believe that this “blunting” of IMCL accumulation in type 1 fibers, as measured by adjusted LAI, is due to the presence of more type 2 fibers, relative to type 1 fibers as described in Table 1.
Our study has several strengths. This includes the following: 1) overall size of the cohort (n = 57) receiving lipid infusion or matched glycerol control; 2) study design incorporating paired analysis; and 3) measurement of IMCL and muscle fiber type at a central site (University of Pittsburgh). Potential limitations include the following: 1) slight differences in study design (Minnesota: cross-sectional design with matched controls; Pittsburgh: crossover study); 2) slight differences in the lipid and glycerol infusions between study sites which are addressed by the paired analysis in the study design; 3) slight differences in design of the hyperinsulinemic–euglycemic clamp to measures insulin sensitivity, although the GIR was not significantly between the two sites and was consistently higher in trained than sedentary people, regardless of site; 4) selection of trained participants based on self-report, as the V̇o2max testing shows a significant, albeit only slightly higher, fitness in trained vs. sedentary participants from Minnesota; this may explain our observation that total IMCL was not statistically higher in trained than sedentary participants, as previous literature recruited more highly trained participants (V̇o2max ~ 4,200–4,600 ml/min) (15) than the current study (V̇o2max ~2,600–3,800 ml/min); 5) despite the groups having similar baseline BMI and FFA, the post-infusion FFA was higher in the sedentary group than trained group; potentially, this difference in postinfusion FFA level may impact IMCL accumulation between trained and sedentary groups, although no statistically significant differences were observed; and 6) as discussed earlier, the effect of the concurrent hyperinsulinemic-euglycemic clamp needs to be acknowledged; the presence of the clamp likely augmented IMCL accumulation compared with acute FFA elevation without concurrent hyperinsulinemia. Last, as our study design focused on acute FFA elevation, the extent to which our findings translate to chronic FFA elevation remains unknown.
In conclusion, within the context of the hyperinsulinemic-euglycemic clamp, we found that an increase of FFAs to a physiological range sufficient to reduce insulin sensitivity is associated with preferential IMCL accumulation in type 1 fibers.
GRANTS
This study was supported by National Institutes of Health (NIH) Grant 5K-12-RR-023247 to L. S. Chow; the Minnesota Medical Foundation; the Pennock Family Foundation; the University of Minnesota CTSA (NIH Grant UL1-TR-0001140; National Institute of Diabetes and Digestive and Kidney Diseases Grant DK-084213–01 (to J. J. Dubé); and the University of Pittsburgh CTRC (NIH Grant M01-RR-00056).
DISCLOSURES
No conflicts of interest, financial or otherwise, are declared by the authors.
AUTHOR CONTRIBUTIONS
L.S.C., B.H.G., and J.J.D. conceived and designed research; L.S.C., B.H.G., and J.J.D. performed experiments; L.S.C., Q.W., and J.J.D. analyzed data; L.S.C., B.H.G., and J.J.D. interpreted results of experiments; L.S.C. prepared figures; L.S.C. and J.J.D. drafted manuscript; L.S.C., D.G.M., Q.W., S.O.S., B.H.G., and J.J.D. edited and revised manuscript; L.S.C., D.G.M., Q.W., S.O.S., B.H.G., and J.J.D. approved final version of manuscript.
ACKNOWLEDGMENTS
We are grateful for the assistance of the University of Minnesota Clinical Translation Science Institute (CTSI); and outstanding nursing support by M. Snyder, CTSI, University of Minnesota, and M. Mech, Dept. of Medicine, Univ. of Minnesota. We also thank the CTRC staff, S. Anthony, J. Brown, and J. Ng for clinical support, and Jim DeLany for lipid analyses. Finally, we extend our deepest gratitude to the study participants.
Present address of B. H. Goodpaster: Translational Research Institute for Metabolism and Diabetes, Florida Hospital, Orlando, FL, USA. JJD: School of Arts, Business, and Science, Department of Biology, Chatham University, Pittsburgh, PA.
This study has Clinicaltrials.Gov Identifier NCT00786487.
REFERENCES
- 1.Bergman BC, Perreault L, Hunerdosse DM, Koehler MC, Samek AM, Eckel RH. Increased intramuscular lipid synthesis and low saturation relate to insulin sensitivity in endurance-trained athletes. J Appl Physiol (1985) 108: 1134–1141, 2010. doi: 10.1152/japplphysiol.00684.2009. [DOI] [PMC free article] [PubMed] [Google Scholar]
- 2.Boden G, Chen X. Effects of fat on glucose uptake and utilization in patients with non-insulin-dependent diabetes. J Clin Invest 96: 1261–1268, 1995. doi: 10.1172/JCI118160. [DOI] [PMC free article] [PubMed] [Google Scholar]
- 3.Boden G, Jadali F, White J, Liang Y, Mozzoli M, Chen X, Coleman E, Smith C. Effects of fat on insulin-stimulated carbohydrate metabolism in normal men. J Clin Invest 88: 960–966, 1991. doi: 10.1172/JCI115399. [DOI] [PMC free article] [PubMed] [Google Scholar]
- 4.Bosma M, Sparks LM, Hooiveld GJ, Jorgensen JA, Houten SM, Schrauwen P, Kersten S, Hesselink MKC. Overexpression of PLIN5 in skeletal muscle promotes oxidative gene expression and intramyocellular lipid content without compromising insulin sensitivity. Biochim Biophys Acta 1831: 844–852, 2013. doi: 10.1016/j.bbalip.2013.01.007. [DOI] [PubMed] [Google Scholar]
- 5.Bruce CR, Thrush AB, Mertz VA, Bezaire V, Chabowski A, Heigenhauser GJF, Dyck DJ. Endurance training in obese humans improves glucose tolerance and mitochondrial fatty acid oxidation and alters muscle lipid content. Am J Physiol Endocrinol Metab 291: E99–E107, 2006. doi: 10.1152/ajpendo.00587.2005. [DOI] [PubMed] [Google Scholar]
- 6.Burgomaster KA, Cermak NM, Phillips SM, Benton CR, Bonen A, Gibala MJ. Divergent response of metabolite transport proteins in human skeletal muscle after sprint interval training and detraining. Am J Physiol Regul Integr Comp Physiol 292: R1970–R1976, 2007. doi: 10.1152/ajpregu.00503.2006. [DOI] [PubMed] [Google Scholar]
- 7.Chabowski A, Chatham JC, Tandon NN, Calles-Escandon J, Glatz JF, Luiken JJ, Bonen A. Fatty acid transport and FAT/CD36 are increased in red but not in white skeletal muscle of ZDF rats. Am J Physiol Endocrinol Metab 291: E675–E682, 2006. doi: 10.1152/ajpendo.00096.2006. [DOI] [PubMed] [Google Scholar]
- 8.Chow LS, Mashek DG, Austin E, Eberly LE, Persson X-M, Mashek MT, Seaquist ER, Jensen MD. Training status diverges muscle diacylglycerol accumulation during free fatty acid elevation. Am J Physiol Endocrinol Metab 307: E124–E131, 2014. doi: 10.1152/ajpendo.00166.2014. [DOI] [PMC free article] [PubMed] [Google Scholar]
- 9.Chow LS, Seaquist ER, Eberly LE, Mashek MT, Schimke JM, Nair KS, Mashek DG. Acute free fatty acid elevation eliminates endurance training effect on insulin sensitivity. J Clin Endocrinol Metab 97: 2890–2897, 2012. doi: 10.1210/jc.2012-1515. [DOI] [PMC free article] [PubMed] [Google Scholar]
- 10.Dresner A, Laurent D, Marcucci M, Griffin ME, Dufour S, Cline GW, Slezak LA, Andersen DK, Hundal RS, Rothman DL, Petersen KF, Shulman GI. Effects of free fatty acids on glucose transport and IRS-1-associated phosphatidylinositol 3-kinase activity. J Clin Invest 103: 253–259, 1999. doi: 10.1172/JCI5001. [DOI] [PMC free article] [PubMed] [Google Scholar]
- 11.Dubé JJ, Amati F, Stefanovic-Racic M, Toledo FGS, Sauers SE, Goodpaster BH. Exercise-induced alterations in intramyocellular lipids and insulin resistance: the athlete’s paradox revisited. Am J Physiol Endocrinol Metab 294: E882–E888, 2008. doi: 10.1152/ajpendo.00769.2007. [DOI] [PMC free article] [PubMed] [Google Scholar]
- 12.Dubé JJ, Coen PM, DiStefano G, Chacon AC, Helbling NL, Desimone ME, Stafanovic-Racic M, Hames KC, Despines AA, Toledo FGS, Goodpaster BH. Effects of acute lipid overload on skeletal muscle insulin resistance, metabolic flexibility, and mitochondrial performance. Am J Physiol Endocrinol Metab 307: E1117–E1124, 2014. doi: 10.1152/ajpendo.00257.2014. [DOI] [PMC free article] [PubMed] [Google Scholar]
- 13.Gemmink A, Bosma M, Kuijpers HJH, Hoeks J, Schaart G, van Zandvoort MA, Schrauwen P, Hesselink MKC. Decoration of intramyocellular lipid droplets with PLIN5 modulates fasting-induced insulin resistance and lipotoxicity in humans. Diabetologia 59: 1040–1048, 2016. doi: 10.1007/s00125-016-3865-z. [DOI] [PMC free article] [PubMed] [Google Scholar]
- 14.Gollnick PD, Armstrong RB, Saubert CW IV, Piehl K, Saltin B. Enzyme activity and fiber composition in skeletal muscle of untrained and trained men. J Appl Physiol 33: 312–319, 1972. [DOI] [PubMed] [Google Scholar]
- 15.Goodpaster BH, He J, Watkins S, Kelley DE. Skeletal muscle lipid content and insulin resistance: evidence for a paradox in endurance-trained athletes. J Clin Endocrinol Metab 86: 5755–5761, 2001. doi: 10.1210/jcem.86.12.8075. [DOI] [PubMed] [Google Scholar]
- 16.Goodpaster BH, Theriault R, Watkins SC, Kelley DE. Intramuscular lipid content is increased in obesity and decreased by weight loss. Metabolism 49: 467–472, 2000. doi: 10.1016/S0026-0495(00)80010-4. [DOI] [PubMed] [Google Scholar]
- 17.He J, Goodpaster BH, Kelley DE. Effects of weight loss and physical activity on muscle lipid content and droplet size. Obes Res 12: 761–769, 2004. doi: 10.1038/oby.2004.92. [DOI] [PubMed] [Google Scholar]
- 18.He J, Watkins S, Kelley DE. Skeletal muscle lipid content and oxidative enzyme activity in relation to muscle fiber type in type 2 diabetes and obesity. Diabetes 50: 817–823, 2001. doi: 10.2337/diabetes.50.4.817. [DOI] [PubMed] [Google Scholar]
- 19.Helge JW, Dela F. Effect of training on muscle triacylglycerol and structural lipids: a relation to insulin sensitivity? Diabetes 52: 1881–1887, 2003. doi: 10.2337/diabetes.52.8.1881. [DOI] [PubMed] [Google Scholar]
- 20.Hopp JF, Palmer WK. Effect of glucose and insulin on triacylglycerol metabolism in isolated normal and diabetic skeletal muscle. Metabolism 40: 223–225, 1991. doi: 10.1016/0026-0495(91)90100-B. [DOI] [PubMed] [Google Scholar]
- 21.Howald H, Hoppeler H, Claassen H, Mathieu O, Straub R. Influences of endurance training on the ultrastructural composition of the different muscle fiber types in humans. Pflugers Arch 403: 369–376, 1985. doi: 10.1007/BF00589248. [DOI] [PubMed] [Google Scholar]
- 22.Iozzo P, Takala T, Oikonen V, Bergman J, Grönroos T, Ferrannini E, Nuutila P, Knuuti J. Effect of training status on regional disposal of circulating free fatty acids in the liver and skeletal muscle during physiological hyperinsulinemia. Diabetes Care 27: 2172–2177, 2004. doi: 10.2337/diacare.27.9.2172. [DOI] [PubMed] [Google Scholar]
- 23.Itani SI, Ruderman NB, Schmieder F, Boden G. Lipid-induced insulin resistance in human muscle is associated with changes in diacylglycerol, protein kinase C, and IkappaB-alpha. Diabetes 51: 2005–2011, 2002. doi: 10.2337/diabetes.51.7.2005. [DOI] [PubMed] [Google Scholar]
- 24.Kangani CO, Kelley DE, Delany JP. New method for GC/FID and GC-C-IRMS analysis of plasma free fatty acid concentration and isotopic enrichment. J Chromatogr B Analyt Technol Biomed Life Sci 873: 95–101, 2008. doi: 10.1016/j.jchromb.2008.08.009. [DOI] [PMC free article] [PubMed] [Google Scholar]
- 25.Kiens B, Kristiansen S, Jensen P, Richter EA, Turcotte LP. Membrane associated fatty acid binding protein (FABPpm) in human skeletal muscle is increased by endurance training. Biochem Biophys Res Commun 231: 463–465, 1997. doi: 10.1006/bbrc.1997.6118. [DOI] [PubMed] [Google Scholar]
- 26.Krssak M, Falk Petersen K, Dresner A, DiPietro L, Vogel SM, Rothman DL, Roden M, Shulman GI. Intramyocellular lipid concentrations are correlated with insulin sensitivity in humans: a 1H NMR spectroscopy study [Erratum appears in Diabetologia 42: 386, 1999]. Diabetologia 42: 113–116, 1999. doi: 10.1007/s001250051123. [DOI] [PubMed] [Google Scholar]
- 27.Liu L, Zhang Y, Chen N, Shi X, Tsang B, Yu Y-H. Upregulation of myocellular DGAT1 augments triglyceride synthesis in skeletal muscle and protects against fat-induced insulin resistance. J Clin Invest 117: 1679–1689, 2007. doi: 10.1172/JCI30565. [DOI] [PMC free article] [PubMed] [Google Scholar]
- 28.Luiken JJ, Dyck DJ, Han XX, Tandon NN, Arumugam Y, Glatz JFC, Bonen A. Insulin induces the translocation of the fatty acid transporter FAT/CD36 to the plasma membrane. Am J Physiol Endocrinol Metab 282: E491–E495, 2002. doi: 10.1152/ajpendo.00419.2001. [DOI] [PubMed] [Google Scholar]
- 29.Pelsers MM, Tsintzas K, Boon H, Jewell K, Norton L, Luiken JJ, Glatz JFC, van Loon LJC. Skeletal muscle fatty acid transporter protein expression in type 2 diabetes patients compared with overweight, sedentary men and age-matched, endurance-trained cyclists. Acta Physiol (Oxf) 190: 209–219, 2007. doi: 10.1111/j.1748-1716.2007.01698.x. [DOI] [PubMed] [Google Scholar]
- 30.Pruchnic R, Katsiaras A, He J, Kelley DE, Winters C, Goodpaster BH. Exercise training increases intramyocellular lipid and oxidative capacity in older adults. Am J Physiol Endocrinol Metab 287: E857–E862, 2004. doi: 10.1152/ajpendo.00459.2003. [DOI] [PubMed] [Google Scholar]
- 31.Randle PJ, Newsholme EA, Garland PB. Regulation of glucose uptake by muscle. 8. Effects of fatty acids, ketone bodies and pyruvate, and of alloxan-diabetes and starvation, on the uptake and metabolic fate of glucose in rat heart and diaphragm muscles. Biochem J 93: 652–665, 1964. doi: 10.1042/bj0930652. [DOI] [PMC free article] [PubMed] [Google Scholar]
- 32.Roden M, Price TB, Perseghin G, Petersen KF, Rothman DL, Cline GW, Shulman GI. Mechanism of free fatty acid-induced insulin resistance in humans. J Clin Invest 97: 2859–2865, 1996. doi: 10.1172/JCI118742. [DOI] [PMC free article] [PubMed] [Google Scholar]
- 33.Schiaffino S, Reggiani C. Fiber types in mammalian skeletal muscles. Physiol Rev 91: 1447–1531, 2011. doi: 10.1152/physrev.00031.2010. [DOI] [PubMed] [Google Scholar]
- 34.Shepherd SO, Cocks M, Tipton KD, Ranasinghe AM, Barker TA, Burniston JG, Wagenmakers AJM, Shaw CS. Sprint interval and traditional endurance training increase net intramuscular triglyceride breakdown and expression of perilipin 2 and 5. J Physiol 591: 657–675, 2013. doi: 10.1113/jphysiol.2012.240952. [DOI] [PMC free article] [PubMed] [Google Scholar]
- 35.Shulman GI, Rothman DL, Jue T, Stein P, DeFronzo RA, Shulman RG. Quantitation of muscle glycogen synthesis in normal subjects and subjects with non-insulin-dependent diabetes by 13C nuclear magnetic resonance spectroscopy. N Engl J Med 322: 223–228, 1990. doi: 10.1056/NEJM199001253220403. [DOI] [PubMed] [Google Scholar]
- 36.Talanian JL, Holloway GP, Snook LA, Heigenhauser GJF, Bonen A, Spriet LL. Exercise training increases sarcolemmal and mitochondrial fatty acid transport proteins in human skeletal muscle. Am J Physiol Endocrinol Metab 299: E180–E188, 2010. [DOI] [PubMed] [Google Scholar]
- 37.Tarnopolsky MA, Rennie CD, Robertshaw HA, Fedak-Tarnopolsky SN, Devries MC, Hamadeh MJ. Influence of endurance exercise training and sex on intramyocellular lipid and mitochondrial ultrastructure, substrate use, and mitochondrial enzyme activity. Am J Physiol Regul Integr Comp Physiol 292: R1271–R1278, 2007. doi: 10.1152/ajpregu.00472.2006. [DOI] [PubMed] [Google Scholar]
- 38.Tunstall RJ, Mehan KA, Wadley GD, Collier GR, Bonen A, Hargreaves M, Cameron-Smith D. Exercise training increases lipid metabolism gene expression in human skeletal muscle. Am J Physiol Endocrinol Metab 283: E66–E72, 2002. doi: 10.1152/ajpendo.00475.2001. [DOI] [PubMed] [Google Scholar]
- 39.Vistisen B, Roepstorff K, Roepstorff C, Bonen A, van Deurs B, Kiens B. Sarcolemmal FAT/CD36 in human skeletal muscle colocalizes with caveolin-3 and is more abundant in type 1 than in type 2 fibers. J Lipid Res 45: 603–609, 2004. doi: 10.1194/jlr.M300424-JLR200. [DOI] [PubMed] [Google Scholar]