. 2017 Aug 1;6:e25299. doi: 10.7554/eLife.25299

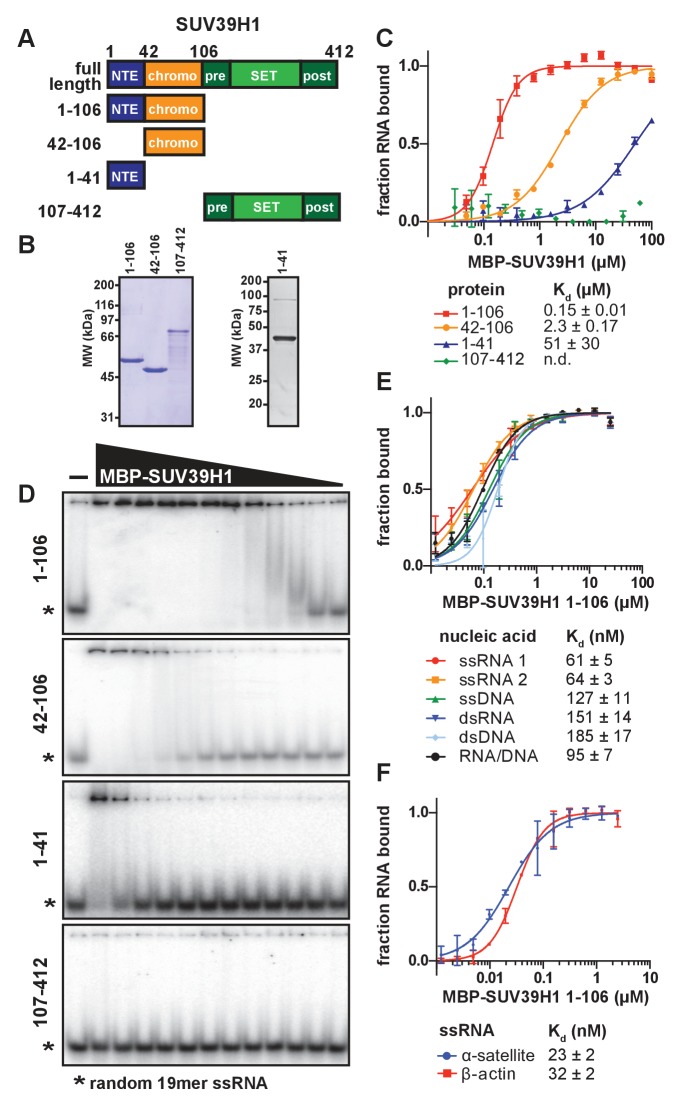
Figure 3. SUV39H1 directly binds nucleic acids through its chromodomain.

(A) Domain schematic of SUV39H1 truncations. NTE, N-terminal extension; chromo, chromodomain; pre, pre-SET; post, post-SET. Amino acid residues are listed above and to the left of each truncation. (B) Coomassie-stained gel of purified human SUV39H1 truncations fused to MBP. (C) Quantification of SUV39H1 domains binding to 19mer RNA. Binding curves are from quantifying EMSAs shown in 3D. Error bars are standard deviation from two independent experiments. Dissociation constants (Kd, μM) displayed on graph are determined by non-linear fitting of the binding curves. Standard error represents the error of the curve fitting to the average of the two experimental replicates. (D) Representative EMSAs showing binding of purified MBP-SUV39H1 truncations with a 19mer RNA oligo (*), 1–41, 42–106 and 1–106 diluted 2-fold from 100 μM, 107–412 diluted 2-fold from 62 μM. Quantified in 3C. (E) Binding of SUV39H1 to all nucleic acid types. Binding curves are from quantifying EMSAs (Figure 3—figure supplement 1C) of MBP-tagged SUV39H1 1–106 binding to 50mer nucleic acids (ssRNA, ssDNA, dsRNA, dsDNA, or RNA/DNA) (Figure 3—figure supplement 1B). Various nucleic acids are composed of the first 50 bases of E. coli maltose binding protein (MBP): ssRNA1, sense MBP 1–50; ssRNA 2, anti-sense MBP 1–50; ssDNA, sense MBP 1–50. Error bars, dissociation constants (Kd, μM), and standard error calculated as in 3C. (F) Quantification of MBP-SUV39H1 1–106 binding to 180mer α-satellite or β-actin ssRNA (representative EMSA in Figure 3—figure supplement 1E). Error bars, dissociation constants (Kd, μM), and standard error calculated as in 3C. See also Figure 3—figure supplement 1.

DOI: http://dx.doi.org/10.7554/eLife.25299.008

Figure 3.

Figure 3—figure supplement 1. Characterization of SUV39H1-RNA binding in vitro.

Figure 3—figure supplement 1.

(A) Competitive binding assay measuring the ability of unlabeled 19mer ssRNA to compete with the interaction of labeled 19mer ssRNA binding to MBP-SUV39H1 42–106. MBP-SUV39H1 42–106 present at 12.4 μM, labeled RNA at approximately 3 nM, and unlabeled RNA at concentrations ranging from 30 to 1500 nM. Percent labeled RNA bound is quantified and listed. (B) Various nucleic acids oligonucleotides consisting of the first 50 bases of E. coli MBP run out on a native polyacrylamide gel. Oligonucleotides were annealed to create various nucleic acids and end labeled with radioactive 32P. ssRNA 1, sense MBP 1–50; ssRNA 2, anti-sense MBP 1–50; ssDNA, sense MBP 1–50. (C) Representative EMSAs showing the binding of purified MBP-SUV39H1 1–106 and to various nucleic acids, all composed of the E. coli MBP 1–50 sequence, shown in B. Protein is diluted 2-fold from 25 μM. Quantification in Figure 3E. (D) Left, binding curves showing binding of MBP-SUV39H1 1–106 and either sense or anti-sense 19mer ssRNA, protein diluted 2-fold from 100 µM. Error bars are standard deviation from two independent experiments. Right, dissociation constants (Kd, μM) determined by non-linear fitting of the binding curves. Standard error represents the error of the curve fitting to the average of two experimental replicates. (E) Representative EMSAs showing binding of purified MBP-SUV39H1 1–106 to 180 bases of either α-satellite or β-actin ssRNA. Protein diluted 2-fold from 2.5 μM. Quantification in Figure 3F. (F) SUV39H1 affinity increases as length of nucleic acid increases. Binding curves compiled from Figure 3E and F (50mers and 180mers, respectively) and D) (19mers) showing the binding of MBP-SUV39H1 1–106 to various nucleic acid types. 19mer random sequence: sense and antisense ssRNA; 50mer MBP 1–50: sense and antisense ssRNA, ssDNA, dsRNA, dsDNA, and RNA/DNA hybrid; 180mers: α-satellite and β-actin ssRNA. All sequences are described in the materials and methods. Error bars are standard deviation from two independent experiments. Dissociation constants (Kd, μM) displayed on graph are determined by non-linear fitting of the binding curves. Standard error represents the error of the curve fitting to the average of two experimental replicates.