

Inhibition of locomotor muscle afferents results in rapid primary-component O2 uptake (V̇o2) on-kinetics accounting for the decreased O2 deficit in heart failure (HF). This study revealed that abnormal musculoskeletal–neural afferents couple with pulmonary and circulatory dysfunction to provoke impaired exercise V̇o2 in HF. Steady-state V̇o2 cannot properly phenotype abnormal muscle afferent contributions to impaired exercise V̇o2 in HF.
Keywords: group III-Aδ and IV-C muscle afferents, muscle oxygen uptake kinetics, oxygen deficit, on-transient oxygen uptake kinetics, square-wave exercise, exercise transition
Abstract
Heart failure (HF) patients demonstrate impaired pulmonary, circulatory, and nervous system responses to exercise. While HF demonstrates prolonged [time constant (τ)] pulmonary O2 uptake (V̇o2) on-kinetics, contributing to exercise intolerance, it is unknown whether abnormal V̇o2 kinetics couple with ventilatory and circulatory dysfunction secondary to impaired group III/IV afferents in HF. Because lower lumbar intrathecal fentanyl inhibits locomotor muscle afferents, resulting in improved exercise ventilation and hemodynamics, we tested these hypotheses: HF will demonstrate 1) rapid V̇o2 on-kinetics and 2) attenuated steady-state V̇o2 amplitude and O2 deficit (O2def) during exercise with fentanyl versus placebo. On separate visits (randomized), breath-by-breath V̇o2 was measured in HF (ejection fraction: 27 ± 6%, New York Heart Association class I–III) and age- and sex-matched controls (both n = 9, ages: 60 ± 6 vs. 63 ± 8 yr, P = 0.37) during cycling transitions at 65% peak workload (78 ± 24 vs. 115 ± 39 W, P < 0.01) with intrathecal fentanyl or placebo. Regardless of group or condition, optimal phase II (primary component) curve fits reflected a phase I period equal to 35 s (limb-to-lung timing) via single-exponential functions. Condition did not affect steady-state V̇o2, the phase II τ of V̇o2, or O2def within controls (P > 0.05). Without differences in steady-state V̇o2, reduced O2def in fentanyl versus placebo within HF (13 ± 4 vs. 22 ± 15 ml/W, P = 0.04) was accounted for by a rapid phase II τ of V̇o2 in fentanyl versus placebo within HF (45 ± 11 vs. 57 ± 14 s, P = 0.04), respectively. In an integrative manner, these data demonstrate important effects of abnormal locomotor muscle afferents coupled to pulmonary and circulatory dysfunction in determining impaired exercise V̇o2 in HF. Effects of abnormal muscle afferents on impaired exercise V̇o2 and hence exercise intolerance may not be discernable by independently assessing steady-state V̇o2 in HF.
NEW & NOTEWORTHY Inhibition of locomotor muscle afferents results in rapid primary-component O2 uptake (V̇o2) on-kinetics accounting for the decreased O2 deficit in heart failure (HF). This study revealed that abnormal musculoskeletal–neural afferents couple with pulmonary and circulatory dysfunction to provoke impaired exercise V̇o2 in HF. Steady-state V̇o2 cannot properly phenotype abnormal muscle afferent contributions to impaired exercise V̇o2 in HF.
while the precipitating event leading to heart failure (HF) traditionally manifests as one or more disease processes central to the myocardium, chronic HF is a syndrome that impairs integrated coupling of nervous, pulmonary, and skeletal muscle function (1, 11, 20, 31, 35). Exercise places an increased stress upon these integrated cardiopulmonary and neuromuscular interactions in HF, which effectively results in reduced exercise tolerance in patients (1, 11, 31, 34, 35, 43). With this, a unifying peripheral-central mechanism hypothesized to link impaired pulmonary, circulatory, and nervous system responses to exercise in HF may rely on pathology of polymodal group III and IV neural receptors native to skeletal muscle (1, 11, 31, 34, 35, 43).
With abnormal activation of unencapsulated thin-fiber group III/IV muscle afferents caused by altered sensitivity to byproducts of metabolism (e.g., H+ and Pi) and/or mechanical deformation of receptive fields associated with exercise, a marked surge in uncontrolled sympathetic nerve activity is suggested to play a critical role in provoking exaggerated systemic vascular resistance (SVR), blood pressure, and ventilation, which collectively contribute to decreased exercise function in HF (1, 11, 31, 35). Likewise, in separate lines of study in HF, but, indeed, relevant to discussions of uncontrolled integrated pulmonary and circulatory responses to exercise, HF demonstrates decreased exercise function via increased work of breathing, maldistribution of hemodynamics away from locomotor toward respiratory muscles, and reduced perfusion of skeletal muscle (21, 22, 28, 30, 41, 50). Therefore, presumably, while contributing further to decreased exercise function, it is likely that HF patients harbor bioenergetic deficits linked to reduced skeletal muscle O2 convective delivery and diffusion (both small- and large-diameter vasculatures), O2 uptake, and capacity to properly recruit oxidative metabolic machinery (21, 22, 28, 50).
Depending on the experimental setting, it has been established that pulmonary O2 uptake (V̇o2) may be used to quantify, for example, gross circulatory and metabolic function or, via application of advanced kinetics models, pulmonary V̇o2 may be used to estimate dynamics of the circulation and the rate at which gas exchange responds to meet metabolic demands of exercise localized to skeletal muscle (i.e., muscle V̇o2 kinetics) (12, 14, 29, 32, 38). Prolonged V̇o2 on-kinetics suggest, for example, an increased necessity for substrate level (i.e., nonoxidative), energy production, and/or reduced perfusion (i.e., delivery or diffusion of O2) at the skeletal muscle level (12, 26, 28, 29, 37, 38, 42). Impaired peripheral-central hemodynamics, accompanied by an increased ventilatory equivalent for metabolic (O2) demand, has been either directly or secondarily attributed to abnormal activation of group III/IV afferents in HF (1, 11, 31, 35). Despite exercise intolerance being the commonality associated with both prolonged V̇o2 kinetics and abnormal group III/IV afferents, how subtleties of gas exchange and, hence, exercise V̇o2 kinetics can be taken to improve knowledge of the role that group III/IV afferents play in contributing to exercise intolerance has not been defined in HF.
Therefore, because of the effects that inhibition of group III/IV locomotor muscle afferents may have on hemodynamic (re)distribution related to decreased ventilation (decreased work of breathing) and blood pressure accompanied by increased peripheral vascular conductance during exercise in HF (1, 31), we tested the hypotheses that moderate-intensity exercise paired with inhibited group III/IV locomotor muscle afferents will lead to the following pulmonary V̇o2 on-kinetics features in HF: 1) shortened limb-to-pulmonary transit time [phase I period (46)], 2) rapid phase II time constant (τ) of the exponential rise in V̇o2 (τV̇o2), and 3) decreased steady-state O2 requirement for a given workload, which will all synchronize to a decreased O2 deficit (O2def). Support for these hypotheses using this experimental paradigm will advance our understanding of how peripheral-central pathophysiology plays an important role in determining the adequacy of the integrated physiological coupled responsiveness of pulmonary, circulatory, and nervous systems to the energy demands of exercise in HF.
METHODS
Participants
Caucasian patients with reduced ejection fraction HF (n = 9) and Caucasian age- and- sex-matched healthy control subjects (n = 9) participated in this study (detailed characteristics are shown in Table 1). HF patients were recruited as a convenience sample through the Mayo Clinic Heart Failure Service and the Cardiovascular Health Clinic. Control participants were recruited through advertisement in the surrounding community. Inclusion criteria for HF patients included diagnosis of ischemic or dilated cardiomyopathy with duration of HF symptoms of >1 yr, stable HF symptoms (>3 mo), a left ventricular ejection fraction percentage of ≤35% (from clinical records within the previous 3 mo), body mass index of <35 kg/m2 (at enrollment), not dependent on alcohol and/or narcotics of any form, and current nonsmokers with a past smoking history of <15 pack-years (at enrollment). All patients were on standard pharmacological therapy for HF at the time of the study. Control participants demonstrated normal cardiac function without evidence of exercise-induced ischemia and also did not have medical histories for hypertension, lung disease, or coronary artery disease. Although the same cohort of participants included in this study were previously studied while testing separate hypotheses (31, 45), outcomes pertaining to tests of the present hypotheses have not been previously reported. All aspects of this study were approved by the Mayo Clinic Institutional Review Board and were performed in accordance with the ethical standards of the Declaration of Helsinki. All individuals provided written informed consent before study participation.
Table 1.
Participant characteristics
| Healthy Control Subjects | Heart Failure Patients | P Value | |
|---|---|---|---|
| Age, yr | 63 ± 8 | 60 ± 6 | 0.37 |
| Sex, men/women | 7/2 | 7/2 | 0.99 |
| Height, cm | 176 ± 10 | 176 ± 10 | 0.97 |
| Weight, kg | 80 ± 12 | 98 ± 9 | <0.01 |
| Body mass index, kg/m2 | 26 ± 3 | 32 ± 4 | <0.01 |
| Body surface area, m2 | 2.0 ± 0.2 | 2.2 ± 0.1 | 0.02 |
| Left ventricular ejection fraction, % | 27 ± 6 | ||
| Creatinine, mg/dl | 1.1 ± 0.2 | ||
| Estimated glomerular filtration rate, ml·min−1·1.73 m−2 | 70 ± 20 | ||
| Etiology (ischemic/idiopathic) | 5/4 | ||
| New York Heart Association class, I/II/III | 3/3/3 | ||
| Weber-Janicki (peak V̇o2) | |||
| A, >20 ml·kg−1·min−1 | 2 | ||
| B, 16−20 ml·kg−1·min−1 | 4 | ||
| C, 10−16 ml·kg−1·min−1 | 3 | ||
| CPET | |||
| Peak V̇o2, l/min | 2.2 ± 0.6 | 1.8 ± 0.3 | 0.13 |
| Peak V̇o2, %predicted | 101 ± 26 | 84 ± 13 | 0.11 |
| Peak V̇o2, ml·kg−1·min−1 | 27 ± 5 | 18 ± 3 | <0.01 |
| V̇o2 at AT, l/min | 1.5 ± 0.6 | 1.4 ± 0.3 | 0.81 |
| V̇o2 at 65% PW, l/min | 1.4 ± 0.5 | 1.3 ± 0.3 | 0.62 |
| % of AT | 88 ± 26 | 89 ± 9 | 0.41 |
| PW, W | 187 ± 53 | 120 ± 35 | <0.01 |
| 65%, W | 115 ± 39 | 78 ± 24 | <0.01 |
| Pulmonary function | |||
| FVC, %predicted | 103 ± 12 | 89 ± 7 | <0.01 |
| FEV1, %predicted | 98 ± 9 | 88 ± 11 | 0.03 |
| FEV1/FVC, %predicted | 95 ± 7 | 98 ± 7 | 0.68 |
| FEF25−75, %predicted | 86 ± 25 | 89 ± 23 | 0.96 |
| Medications, n (%) | |||
| Angiotensin-converting enzyme inhibitor | 6 (67) | ||
| ANG II receptor blockers | 3 (33) | ||
| β-Blocker | 9 (100) | ||
| Nitrate (oral, SL, or topical) | 4 (44) | ||
| Statin | 3 (33) | ||
| Aspirin | 5 (56) | ||
| Diuretics | 6 (67) |
Continuous data are expressed as means ± SD. CPET, cardiopulmonary exercise test study on visit 1; V̇o2, pulmonary O2 uptake from CPET on study visit 1; V̇o2 at AT, pulmonary V̇o2 at anaerobic threshold from CPET on study visit 1; PW, peak workload; V̇o2 at 65% PW, pulmonary V̇o2 at 65% of peak workload from CPET on study visit 1; FVC, forced vital capacity; FEV1, forced expiratory volume in 1 s; FEF25−75, forced expiratory flow between 25 and 75% of FVC.
Overview
This study consisted of three study visits each separated by >48 h but with <3 wk between visits. All study visits occurred in the same environmentally controlled physiology laboratory while beginning approximately at 8:00−8:30 AM. Participants were advised to engage in no greater than light physical activity 24 h before each visit while also refraining from eating or consuming caffeine <3 h before arrival for the study testing. Standard assessment of demographics and body anthropometry (e.g., height, weight, and medication history) were performed upon arrival at study visit 1. Additional testing of basic airway function via flow-volume loop spirometry (CPFS system spirometer, Medical Graphics, St. Paul, MN), according to standards of the American Thoracic Society, was performed at rest on study visit 1 (27). In addition to measurements of forced vital capacity (FVC), forced expiratory volume in 1 s (FEV1), and forced expiratory flow between 25% and 75% of FVC (FEF25–75), the percentage of predicted values was computed according to the equations of Crapo et al. (10).
Exercise Tests
Cardiopulmonary exercise testing.
Before performing cardiopulmonary exercise testing (CPET) on a cycle ergometer (Corival Recumbent, Lode, Groningen, The Netherlands) on study visit 1, all participants were fit with a 12-lead ECG for continuous heart rate (HR) and rhythm monitoring. Testing in controls began with a 5-min rest followed by an initial 3-min stage at 40 W at 65 rpm, thereafter increasing by 40-W increments every 3 min until volitional fatigue. In contrast, the initial workload in HF began at 20 W at 65 rpm, thereafter increasing by 20-W increments every 3 min until volitional fatigue (2). All CPETs were conducted by the same clinical exercise physiologists and study team of exercise specialists. Achievement of peak CPET was evaluated by the same clinical exercise physiologists using symptoms [e.g., rate of perceived exertion (RPE; Borg scale = 6–20) ≥ 17] in addition to cardiopulmonary indexes [e.g., respiratory exchange ratio (RER) of ≥1.10] consistent with American Heart Association and American College of Sports Medicine guidelines (2). Peak pulmonary V̇o2 (V̇o2peak) was calculated using averaged data from the final 30 s of the last stage completed, whereas the percentage of predicted V̇o2peak was calculated using the equations of Hansen et al. (16). Anaerobic threshold (AT) was determined using the noninvasive gas exchange methods of Beaver et al. (4). Peak workload (PW) was defined as the workload of the final completed CPET stage.
A customized metabolic gas exchange system (CPX/D, Medical Graphics, St. Paul, MN), interfaced to sample gas concentrations using mass spectrometry (Marquette MGA 1100, MA Tech Services, St. Louis, MO), was used to continuously measure breath by breath (mid 5 of 7 filter) pulmonary V̇o2 and ventilation [e.g., minute ventilation (V̇e), respiratory rate (fB), and tidal volume (VT)] throughout CPET. During CPET, participants wore a nose clip and breathed through a mouthpiece attached to a pneumotachograph, which was connected to a nonrebreathing valve (Hans Rudolph, Shawnee, KS). The dead space of this breathing apparatus was 80 ml and was accounted for in all computations. The gas sampling line connecting the pneumotachograph to the mass spectrometer (sampled at 60 ml/min) was 100 cm long.
Before each CPET was performed, and while conducted in the setup used for testing, this system was calibrated using precision-grade gas mixtures for O2 and CO2; the pneumotachograph that participants breathed through was calibrated for linear flows using a 3-liter syringe over a full range of flows, according to manufacturer standards.
Experimental exercise testing.
On both study days 2 and 3, participants performed an identical series of three submaximal fixed-load square-wave exercise tests transitioning from rest on a cycle ergometer (Corival Recumbent, Lode), each occurring at a workload intensity of 65% of PW calculated from CPET on study visit 1. Cycling cadence for all tests was constrained to 65 rpm. Before performing square-wave exercise on study visit 2, participants were randomized in a single-blind manner to the condition of lower lumbar (L3–L4) intrathecal injection of fentanyl (FNT) or sham [placebo (PLB)]. Participants crossed over to the opposite condition for study visit 3. Also occurring before exercise testing on each study day, the breath-by-breath gas exchange and ventilation system was set up and calibrated in the same manner as described for CPET on study visit 1. Blood pressure [systolic (SBP), diastolic (DBP), and mean (MAP)] was assessed (quantified offline) throughout testing using a pressure transducer inserted via indwelling radial arterial catheter, as previously described (31).
For each study day in mirrored order, ~2−3 min after lower lumbar intrathecal injection of FNT or PLB, participants were seated upright on the cycle ergometer where they were given a 5-min rest period while resting pulmonary V̇o2 and ventilation data were collected. At the conclusion of this rest period, participants were instructed to immediately begin exercising for a total duration of 5 min (300 s) at 65% PW while breath-by-breath pulmonary V̇o2 and ventilation data were continually collected. In the absence of repeating the lower lumbar injection procedure (FNT or PLB) within a study day irrespective of experimental arm, participants repeated the remaining steps with no less than 15 min between sessions for a total of three exercise transients performed each study day.
After the final exercise transient on each study day, while using the CO2 rebreathe technique, central chemoreceptor sensitivity testing was performed within 10 min to assess whether cephalad migration of FNT occurred (31).
FNT vs. PLB lower lumbar intrathecal injection to attenuate neural feedback from locomotor muscles.
Irrespective of randomization order, an aseptic technique for intrathecal injection of FNT or PLB was identical for study days 2 and 3, with the exception of no study drug injection on the PLB day (31). The methodology for attenuating neural signal transduction originating at locomotor muscles using intrathecal FNT injection at the lower lumbar level has been previously described (1, 31). Briefly, within ~5−10 min of the rest period preceding exercise, after cutaneous and subcutaneous delivery of 2−4 ml of 1% lidocaine to anesthetize the lower lumbar region, intrathecal injection of 1.0 ml of FNT (0.05 mg/ml) was caudally delivered within the subarachnoid space at the L3–L4 level while individuals remained seated in the upright position. Throughout this procedure and persisting during all testing, participants remained seated in the upright position to minimize the potential for cephalad migration of FNT. After intrathecal injection of FNT, occurring for all participants, cutaneous hypoesthesia perception to touch and placement of cold packs on lower limbs was observed compared with normal perception of touch and cold pack placement on upper limbs. Apart from all participants demonstrating modest, but expected, pruritus below the L3–L4 injection site level, no participant demonstrated other signs or symptoms associated with intrathecal injection of FNT (e.g., nausea, dyspnea, and clinically meaningful respiratory depression while at rest: fB < 8 breaths/min).
All aspects of the protocol implemented for the FNT experimental arm were applied for the crossover PLB study day, with the exception that no needle was advanced into the subarachnoid space at the L3–L4 level to deliver fentanyl or other substance. However, with the lower lumbar region anesthetized from similar application of 1% lidocaine as in the FNT day, the tip of a syringe without an attached needle was pressed into the same L3–L4 location using the same pressure that would have been used to advance the needle into the subarachnoid space. Cutaneous perception of touch and cold pack placement on lower and upper limbs after the sham injection was similarly normal across participants.
CO2 rebreathing for testing central chemosensitivity.
Cephalad migration of FNT may confound the hypothesized influence of lower lumbar intrathecal FNT on attenuating neural transduction related to locomotor muscle group III/IV afferents. Therefore, to optimally test whether cephalad migration of FNT may have occurred during exercise leading to attenuated cardiovascular control, CO2 rebreathing tests were performed to test central chemosensitivity, as previously described (31). The slopes of the ventilation to end-tidal Pco2 ratio from CO2 rebreathing tests were 2.23 ± 0.65 versus 2.26 ± 0.51 l·min−1·mmHg−1 in PLB versus FNT (P = 0.75) in HF and 2.39 ± 0.68 versus 2.31 ± 0.84 l·min−1·mmHg−1 in PLB versus FNT (P = 0.87) in controls. Slopes did not differ between groups for a given experimental arm (PLB: P = 0.62 and FNT: P = 0.87).
Data Processing and Modeling
Before least-squares nonlinear regressions to exponentially curve-fit on-transient pulmonary V̇o2 kinetics were performed, breath-by-breath pulmonary V̇o2 data were carefully postprocessed using established methodologies (8, 14, 15, 32, 48). Initially, raw pulmonary V̇o2 data were visually inspected to remove data points [i.e., lying 4 SDs from the local mean (19)] caused by errant factors (e.g., coughing, talking, and throat clearing) not consistent with on-transient pulmonary V̇o2 kinetics. For each exercise transient per participant on both study days 2 and 3, pulmonary V̇o2 data were linearly interpolated to 1-s intervals and temporally aligned across all three sessions for further ensemble averaging to yield a single second-to-second pulmonary V̇o2 response (time = 0, representing the onset of exercise instituted from rest). In a final step, second-to-second ensemble averaged pulmonary V̇o2 responses were averaged into 10-s bins for on-transient exponential model curve fitting (6, 8, 14, 15, 32).
On-transient pulmonary V̇o2 kinetics.
While the fixed workload across exercise transients was equivalent to a moderate-intensity level (32, 33), to ensure that we selected the best-fit iterative exponential association model for pulmonary V̇o2 on-kinetics for each participant in both experimental conditions, pulmonary V̇o2 on-kinetics were fit using two separate exponential modeling strategies (see the schematic shown in Fig. 1 for an ideal representation of model curve-fit strategies and respective features): 1) single-exponential function and 2) double-exponential function (6, 32, 47). Accordingly, with the omission of the cardiodynamic [phase I (46)] response equivalent to the first 20 s of the fitting window (leaving a 280-s data period adequate to accommodate ≥4 τ or ≥98% of the response) (6, 26, 32), on-transient single-exponential models were calculated as follows:
| (1) |
whereas on-transient double-exponential models were calculated as follows:
| (2) |
where Yt is pulmonary V̇o2 at any time (t); YB is resting pulmonary V̇o2 (mean of the final 30 s of the resting baseline period); A1 and A2 are steady-state increases in pulmonary V̇o2 above rest in phase II (primary component) or, if present, above phase II (phase III, slow component), respectively; TD is time delay (left unconstrained in both phases II and III); and τ is the time constant equal to the time for pulmonary V̇o2 to increase to 63% of the steady-state increase in pulmonary V̇o2.
Fig. 1.
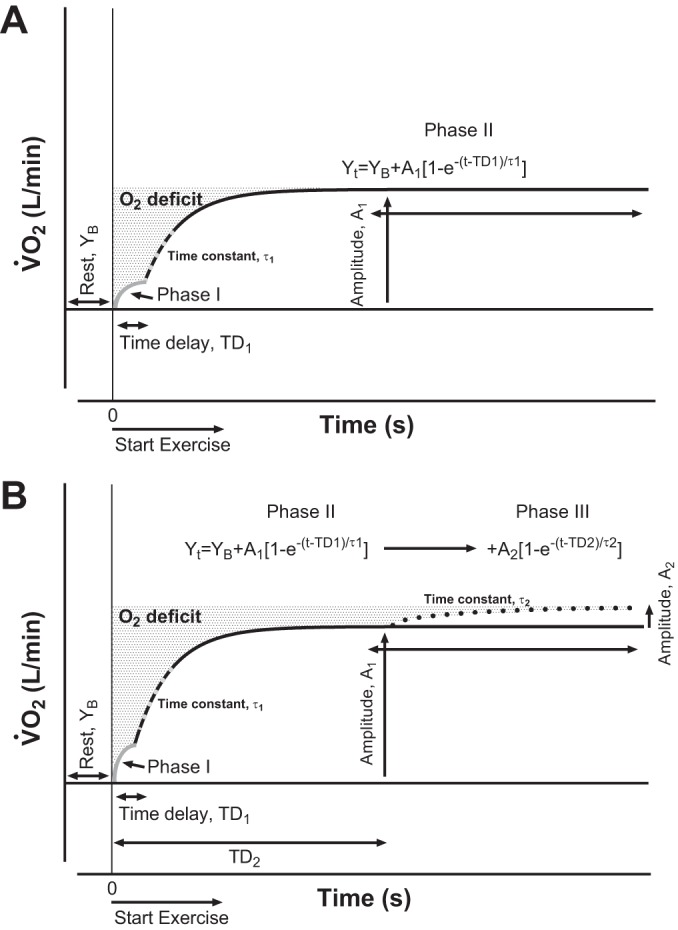
Ideal schematic models illustrating modest-to-moderate intensity (A; <θL) compared with high-to-heavy (B; >θL) exercise intensity pulmonary O2 uptake (V̇o2) on-kinetics. Yt is V̇o2 at any time (t); YB is resting V̇O2; A1 is the amplitude of the steady-state increase in V̇o2 above rest in phase II (fast primary component); A2 (when present) is the amplitude of V̇o2 above phase II (phase III, slow component); TD1 and TD2 (when present) are independent unconstrained time delays (phase II and III, respectively); and τ1 and τ2 are the time constants for phase II and phase III components, respectively. Phase I (cardiodynamic, limb-to-lung transit time) in these ideal theoretical models was constrained to the first 20 s at the onset of exercise. Compared with A, B shows that oxygen deficit (O2def) can be increased by the presence of a slow phase III component.
Additionally, to maximize confidence and optimize dependency in our on-transient pulmonary V̇o2 kinetics parameters of interest (e.g., τ), which reduces the potential for model overparameterization (i.e., a large number of unconstrained parameters share a risk for high mutual dependency resulting in decreased parameter confidence), to determine best-fit exponential models, we assessed smallest root mean square error (RMSE) values between single- versus double-exponential functions in both HF and controls across experimental conditions (see results and Table 2).
Table 2.
RMSE from the exponential model curve fit of on-transient pulmonary V̇o2 kinetics in both heart failure patients and age-matched healthy control subjects
| Healthy Control Subjects |
Heart Failure Patients |
|||
|---|---|---|---|---|
| RMSE | PLB | FNT | PLB | FNT |
| Phase I duration (25 s) | ||||
| Single exponential | 0.040 ± 0.011 | 0.045 ± 0.022 | 0.052 ± 0.014 | 0.050 ± 0.014 |
| Double exponential | 0.045 ± 0.009 | 0.048 ± 0.016 | 0.051 ± 0.015 | 0.048 ± 0.015 |
| Single-exponential phase II pulmonary V̇o2 on-kinetics curve fit | ||||
| Phase I duration, s | ||||
| Model 1 (15 s) | 0.045 ± 0.010 | 0.046 ± 0.021 | 0.054 ± 0.015 | 0.052 ± 0.013 |
| Model 2 (25 s) | 0.040 ± 0.011 | 0.045 ± 0.022 | 0.052 ± 0.014 | 0.051 ± 0.014 |
| Model 3 (35 s) | 0.038 ± 0.012 | 0.042 ± 0.019 | 0.050 ± 0.013 | 0.048 ± 0.013 |
Data are expressed as means ± SD. Phase I durations of 15-s, 25-s, or 35-s length correspond to removal of data from time = 0 to 10, 20, or 30 s, respectively. RMSE, root mean square error; PLB, placebo experimental arm; FNT, fentanyl experimental arm.
Finally, because it has been suggested that the phase I response may not be homogeneously described across adults as the first 20 s of the step transition from rest to exercise [e.g., prolonged in HF or healthy aging (26, 29, 37)], in reporting final model parameters from each best-fit exponential function, we assessed the optimal phase I period for determining the ideal onset of the phase II curve-fitting window (see the schematic shown in Fig. 1 of the curve-fit relationship between phase I and II periods). This was accomplished by setting three separate phase I periods corresponding to 15-, 25-, and 35-s durations (i.e., elimination of on-transition data from 0 s up to 10, 20, and 30 s, respectively, from 10 s of binned data) (29). Optimal phase II on-kinetics start times were then determined by comparing RMSE values across single-exponential models that omitted on-transition time periods commensurate with each phase I period strategy.
O2def.
Because the double-exponential model did not perform significantly better in fitting pulmonary V̇o2 on-kinetics in either HF or controls in either experimental condition (see results and Table 2), O2def was calculated by using all data (i.e., both steady and nonsteady state) based on parameters using single-exponential functions (with an unconstrained TD) via work instituted from rest as the definite integral based on Eq. 1 (48):
| (3) |
where A1 is the steady-state increase in pulmonary V̇o2 above rest in phase II and τ is the time constant.
Statistical Analyses
Data are presented as means ± SD where appropriate. Basic between-group comparisons were tested using unpaired Student’s t-tests (e.g., demographics) for continuous data or χ2-tests for categorical data. Initial mixed-model ANOVA tests for each group and condition were performed to assess goodness of V̇o2 on-kinetics curve fits between single- versus double-exponential functions (kinetics modeling described above). To test the effect of varying the length of the phase I period at the onset of exercise [i.e., removal of exercise onset data from time = 0 up to 15, 25, or 35 s (Eq. 1)] on phase II V̇o2 on-kinetics responses, separate mixed-model ANOVA tests were performed for each group and condition. Multiple comparisons involving group (between-factor, controls vs. HF)-by-experimental condition (within-factor, PLB vs. FNT) were assessed using mixed-model ANOVA tests for variables of interest. For all ANOVA tests, post hoc correction via Tukey tests was used when the model F-test statistic was significant to identify where only planned between (e.g., control-FNT vs. HF-FNT)- or within (e.g., HF-PLB vs. HF-FNT)-group differences occurred (minimized chance for type II error by eliminating excessive corrections for unnecessary pairwise comparisons). Standardized differences (e.g., PLB vs. FNT within each group) were tested using effect sizes (ES) [Cohen’s d (9)] and interpreted as 0.0 = trivial, 0.2 = small, 0.5 = moderate, and 0.8 ≥ large. The α-level was set at 0.05 to determine two-tailed significance. Computations were made using SAS statistical software (version 9.4, SAS Institute, Cary, NC).
RESULTS
Participant Characteristics
The age spectrum across participants was 52−73 yr with a similar distribution of sex across groups (Table 1). Compared with HF, controls weighed less and demonstrated lower BMI and BSA (Table 1). For HF, the left ventricular ejection fraction range was 20−35%, whereas creatinine and estimated glomerular filtration rate levels were on the high and low range, respectively, of normal. HF etiology, in addition to subjective and objective classification of HF using New York Heart Association and Weber-Janicki criteria, was balanced across patients (Table 1). Controls and HF demonstrated similar FVC (4.46 ± 0.86 vs. 4.11 ± 0.72 liters, P = 0.97), FEV1 (3.27 ± 0.72 vs. 3.14 ± 0.53 liters, P = 0.84), FEV1/FVC (73 ± 5 vs. 77 ± 6%, P = 0.46), and FEF25–75 (2.41 ± 0.89 vs. 2.70 ± 0.62 l/s, P = 0.98. All HF patients were on β-blockers, >40% were on angiotensin-converting enzyme inhibitors, nitrates, aspirin, and/or diuretics, and 33% were on ANG II receptor blockers and/or statins. Patients with HF remained on standard pharmacological therapy during testing. No participant demonstrated adverse events or required emergency medical attention during testing.
From CPET on study visit 1, compared with HF, controls demonstrated higher V̇o2peak (corrected for body weight) and PW (Table 1). This resulted in controls performing square-wave exercise on study visits 2 and 3 at greater absolute submaximal fixed workloads compared with HF. However, the pulmonary V̇o2 equivalent of 65% PW during CPET did not differ between groups (Table 1). Consistent with this, while illustrating that submaximal fixed workloads for square-wave exercise on visits 2 and 3 remained below AT in both groups, pulmonary V̇o2 at 65% PW as a percentage of pulmonary V̇o2 at AT also did not differ between groups (Table 1).
On-Transient Pulmonary V̇o2 Kinetics: Single- Versus Double-Exponential Functions
While initially constraining the phase I period to 20 s (see Data Processing and Modeling, On-transient pulmonary V̇o2 kinetics), on-transient pulmonary V̇o2 kinetic curve fits were not improved using double-exponential compared with single-exponential functions for controls (F3,32 = 0.70, P = 0.56) or HF (F3,32 = 0.14, P = 0.94; Table 2). Therefore, we assessed whether phase I period length affected single-exponential function curve fits of phase II pulmonary V̇o2 on-kinetics. Table 2 shows that RMSE across phase I period strategies did not differ within controls (F5,48 = 0.34, P = 0.89) or HF (F5,48 = 0.17, P = 0.97). Nevertheless, standardized differences were moderate to large compared with smaller (better fitting) RMSE of phase II curve fits that reflected a phase I period of 35 versus 15 s in both controls (PLB: ES = 1.0 and FNT: ES = 0.4) and HF (PLB: ES = 0.6 and FNT: ES = 0.7) (Table 2).
Phase II On-Transient Pulmonary V̇o2 Kinetics
Effects of group crossed with experimental condition on phase II V̇o2 kinetics responses reflective of phase I period lengths of 15, 25, or 35 s (i.e., illustrated as models 1−3, respectively) are shown in Table 3. There were no differences for the steady-state amplitude of phase II (A1) regardless of the phase II period start time. Likewise, after indexing A1 to work rate, phase II functional gain (A1/Δwork rate = A1g) for each of the different phase II period start times was higher (but not statistically significant) in HF compared with controls for both PLB and FNT, but in the absence of marked within-group differences. In contrast, while there were no differences for the TD of the phase II exponential increase in V̇o2 irrespective of the phase II period onset timing (Table 3), phase II pulmonary τV̇o2 kinetics were discernably shortened (consistent with robust ES) in FNT versus PLB within HF (Fig. 2A and Table 3), particularly when reflecting a phase I period of 35 s, whereas this was not observed within controls (Fig. 2B and Table 3).
Table 3.
Single-exponential phase II on-transient pulmonary V̇o2 kinetics parameter responses for both heart failure patients and age-matched healthy control subjects
| Healthy Control Subjects |
Heart Failure Patients |
||||||
|---|---|---|---|---|---|---|---|
| Parameter | PLB | FNT | ES | PLB | FNT | ES | P Value |
| YB, l/min | 0.3 ± 0.0 | 0.3 ± 0.1 | 0.00 | 0.4 ± 0.0 | 0.4 ± 0.1 | 0.00 | 0.12 |
| Model 1 | |||||||
| A1, l/min | 1.3 ± 0.4 | 1.3 ± 0.5 | 0.00 | 1.1 ± 0.3 | 1.1 ± 0.3 | 0.00 | 0.56 |
| A1 g, ml·min−1·W−1 | 11 ± 1 | 11 ± 1 | 0.00 | 14 ± 6 | 13 ± 4 | 0.27 | 0.07 |
| τ1, s | 46 ± 5c | 51 ± 8c | 1.00 | 62 ± 12a | 57 ± 12 | 0.66 | 0.06 |
| TD1, s | 13 ± 4c | 9 ± 5d | 1.33 | 5 ± 7 | 8 ± 13c | 0.35 | 0.30 |
| Model 2 | |||||||
| A1, l/min | 1.3 ± 0.4 | 1.3 ± 0.5 | 0.00 | 1.1 ± 0.3 | 1.1 ± 0.3 | 0.00 | 0.59 |
| A1 g, ml·min−1·W−1 | 11 ± 1 | 11 ± 1 | 0.00 | 14 ± 5 | 13 ± 4 | 0.33 | 0.07 |
| τ1, s | 41 ± 5 | 42 ± 12 | 0.12 | 60 ± 13a | 50 ± 14a,e | 1.16 | <0.01 |
| TD1, s | −1 ± 5e | −3 ± 5e | 0.63 | −4 ± 11 | −10 ± 11 | 0.86 | 0.76 |
| Model 3 | |||||||
| A1, l/min | 1.3 ± 0.4 | 1.3 ± 0.5 | 0.00 | 1.1 ± 0.3 | 1.1 ± 0.3 | 0.00 | 0.61 |
| A1 g, ml·min−1·W−1 | 11 ± 1 | 11 ± 1 | 0.00 | 14 ± 4 | 13 ± 4 | 0.40 | 0.08 |
| τ1, s | 39 ± 6 | 43 ± 11 | 0.70 | 57 ± 14a | 45 ± 11b,e | 1.43 | <0.01 |
| TD1, s | −8 ± 6 | −13 ± 6 | 1.32 | −3 ± 15 | −5 ± 10 | 0.22 | 0.18 |
Data are expressed as means ± SD. Models 1−3 are single-exponential functions demonstrating phase II on-transient pulmonary V̇o2 kinetics parameters reflecting phase I period durations set at 15, 25, and 35 s, respectively. ES, effect size (Cohen’s d) between condition within group, interpreted as follows: 0.0, trivial; 0.2, small; 0.5, moderate; and ≥0.8, large. YB, resting pulmonary V̇o2; A1, steady-state increase in pulmonary V̇o2 above rest; A1 g, functional gain; τ1, time constant; TD1, time delay. P values reflect an overall group-by-condition effect for the respective on-kinetics parameters for models 1−3.
P < 0.05, between group per experimental arm, following Tukey post hoc testing.
P < 0.05, PLB vs. FNT within the heart failure group, following Tukey post hoc testing.
P < 0.05, within group, model 1 vs. models 2 and 3, following Tukey post hoc testing.
P < 0.05, within group, model 1 vs. model 3, following Tukey post hoc testing.
P < 0.05, within group, model 2 vs. model 3, following Tukey post hoc testing.
Fig. 2.

Ensemble-averaged on-transient pulmonary V̇o2 kinetics in 10-s binned periods in representative participants of each group for placebo (PLB) or fentanyl (FNT). A and B: models represent single-exponential functions in heart failure (HF) and healthy control (CTL), respectively. The illustrated time constant (τ) in A and B for both experimental arms reflect an optimal cardiodynamic (phase I) period of 35 s representative of group means (see Tables 2 and 3 for further detail). The percent change noted in both A and B is that of each group (means ± SD) from PLB to FNT. The shaded area in A conceptualizes the influence that a prolonged τ in the absence of differences in steady-state V̇o2 has on increasing O2def. The sampling period accounted for >98% (i.e., τ × 4) of the response in A and B. C and D: residual plots of single-exponential function curve fits from A and B in HF and CTL, respectively. Residual plots illustrate single exponential functions fit from time = 0 or from an optimal phase I period extending from 0 to 35 s.
For both controls and HF across conditions, there was no effect of a varying phase I period length on A1 (control: F5,48 = 0.00, P = 0.99, and HF: F5,48 = 0.03, P = 0.99) or A1g (control: F5,48 = 0.03, P = 0.99, and HF: F5,48 = 0.07, P = 0.99). By comparison, consistent across experimental condition, a positive to negative TD of the phase II exponential increase in V̇o2 coincided with a lengthened phase I period within controls (F5,48 = 17.1, P < 0.01) and HF (F5,48 = 3.9, P < 0.01; Table 3). Likewise, accompanying a lengthened phase I period from 15 to 35 s, particularly when group III/IV locomotor afferents were inhibited via FNT, was the shortening of phase II pulmonary τV̇o2 kinetics within HF (F5,48 = 3.8, P < 0.01). Lengthening of the phase I period within controls resulted in a similar shortening of phase II pulmonary τV̇o2 kinetics regardless of condition (F5,48 = 38.7, P < 0.01; Table 3).
O2def
Differences in O2def between groups crossed with condition (F3,17 = 5.08, P = 0.01) were significant (Fig. 3A). This resulted in FNT contributing to reduced O2def compared with PLB within HF (ES = 1.62) but not within controls (ES = 0.46; Fig. 3A). In contrast, while matched for condition, there was no difference in O2def between controls and HF for FNT (ES = 0.13), whereas HF demonstrated significantly larger O2def in PLB compared with controls (ES = 1.67; Fig. 3A).
Fig. 3.
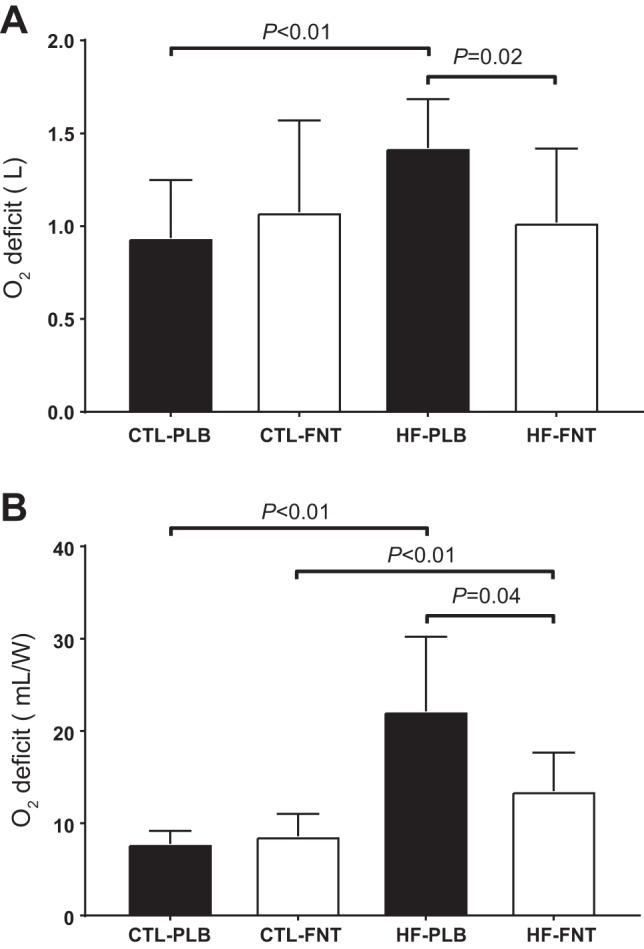
O2def for transitions of exercise instituted from rest beginning at time 0 using a single-exponential function (accounting for an unconstrained time delay, see Eq. 3). Data are expressed as means ± SD. A: absolute O2def. B: O2def indexed to relative fixed workloads (in W).
Consistent with the results shown in Fig. 3A, there was a stronger group-by-condition effect (F3,17 = 7.84, P < 0.01) for O2def when indexed to workload (Fig. 3B). However, in contrast to the results shown in Fig. 3A, this resulted in controls showing significantly smaller O2def compared with HF in FNT (ES = 1.44), whereas the remaining between (ES = 2.48)- and within (controls: ES = 0.54 and HF: ES = 1.61)-group differences shown in Fig. 3A persisted.
Basic Ventilatory and Cardiovascular Responses Time Aligned With Phase II V̇o2 On-Kinetics
As shown in Table 4, basic ventilatory and cardiovascular responses temporally aligned at the respective τ of the phase II exponential rise in V̇o2 (Table 3) resulted in blunted V̇E and fB responses in FNT compared with PLB within HF but not within controls. Likewise, whereas SBP and DBP were lower for both PLB and FNT in HF versus controls, V̇E was higher in HF than controls in PLB, but not when group III/IV afferents were inhibited (Table 4). Finally, although the percent change from τ to end exercise for V̇E, VT, HR, SBP, and MAP were lower in HF versus controls for PLB (Table 4), this could be expected when referencing prolonged phase II pulmonary τV̇o2 kinetics demonstrated by HF in PLB (Table 3).
Table 4.
Basic ventilatory and cardiovascular responses time aligned at the phase II on-transient pulmonary V̇O2 kinetic τ, percent change from rest to τ, or percent change from τ to end exercise
| Healthy Control Subjects |
Heart Failure Patients |
||||||
|---|---|---|---|---|---|---|---|
| Variable | PLB | FNT | ES | PLB | FNT | ES | P Value |
| At phase II V̇o2 on-kinetic τ | |||||||
| V̇e, l/min | 24 ± 6 | 24 ± 5 | 0.2 | 30 ± 6† | 21 ± 6* | 3.4 | <0.01 |
| fB, breaths/min | 24 ± 6 | 25 ± 5 | 0.2 | 26 ± 3 | 23 ± 5 | 0.8 | 0.27 |
| VT, liters | 1.12 ± 0.36 | 1.04 ± 0.27 | 0.3 | 1.22 ± 0.27 | 0.99 ± 0.14 | 1.2 | 0.13 |
| HR, beats/min | 97 ± 10 | 99 ± 10 | 0.2 | 89 ± 12 | 86 ± 15 | 0.3 | 0.33 |
| SBP, mmHg | 172 ± 14 | 166 ± 15 | 0.6 | 137 ± 18† | 127 ± 15† | 0.7 | <0.01 |
| DBP, mmHg | 68 ± 8 | 63 ± 7 | 1.1 | 62 ± 12 | 55 ± 10 | 0.7 | 0.06 |
| MAP, mmHg | 103 ± 8 | 97 ± 8 | 1.0 | 87 ± 12† | 79 ± 10† | 0.7 | <0.01 |
| Rest to τ | |||||||
| V̇e, % | 98 ± 33 | 107 ± 42 | 0.2 | 118 ± 32 | 65 ± 49* | 1.4 | 0.02 |
| fB, % | 46 ± 19 | 43 ± 18 | 0.1 | 32 ± 16 | 23 ± 27 | 0.7 | 0.24 |
| VT, % | 46 ± 40 | 45 ± 20 | 0.0 | 63 ± 19 | 31 ± 20 | 1.9 | 0.09 |
| HR, % | 37 ± 19 | 37 ± 16 | 0.0 | 28 ± 15 | 24 ± 16 | 0.4 | 0.47 |
| SBP, % | 16 ± 11 | 16 ± 9 | 0.0 | 12 ± 11 | 10 ± 9 | 0.4 | 0.65 |
| DBP, % | 0 ± 6 | −1 ± 7 | 0.1 | 4 ± 13 | −3 ± 9 | 0.5 | 0.38 |
| MAP, % | 9 ± 8 | 8 ± 6 | 0.1 | 8 ± 12 | 3 ± 8 | 0.8 | 0.47 |
| τ to end exercise | |||||||
| V̇e, % | 167 ± 22 | 154 ± 48 | 0.3 | 60 ± 38† | 113 ± 39 | 0.9 | <0.01 |
| fB, % | 31 ± 27 | 22 ± 22 | 0.4 | 14 ± 13 | 22 ± 20 | 0.3 | 0.50 |
| VT, % | 101 ± 44 | 107 ± 40 | 0.1 | 34 ± 26† | 72 ± 25 | 1.6 | <0.01 |
| HR, % | 36 ± 11 | 26 ± 14 | 0.8 | 13 ± 8† | 15 ± 13 | 0.1 | <0.01 |
| SBP, % | 40 ± 16 | 36 ± 12 | 0.3 | 18 ± 7† | 18 ± 10† | 0.1 | <0.01 |
| DBP, % | 11 ± 10 | 5 ± 7 | 0.7 | 2 ± 12 | 0 ± 3 | 0.2 | 0.16 |
| MAP, % | 27 ± 10 | 23 ± 10 | 0.5 | 11 ± 9† | 9 ± 6† | 0.2 | 0.01 |
Data are presented as means ± SD or as otherwise noted. The phase II on-kinetics pulmonary V̇o2 τ was determined via a single-exponential function using a phase I period constrained to 35 s. V̇e, minute ventilation; fB, respiratory rate; VT, tidal volume; HR, heart rate; SBP, systolic blood pressure; DBP, diastolic blood pressure; MAP, mean arterial pressure. P values reflect the overall group-by-condition effect.
Different within group, P < 0.05, following Tukey post hoc testing.
Different between group per experimental arm, P < 0.05, following Tukey post hoc testing.
DISCUSSION
The present study tested the influence of experimentally inhibiting group III/IV locomotor muscle afferents on on-transient pulmonary V̇o2 kinetics in HF patients as well as age-matched healthy controls. The novel finding of this study is that phase II pulmonary τV̇o2 kinetics in HF patients are influenced by peripheral-central musculoskeletal neurophysiological pathways involving group III/IV locomotor muscle afferents. We show that 1) by inhibiting group III/IV locomotor muscle afferents using lower lumbar intrathecal injection of FNT, compared with PLB, HF patients demonstrated a shortened τ for the phase II exponential rise in pulmonary V̇o2; 2) the favorable leftward displacement of phase II pulmonary τV̇o2 kinetics accompanying inhibition of group III/IV locomotor muscle afferents within HF aligned with phase II pulmonary τV̇o2 kinetics demonstrated by controls, irrespective of experimental condition; 3) in contrast to observing a decreased steady-state V̇o2 requirement (A1g) associated with inhibition of group III/IV locomotor muscle afferents within HF, rapid phase II pulmonary τV̇o2 kinetics accounted for decreased O2def demonstrated by HF in FNT compared with PLB; and 4) the overall optimal phase II pulmonary V̇o2 on-kinetics curve fit reflected a prolonged phase I period (35 s), consistent with reports of others in healthy aging (26, 29). Taken together, these data can be interpreted as uniquely faster phase II pulmonary τV̇o2 kinetics associated with inhibition of group III/IV locomotor muscle afferents in HF suggests independently occurring bulk O2 delivery to locomotor muscles may not be the limiting factor in pulmonary and, hence, muscle V̇o2 kinetics in contributing to exercise intolerance in HF.
Although not studied in HF, but certainly relevant to our noted points above, overlapping observations of Williamson et al. (49) and Grassi et al. (13) may be applied to this study to suggest, for example, V̇o2 kinetics in this experimental paradigm is likely to reflect integrated physiological consequences of hemodynamic maldistribution involving competing metabolically active integrated organ systems, such as respiratory and locomotor muscles, which is an occurrence that impairs exercise function in HF (30). Consistent with this hypothesis, we observed that ventilation and blood pressure appeared proportionately reduced when temporally aligned with rapid phase II pulmonary τV̇o2 kinetics associated with FNT compared with PLB within HF. This reduction in exercise ventilation associated with FNT could be taken to imply a lower level of work of breathing requiring minimal blood flow maldistribution away from locomotor toward respiratory muscles, as has been previously demonstrated in HF (30). Consequently, this may have led to lessened reliance on nonoxidative energy demand, reflected as shortened phase II pulmonary τV̇o2 kinetics in HF, while further resulting in decreased accumulation of harmful byproducts of metabolism (e.g., H+, Pi, and La−) available to activate group III/IV muscle afferents. Nevertheless, we acknowledge that tests of regional blood flow distribution or work of breathing were not performed at present to confirm these hypotheses, potentially explaining differences in V̇o2 kinetics within HF. However, the possibility of such integrative mechanistic relationships cannot be discounted as an augmented exercise pressor reflex coupled to an increased ventilatory equivalent for metabolic (O2) demand likened to abnormal group III/IV muscle afferent traffic is an ideal candidate mechanism in provoking such a hemodynamic maldistribution model leading to abnormal V̇o2 kinetics and exercise intolerance in HF (1, 11, 21, 28, 31, 35, 49).
In contrast, but while still physiologically linked to peripheral-central hemodynamic maldistribution, noteworthy discussions spanning across study lines of slowed V̇o2 kinetics (both pulmonary and muscle) to abnormal activation of group III/IV afferents commonly implicate the milieu of the blood biochemical intramuscular environment (20, 22–24, 50) as a key factor preceding the cascade of events leading to exercise intolerance in HF (1, 28, 31, 37, 39, 42). For example, it has been suggested by Scott et al. (39, 40), Crisafulli et al. (11), our group (31, 44), and others (1, 35) that skeletal muscle phenotypes, particularly those associated with provoking recruitment of nonoxidative energetic demands (leading to, e.g., increased H+, increased Pi/phosphocreatine, and increased La−) prime an intramuscular environment ideal for group III/IV afferent activation, resulting in exercise intolerance secondary to augmented SVR, blood pressure, and ventilation in HF. Likewise, there are well-established parallels between prolonged V̇o2 kinetics and increased O2def coinciding with skeletal muscle characteristics that include unfavorable contributions from ↑ type IIb fiber (glycolytic) recruitment/proportion, increased H+, and increased Pi/phosphocreatine in potentially explaining the predisposition for exercise intolerance in HF (5, 7, 18, 25, 28, 36, 37, 42). On the basis of these data, we suggest those pathologic musculoskeletal events synergize to abnormally activate group III/IV afferents while lessening the ability of integrated pulmonary and circulatory systems to respond appropriately to the energy demands of exercise in HF.
Finally, consistent with our hypothesis that independently occurring increased bulk (O2) flow does not explain shortened phase II pulmonary τV̇o2 kinetics associated with inhibition of group III/IV locomotor muscle afferents within HF, we note that a limb-to-lung transit time (phase I period of 35 s) appeared to provide optimal phase II period curve fitting, irrespective of group and condition. This observation is in contrast to what might be expected given the temporal alignment of integrated pulmonary and circulatory responses demonstrated during studies of group III/IV locomotor afferents and impulse exercise (i.e., no involvement in central motor command) in healthy adults (17). If bulk changes in circulation (arterial inflow and venous outflow) are to independently explain V̇o2 kinetics, then with increased large-diameter vascular conductance and limb blood flow (1), both controls and HF should have demonstrated mirrored shortening of phase I and II kinetics in FNT versus PLB in this study. In the absence of observing phase I and II sector timings uniformly shorten in FNT and PLB, the present observations may be taken to imply that the rapidity of peripheral-central blood flow distribution is sufficient to meet the energy demands of exercise in controls but not in HF (30). Likewise, simulation pulmonary V̇o2 kinetics models of Barstow and Molé (3) may be taken to suggest that given adequately balanced peripheral-central hemodynamic distribution paralleled by an ability of skeletal muscle not to disproportionately rely on nonoxidative (substrate level) machinery, in an ideal model response, phase II pulmonary τV̇o2 kinetics could, indeed, be expected to shorten, given a slowed phase I period.
Limitations
In contrast to the strengths of this study, we acknowledge that conclusions drawn from these data should be considered with the understanding that limitations have been associated with the experimental approach and involved methodologies used to test our hypotheses. We did not perform the “gold” standard of invasive tests of cardiac hemodynamics (i.e., direct Fick), arterial-mixed venous differences, locomotor hemodynamics (e.g., thermodilution), and skeletal muscle structure and biocellular function, as they specifically relate to muscle V̇o2 kinetics. Therefore, we cannot confirm that on-transient pulmonary V̇o2 kinetics factually estimate on-transient muscle V̇o2 kinetics in this specific experimental paradigm. Nevertheless, on-transient pulmonary V̇o2 kinetics have been well studied in the absence of our newly implemented scientific feature in both animal and human models across the health-disease spectrum, which suggests the noninvasive on-transient pulmonary V̇o2 kinetics approach can be used to approximate muscle V̇o2 kinetics in humans (5, 12–14, 18, 25, 26, 29, 36–38).
In modeling on-transient pulmonary V̇o2 kinetics, there have been numerous reported strategies that involve differences in data postprocessing methods, selection of model parameters, and appropriateness of single-exponential versus multiexponential models that may offer the best fit of experimental data, but none of which are exclusively used across studies (5, 12–14, 18, 25, 26, 29, 36–38). Therefore, although we recognize that confounding variability can be introduced during the process of modeling on-transient pulmonary V̇o2 kinetics, based on those and other technical factors [e.g., constrained vs. unconstrained parameters, length of pulmonary V̇o2 data bins (1, 5, or 10 s for exponential modeling), and work instituted from rest vs. unloaded pedaling], we were careful in selecting the present data postprocessing and computation approaches for our on-transient pulmonary V̇o2 kinetics models, based on several studies that are established works in this field (6, 29, 32, 33, 48). On-transient pulmonary V̇o2 kinetics parameter outcomes from these data as well as model-fit diagnostic variables (i.e., RMSE and residual plots) suggest adequacy of model selection criteria based on our study design.
Finally, while we recognize that reporting off-transient pulmonary V̇o2 kinetics would have strengthened, and perhaps helped to confirm interpretations of our on-transient pulmonary V̇o2 kinetics data, as well as those previously reported by others in HF (5, 7, 18, 25, 28, 36, 37, 42), we did not quantify off-transient pulmonary V̇o2 kinetics. However, the absence of reporting those data is in large part due to unaccountable factors (e.g., the mouthpiece coming off the participant) that led to data collection during postexercise recovery not being homogeneously collected across sessions and participants, and, consequently, off-transient pulmonaryV̇o2 kinetics modeling could not be completed with high fidelity.
Conclusions
The primary original finding of this study is that abnormal group III/IV locomotor muscle afferents may play an important role in prolonged on-transient exercise pulmonary V̇o2 kinetics in HF. Synergistically contributing to exercise intolerance in HF, these data lend support for the hypothesis that prolonged V̇o2 kinetics and peripheral-central hemodynamic maldistribution linked to increased SVR, blood pressure, and ventilation (provoked by abnormal group III/IV locomotor muscle afferent activation) are not independently occurring exercise events in patients with HF. Overlapping cardiovascular responses with patterns of phase II pulmonary τV̇o2 kinetics suggest there are meaningful clinical implications associated with expanding the clinical interpretation of exercise V̇o2 beyond absolute steady-state V̇o2 responses in HF. Phenotyping the integrated physiological peripheral-central coupling of pulmonary, circulatory, and nervous system responses to exercise using coinciding tests of V̇o2 kinetics and cardiovascular control should strengthen the clinical interpretive value of testing exercise V̇o2 in HF patients.
GRANTS
Funding for this work was supported by National Heart, Lung, and Blood Institute Grants HL-126638 (to T. P. Olson), HL-071478 (to B. D. Johnson), and HL-46493 (to M. J. Joyner), the Frank R. and Shari Caywood Professorship (to M. J. Joyner), and the American Heart Association Grant 16POST30260021 (to E. H. Van Iterson).
DISCLOSURES
No conflicts of interest, financial or otherwise, are declared by the authors.
AUTHOR CONTRIBUTIONS
E.H.V., M.J.J., T.B.C., and T.P.O. performed experiments; E.H.V. and T.P.O. analyzed data; E.H.V. and T.P.O. interpreted results of experiments; E.H.V. and T.P.O. prepared figures; E.H.V., B.D.J., M.J.J., T.B.C., and T.P.O. drafted manuscript; E.H.V., B.D.J., M.J.J., T.B.C., and T.P.O. edited and revised manuscript; E.H.V., B.D.J., M.J.J., T.B.C., and T.P.O. approved final version of manuscript; B.D.J., M.J.J., T.B.C., and T.P.O. conceived and designed research.
ACKNOWLEDGMENTS
The authors thank the participants who volunteered for this study.
REFERENCES
- 1.Amann M, Venturelli M, Ives SJ, Morgan DE, Gmelch B, Witman MA, Jonathan Groot H, Walter Wray D, Stehlik J, Richardson RS. Group III/IV muscle afferents impair limb blood in patients with chronic heart failure. Int J Cardiol 174: 368–375, 2014. doi: 10.1016/j.ijcard.2014.04.157. [DOI] [PMC free article] [PubMed] [Google Scholar]
- 2.Balady GJ, Arena R, Sietsema K, Myers J, Coke L, Fletcher GF, Forman D, Franklin B, Guazzi M, Gulati M, Keteyian SJ, Lavie CJ, Macko R, Mancini D, Milani RV; American Heart Association Exercise, Cardiac Rehabilitation, and Prevention Committee of the Council on Clinical Cardiology; Council on Epidemiology and Prevention; Council on Peripheral Vascular Disease; Interdisciplinary Council on Quality of Care and Outcomes Research . Clinician’s guide to cardiopulmonary exercise testing in adults: a scientific statement from the American Heart Association. Circulation 122: 191–225, 2010. doi: 10.1161/CIR.0b013e3181e52e69. [DOI] [PubMed] [Google Scholar]
- 3.Barstow TJ, Molé PA. Simulation of pulmonary O2 uptake during exercise transients in humans. J Appl Physiol (1985) 63: 2253–2261, 1987. [DOI] [PubMed] [Google Scholar]
- 4.Beaver WL, Wasserman K, Whipp BJ. A new method for detecting anaerobic threshold by gas exchange. J Appl Physiol (1985) 60: 2020–2027, 1986. [DOI] [PubMed] [Google Scholar]
- 5.Belardinelli R, Barstow TJ, Nguyen P, Wasserman K. Skeletal muscle oxygenation and oxygen uptake kinetics following constant work rate exercise in chronic congestive heart failure. Am J Cardiol 80: 1319–1324, 1997. doi: 10.1016/S0002-9149(97)00672-3. [DOI] [PubMed] [Google Scholar]
- 6.Bell C, Paterson DH, Kowalchuk JM, Padilla J, Cunningham DA. A comparison of modelling techniques used to characterise oxygen uptake kinetics during the on-transient of exercise. Exp Physiol 86: 667–676, 2001. doi: 10.1113/eph8602150. [DOI] [PubMed] [Google Scholar]
- 7.Brunner-La Rocca HP, Weilenmann D, Schalcher C, Schlumpf M, Follath F, Candinas R, Kiowski W. Prognostic significance of oxygen uptake kinetics during low level exercise in patients with heart failure. Am J Cardiol 84: 741–744, 1999. doi: 10.1016/S0002-9149(99)00426-9. [DOI] [PubMed] [Google Scholar]
- 8.Chin LM, Leigh RJ, Heigenhauser GJ, Rossiter HB, Paterson DH, Kowalchuk JM. Hyperventilation-induced hypocapnic alkalosis slows the adaptation of pulmonary O2 uptake during the transition to moderate-intensity exercise. J Physiol 583: 351–364, 2007. doi: 10.1113/jphysiol.2007.132837. [DOI] [PMC free article] [PubMed] [Google Scholar]
- 9.Cohen J. A power primer. Psychol Bull 112: 155–159, 1992. doi: 10.1037/0033-2909.112.1.155. [DOI] [PubMed] [Google Scholar]
- 10.Crapo RO, Morris AH, Gardner RM. Reference spirometric values using techniques and equipment that meet ATS recommendations. Am Rev Respir Dis 123: 659–664, 1981. [DOI] [PubMed] [Google Scholar]
- 11.Crisafulli A, Salis E, Tocco F, Melis F, Milia R, Pittau G, Caria MA, Solinas R, Meloni L, Pagliaro P, Concu A. Impaired central hemodynamic response and exaggerated vasoconstriction during muscle metaboreflex activation in heart failure patients. Am J Physiol Heart Circ Physiol 292: H2988–H2996, 2007. doi: 10.1152/ajpheart.00008.2007. [DOI] [PubMed] [Google Scholar]
- 12.DeLorey DS, Kowalchuk JM, Paterson DH. Effect of age on O2 uptake kinetics and the adaptation of muscle deoxygenation at the onset of moderate-intensity cycling exercise. J Appl Physiol (1985) 97: 165–172, 2004. doi: 10.1152/japplphysiol.01179.2003. [DOI] [PubMed] [Google Scholar]
- 13.Grassi B, Poole DC, Richardson RS, Knight DR, Erickson BK, Wagner PD. Muscle O2 uptake kinetics in humans: implications for metabolic control. J Appl Physiol 80: 988–998, 1996. [DOI] [PubMed] [Google Scholar]
- 14.Gurd BJ, Peters SJ, Heigenhauser GJ, LeBlanc PJ, Doherty TJ, Paterson DH, Kowalchuk JM. O2 uptake kinetics, pyruvate dehydrogenase activity, and muscle deoxygenation in young and older adults during the transition to moderate-intensity exercise. Am J Physiol Regul Integr Comp Physiol 294: R577–R584, 2008. doi: 10.1152/ajpregu.00537.2007. [DOI] [PubMed] [Google Scholar]
- 15.Gurd BJ, Peters SJ, Heigenhauser GJ, LeBlanc PJ, Doherty TJ, Paterson DH, Kowalchuk JM. Prior heavy exercise elevates pyruvate dehydrogenase activity and speeds O2 uptake kinetics during subsequent moderate-intensity exercise in healthy young adults. J Physiol 577: 985–996, 2006. doi: 10.1113/jphysiol.2006.112706. [DOI] [PMC free article] [PubMed] [Google Scholar]
- 16.Hansen JE, Sue DY, Wasserman K. Predicted values for clinical exercise testing. Am Rev Respir Dis 129, 2P2: S49–S55, 1984. doi: 10.1164/arrd.1984.129.2P2.S49. [DOI] [PubMed] [Google Scholar]
- 17.Haouzi P, Chenuel B, Chalon B. Control of breathing and muscle perfusion in humans. Exp Physiol 86: 759–768, 2001. doi: 10.1111/j.1469-445X.2001.tb00041.x. [DOI] [PubMed] [Google Scholar]
- 18.Kemps HM, De Vries WR, Hoogeveen AR, Zonderland ML, Thijssen EJ, Schep G. Reproducibility of onset and recovery oxygen uptake kinetics in moderately impaired patients with chronic heart failure. Eur J Appl Physiol 100: 45–52, 2007. doi: 10.1007/s00421-007-0398-7. [DOI] [PMC free article] [PubMed] [Google Scholar]
- 19.Lamarra N, Whipp BJ, Ward SA, Wasserman K. Effect of interbreath fluctuations on characterizing exercise gas exchange kinetics. J Appl Physiol 62: 2003–2012, 1987. [DOI] [PubMed] [Google Scholar]
- 20.Mancini DM, Coyle E, Coggan A, Beltz J, Ferraro N, Montain S, Wilson JR. Contribution of intrinsic skeletal muscle changes to 31P NMR skeletal muscle metabolic abnormalities in patients with chronic heart failure. Circulation 80: 1338–1346, 1989. doi: 10.1161/01.CIR.80.5.1338. [DOI] [PubMed] [Google Scholar]
- 21.Mancini DM, Henson D, LaManca J, Levine S. Evidence of reduced respiratory muscle endurance in patients with heart failure. J Am Coll Cardiol 24: 972–981, 1994. doi: 10.1016/0735-1097(94)90858-3. [DOI] [PubMed] [Google Scholar]
- 22.Massie B, Conway M, Yonge R, Frostick S, Ledingham J, Sleight P, Radda G, Rajagopalan B. Skeletal muscle metabolism in patients with congestive heart failure: relation to clinical severity and blood flow. Circulation 76: 1009–1019, 1987. doi: 10.1161/01.CIR.76.5.1009. [DOI] [PubMed] [Google Scholar]
- 24.Massie BM, Conway M, Yonge R, Frostick S, Sleight P, Ledingham J, Radda G, Rajagopalan B. 31P nuclear magnetic resonance evidence of abnormal skeletal muscle metabolism in patients with congestive heart failure. Am J Cardiol 60: 309–315, 1987. doi: 10.1016/0002-9149(87)90233-5. [DOI] [PubMed] [Google Scholar]
- 25.Meyer K, Schwaibold M, Hajric R, Westbrook S, Ebfeld D, Leyk D, Roskamm H. Delayed V̇o2 kinetics during ramp exercise: a criterion for cardiopulmonary exercise capacity in chronic heart failure. Med Sci Sports Exerc 30: 643–648, 1998. doi: 10.1097/00005768-199805000-00001. [DOI] [PubMed] [Google Scholar]
- 26.Mezzani A, Grassi B, Giordano A, Corrà U, Colombo S, Giannuzzi P. Age-related prolongation of phase I of V̇o2 on-kinetics in healthy humans. Am J Physiol Regul Integr Comp Physiol 299: R968–R976, 2010. doi: 10.1152/ajpregu.00739.2009. [DOI] [PubMed] [Google Scholar]
- 27.Miller MR, Hankinson J, Brusasco V, Burgos F, Casaburi R, Coates A, Crapo R, Enright P, van der Grinten CP, Gustafsson P, Jensen R, Johnson DC, MacIntyre N, McKay R, Navajas D, Pedersen OF, Pellegrino R, Viegi G, Wanger J, Force AET; ATS/ERS Task Force . Standardisation of spirometry. Eur Respir J 26: 319–338, 2005. doi: 10.1183/09031936.05.00034805. [DOI] [PubMed] [Google Scholar]
- 28.Mitchell SH, Steele NP, Leclerc KM, Sullivan M, Levy WC. Oxygen cost of exercise is increased in heart failure after accounting for recovery costs. Chest 124: 572–579, 2003. doi: 10.1378/chest.124.2.572. [DOI] [PubMed] [Google Scholar]
- 29.Murias JM, Spencer MD, Kowalchuk JM, Paterson DH. Influence of phase I duration on phase II V̇o2 kinetics parameter estimates in older and young adults. Am J Physiol Regul Integr Comp Physiol 301: R218–R224, 2011. doi: 10.1152/ajpregu.00060.2011. [DOI] [PubMed] [Google Scholar]
- 30.Olson TP, Joyner MJ, Dietz NM, Eisenach JH, Curry TB, Johnson BD. Effects of respiratory muscle work on blood flow distribution during exercise in heart failure. J Physiol 588: 2487–2501, 2010. doi: 10.1113/jphysiol.2009.186056. [DOI] [PMC free article] [PubMed] [Google Scholar]
- 31.Olson TP, Joyner MJ, Eisenach JH, Curry TB, Johnson BD. Influence of locomotor muscle afferent inhibition on the ventilatory response to exercise in heart failure. Exp Physiol 99: 414–426, 2014. doi: 10.1113/expphysiol.2013.075937. [DOI] [PubMed] [Google Scholar]
- 32.Özyener F, Rossiter HB, Ward SA, Whipp BJ. Influence of exercise intensity on the on- and off-transient kinetics of pulmonary oxygen uptake in humans. J Physiol 533: 891–902, 2001. doi: 10.1111/j.1469-7793.2001.t01-1-00891.x. [DOI] [PMC free article] [PubMed] [Google Scholar]
- 33.Paterson DH, Whipp BJ. Asymmetries of oxygen uptake transients at the on- and offset of heavy exercise in humans. J Physiol 443: 575–586, 1991. doi: 10.1113/jphysiol.1991.sp018852. [DOI] [PMC free article] [PubMed] [Google Scholar]
- 34.Ponikowski P, Francis DP, Piepoli MF, Davies LC, Chua TP, Davos CH, Florea V, Banasiak W, Poole-Wilson PA, Coats AJ, Anker SD. Enhanced ventilatory response to exercise in patients with chronic heart failure and preserved exercise tolerance: marker of abnormal cardiorespiratory reflex control and predictor of poor prognosis. Circulation 103: 967–972, 2001. doi: 10.1161/01.CIR.103.7.967. [DOI] [PubMed] [Google Scholar]
- 35.Ponikowski PP, Chua TP, Francis DP, Capucci A, Coats AJ, Piepoli MF. Muscle ergoreceptor overactivity reflects deterioration in clinical status and cardiorespiratory reflex control in chronic heart failure. Circulation 104: 2324–2330, 2001. doi: 10.1161/hc4401.098491. [DOI] [PubMed] [Google Scholar]
- 36.Riley M, Pórszász J, Stanford CF, Nicholls DP. Gas exchange responses to constant work rate exercise in chronic cardiac failure. Br Heart J 72: 150–155, 1994. doi: 10.1136/hrt.72.2.150. [DOI] [PMC free article] [PubMed] [Google Scholar]
- 37.Roditis P, Dimopoulos S, Sakellariou D, Sarafoglou S, Kaldara E, Venetsanakos J, Vogiatzis J, Anastasiou-Nana M, Roussos C, Nanas S. The effects of exercise training on the kinetics of oxygen uptake in patients with chronic heart failure. Eur J Cardiovasc Prev Rehabil 14: 304–311, 2007. doi: 10.1097/HJR.0b013e32808621a3. [DOI] [PubMed] [Google Scholar]
- 38.Rossiter HB, Ward SA, Howe FA, Kowalchuk JM, Griffiths JR, Whipp BJ. Dynamics of intramuscular 31P-MRS Pi peak splitting and the slow components of PCr and O2 uptake during exercise. J Appl Physiol 93: 2059–2069, 2002. doi: 10.1152/japplphysiol.00446.2002. [DOI] [PubMed] [Google Scholar]
- 39.Scott AC, Wensel R, Davos CH, Georgiadou P, Kemp M, Hooper J, Coats AJ, Piepoli MF. Skeletal muscle reflex in heart failure patients: role of hydrogen. Circulation 107: 300–306, 2003. doi: 10.1161/01.CIR.0000042704.37387.29. [DOI] [PubMed] [Google Scholar]
- 40.Scott AC, Wensel R, Davos CH, Kemp M, Kaczmarek A, Hooper J, Coats AJ, Piepoli MF. Chemical mediators of the muscle ergoreflex in chronic heart failure: a putative role for prostaglandins in reflex ventilatory control. Circulation 106: 214–220, 2002. doi: 10.1161/01.CIR.0000021603.36744.5E. [DOI] [PubMed] [Google Scholar]
- 41.Segal SS, Kurjiaka DT. Coordination of blood flow control in the resistance vasculature of skeletal muscle. Med Sci Sports Exerc 27: 1158–1164, 1995. doi: 10.1249/00005768-199508000-00009. [DOI] [PubMed] [Google Scholar]
- 42.Sietsema KE, Ben-Dov I, Zhang YY, Sullivan C, Wasserman K. Dynamics of oxygen uptake for submaximal exercise and recovery in patients with chronic heart failure. Chest 105: 1693–1700, 1994. doi: 10.1378/chest.105.6.1693. [DOI] [PubMed] [Google Scholar]
- 43.Smith SA, Mitchell JH, Naseem RH, Garry MG. Mechanoreflex mediates the exaggerated exercise pressor reflex in heart failure. Circulation 112: 2293–2300, 2005. doi: 10.1161/CIRCULATIONAHA.105.566745. [DOI] [PubMed] [Google Scholar]
- 44.Van Iterson EH, Snyder EM, Johnson BD, Olson TP. Influence of the metaboreflex on pulmonary vascular capacitance in heart failure. Med Sci Sports Exerc 48: 353–362, 2016. doi: 10.1249/MSS.0000000000000775. [DOI] [PMC free article] [PubMed] [Google Scholar]
- 45.Van Iterson EH, Snyder EM, Joyner MJ, Johnson BD, Olson TP. Intrathecal fentanyl blockade of afferent neural feedback from skeletal muscle during exercise in heart failure patients: Influence on circulatory power and pulmonary vascular capacitance. Int J Cardiol 201: 384–393, 2015. doi: 10.1016/j.ijcard.2015.08.101. [DOI] [PMC free article] [PubMed] [Google Scholar]
- 46.Wasserman K, Whipp BJ, Castagna J. Cardiodynamic hyperpnea: hyperpnea secondary to cardiac output increase. J Appl Physiol 36: 457–464, 1974. [DOI] [PubMed] [Google Scholar]
- 47.Whipp BJ. The slow component of O2 uptake kinetics during heavy exercise. Med Sci Sports Exerc 26: 1319–1326, 1994. doi: 10.1249/00005768-199411000-00005. [DOI] [PubMed] [Google Scholar]
- 48.Whipp BJ, Ward SA, Lamarra N, Davis JA, Wasserman K. Parameters of ventilatory and gas exchange dynamics during exercise. J Appl Physiol Respir Environ Exerc Physiol 52: 1506–1513, 1982. [DOI] [PubMed] [Google Scholar]
- 49.Williamson JW, Raven PB, Whipp BJ. Unaltered oxygen uptake kinetics at exercise onset with lower-body positive pressure in humans. Exp Physiol 81: 695–705, 1996. doi: 10.1113/expphysiol.1996.sp003970. [DOI] [PubMed] [Google Scholar]
- 50.Wilson JR, Martin JL, Schwartz D, Ferraro N. Exercise intolerance in patients with chronic heart failure: role of impaired nutritive flow to skeletal muscle. Circulation 69: 1079–1087, 1984. doi: 10.1161/01.CIR.69.6.1079. [DOI] [PubMed] [Google Scholar]