Abstract
We have studied the ability of quercetin (a bioflavonoid) in tackling oxidative stress to alleviate the symptoms during ammonium chloride-induced hyperammonemia. Hyperammonemia was induced by the treatment of ammonium chloride (AC) 100 mg/kg b.w for 56 days. Hyperammonemic rats exhibited reduced urea (in plasma) and increased ammonia (in blood), uric acid (in plasma), creatinine (in serum), oxidative stress markers (thiobarbituric acid reactive substances (TBARS) and hydroperoxides (HP) and decreased levels of antioxidants (enzymatic and non-enzymatic) superoxide dismutase (SOD), catalase (CAT), glutathione peroxidase (GPx), reduced glutathione (GSH) in plasma and tissues (liver and brain) vitamins E and C (in plasma)). The expression of liver inflammatory markers such as, interleukin 6 (IL-6), inducible nitric oxide synthase (iNOS) and nuclear transcription factor-κB (NF-κB) (by western blotting) were investigated. Histological damages (in liver, brain and kidney) were observed under hyperammonemia and the administration of quercetin (1) normalized the histopathological alterations, (2) reduced the levels of TBARS and HP, (3) elevated the antioxidants (SOD, CAT, GPx, GSH, vitamins E and C), (4) declined the activities of liver marker enzymes (AST, ALT and ALP) and (5) down regulated the expression of IL-6, iNOS and NF-κB. Our results suggest that quercetin might exert defense to AC-induced hyperammonemic rats to tackle (1) oxidative stress and (2) inflammation owing to its antioxidant, anti-inflammatory and cytoprotective effects.
Keywords: Quercetin, Hyperammonaemia, Ammonium chloride, Antioxidant, Lipid peroxidation
Introduction
Ammonia is a well-known neurotoxin which causes nervous system disorders. Experimental hyperammonemia generally provoked by systemic administration of ammonium chloride, could cause a considerable elevation of brain ammonia content and stimulates tonic convulsions in rodents [1]. Hyperammonemia leads to neurological irregularities as noticed in hepatic encephalopathy (HE) and in congenital defect in ammonia catabolism. Ammonia interferes with excitatory as well as inhibitory nervous diffusion in the brain of mammals by various contrivances [2]. Ammonia noxiousness arises essentially through redox homeostasis, which causes enhanced lipid peroxidation and ROS generation. Hepatic encephalopathies, Reye’s syndrome, seizures, somnolence, and abnormal cerebral functions clearly elucidate the lethal impact of ammonia towards CNS [3]. Oxidative stress provoked by ammonia causes unwarranted synthesis of superoxide radical (O2 −) and hydrogen peroxide (H2O2) [4]. Excess reactive oxygen species (ROS) repeatedly damage the lipids, proteins and DNA. However, the amount of lipid peroxidation in tissues is regulated by variety of cellular defense by antioxidant (enzymatic and nonenzymatic) system [5], which is swiftly induced and competent to tackle oxidative stress.
Quercetin (a natural flavonoid) present in several edible vegetables and fruits, such as apple, tea, onion, grape, herbs and spices, elicits protection in different models of oxidative stress [6]; it provides favorable effects in morbid conditions such as cancer, pulmonary, cardiovascular diseases. Quercetin has been proven to be an antioxidant owing to its powerful capability to scavenge free radicals by metal chelation, via resistance of pro-oxidative enzymes and lipid peroxidation; it is a powerful anti-inflammatory compound that could exhibit antihistamic, antiperoxidative effects and it is an anti-apoptotic agent. Recent studies indicated that quercetin inhibits neuronal cell death, consequence to apoptosis induced by the activation of microglia [7]. Quercetin has also proven to be neuroprotective. The study aims to systematically analyze the protective influence of quercetin in AC-induced hyperammoneia in male wistar rats by investigating the markers of redox homeostasis and inflammation.
Materials and Methods
Experimental Animals
Male Wistar rats (180–200 g) were bought from Central Animal House, Faculty of Medicine, Annamalai University, Tamil Nadu and India. They were maintained at 24 ± 2 °C on 12 h light/dark cycles. The rats were nourished with normal diet pellets (Hindustan Lever Ltd., Bangalore, India) and water ad libitium. Investigations were performed conferring to the ethical norms of the Institutional Animal Ethics Committee of Annamalai University (Approval No. 994, dated 02.05.2013). The rats were acclimatized for a week before starting the experiments.
Chemicals
Quercetin, thiobarbituric acid, butylatedhydroxytoluene, nitrobluetetrazolium, phenazine methosulphate and glutathione were procured from Sigma (St. Louis, MO, USA). Ammonium chloride was purchased from Sisco Research Laboratories, Mumbai, India. The primary polyclonal antibodies (anti-rat IL-6, anti-rat NF-κB, anti-rat iNOS and anti-rat β-actin) were bought from Santa Cruz Biotech, CA, USA. The secondary antibodies were procured from Bangalore Genei, Bangalore, India. All other chemicals were obtained from Sigma (St. Louis, MO, USA).
Experimental Design
Hyperammonemia has been evoked in rats through intraperitoneal injection (i.p) of AC (100 mg/kg b.w) for 56 days [8]. Animals were randomly categorized into 4 groups containing six animals in each group. Group I—(control), group II—administered with AC (100 mg/kg b.w), group III—treated with AC and quercetin (50 mg/kg b.w), group IV treated with quercetin only [9].
Biochemical Analyses and Histopathological Examination
At the end of experiment, tissues (liver, brain and kidney) were dissected from all the groups, washed with saline and immovable with formalin (10 %). Subsequently, the tissues were processed and set in paraffin. The organ tissues were sectioned and stained with haematoxylin and eosin (H and E) and observed under a (100× magnification) microscope.
Determination of Blood Ammonia and Plasma Urea, Uric Acid and Serum Creatinine
Blood ammonia was determined with an Roche/Hitachi 912 kit [10]. Plasma urea was estimated with Roche/Hitachi 912 kit. Urea reacts with diacetylmonoxime in acidic pH and forms a pink colored complex and was read (540 nm). Contents of urea, uric acid, non-protein nitrogen and creatinine were estimated in plasma [11].
Estimation of Products of Lipid Peroxidation
Plasma TBARS was estimated [12] via their action through thiobarbituric acid (TBA) in acidic conditions to form a pink-colored chromophore, which has absorbance peak at 530 nm. The content of TBARS in the liver and brain was assessed [13]. The estimation of lipid hydroperoxides (HP) in plasma, liver and brain was performed [14]. In this method, reaction of ferrous ion in acidic conditions forms xylenol orange (a chromophore), which was read at 560 nm.
Assay of Antioxidants
The activity of superoxide dismutase (SOD) in the liver and brain tissues was measured [15] Superoxide radical reacts with nitroblue tetrazolium in condensed nicotinamide adenine dinucleotide and forms formazon blue product. SOD arrests the generation of borazon blue. The strength of the color is proportionate to the action of the enzyme which was read at 560 nm. The action of catalase in liver and brain was assayed [16]. Dichromate in acetic acid forms perchromic acid which is converted to chromic acetate when heated with hydrogen peroxide. The chromic acetate formed was read at 620 nm. Reduced glutathione (GSH) levels in liver and brain tissues were estimated [17]. This method is established by the formation of yellow color; owing to the reaction of dithionitro benzoic acid with mixtures having sulfhydryl clutches which was read at 412 nm. Glutathione peroxidase (GPx) action was measured. By addition of sample, the enzyme reacts with H2O2 and GSH; colour formed was measured [18].
Plasma α-tocopherol was estimated [19]. This method is based on the conversion of ferric ions to ferrous ions by α-tocopherol and the development of a red-colored colour with 2,2′-dipyridyl read at 520 nm. Plasma vitamin C was determined [20].
Determination of Liver Marker Enzymes
Activities of (AST and ALT) were assessed [21]. 0.2 ml of serum with 1 ml of substrate [aspartate and α-ketoglutarate (α-KG) for AST: alanine and α-KG for ALT] in phosphate buffer (pH 7.4) was incubated at 37 °C (60 min intended AST and 30 min for ALT). 1 ml of 2, 4-dinitrophenylhydrazine (DNPH) solution on was added to stop the reaction and again incubated for 20 min at 25 °C. Then, 1 ml of NaOH (0.4 N) colour was measured at 540 nm. The ALP content was estimated by using disodium phenyl phosphate as substrate. Following the incubation with bicarbonate buffer (0.1 M, pH 10) and the substrate for 10 min, serum (0.2 ml) was added kept at 25 °C (for 15 min) Folin-Phenol reagent (1 ml) was added. The suspension sodium bicarbonate (2 ml, 10 %) was added and the colour was read at 680 nm after 15 min.
Western Blot Analysis
The expression of IL-6, iNOS and NF-κB in liver was investigated. The liver tissue sections were homogenized in chilled RIPA buffer (Triton (1 %), SDS (0.1 %), 0.5 % deoxycholate (0.5 %), EDTA (1 mmol), Tris (20 mM, pH 7.4), NaCl (150 mmol), NaF (10 mmol), and 0.1 mmol/L phenylmethylsulfonyl fluoride (PMSF, 0.1 mmol)) and centrifuged at 12,000 rpm for 15 min at 4 °C. The total protein was estimated [22]. Samples encompassing 50 µg of proteins were loaded on a 10 % sodium dodecyl sulfate–polyacrylamide gel electrophoresis was carried out (SDS-PAGE) at 100 V for 3 h, and then transferred onto PVDF membrane (Millipore). The membranes were kept with blocking buffer containing BSA (5 %) for 2 h to diminish non-specific binding sites. The membranes were then incubated with primary antibodies [in Tris-buffered saline and Tween-20 (0.05 %, TBST)], recognizing CPSI and β-actin (1:1000 dilution), IL-6, NF-κB and iNOS (1:500) in a quaking platform overnight at 4 °C. Then, the membranes were incubated with their secondary antibodies (anti-rat IgG conjugated to horseradish peroxidase) for 2 h. The membranes were washed twice with TBST for 20 min. The protein bands were visualized by an enhanced chemiluminescence method using kit (GenScript ECL kit, USA), scanned and analysed by Image J software (Bethesda, USA).
Statistical analysis
The results were presented as mean ± SD. One-way analysis of variance (ANOVA), followed by Duncan’s multiple range test (DMRT) was done (SPSS software version 13.0) and a p value of <05 was considered significant.
Results
Body Weight Changes
A significant decrease in body weight was observed in AC- treated rats when compared to the control (Table 1). Oral administration of quercetin to hyperammonemic rats showed almost equal body weight gain as that of the control. The quercetin (only) treated rats showed no considerable variation in the body weight when compared to the control rats.
Table 1.
Body weight changes in control and experimental rats
| Groups | Initial body weight (g) | Final body weight (g) |
|---|---|---|
| Control | 189.4 ± 13.34 | 258.55 ± 17.48a |
| AC (100 mg/kg) | 181.2 ± 12.86 | 225.10 ± 15.05b |
| AC + quercetin | 187.9 ± 12.71 | 240.12 ± 16.43c |
| Quercetin(50 mg/kg) | 182.5 ± 12.63 | 232.21 ± 15.92a |
Data are presented as mean weight (±SD) of rats in each group-control, ammonium chloride, AC + quercetin, quercetin alone. The values with different superscript (a, b, c) are significant from each others, p < 0.05 mean values are significantly different from the other groups (ANOVA followed by DMRT)
Histopathological Observations
The control rat liver showed normal central vein and normal hepatocytes (Fig. 1a). The hepatocytes of AC treated rats showed fibrosis, steatosis, fatty inflammation marked necrosis with fatty deposits (Fig. 1a). The AC rats treated with quercetin showed reduced steatosis and other pathological changes (Fig. 1a). The quercetin (only) treated tissues showed normal architecture (Fig. 1a). The section of brain tissue (control) illustrated normal glial nodules and gliosis (Fig. 1b). The brain tissues of AC induced rats’ exhibited necrosis and microcystic degeneration (Fig. 1b). The quercetin + AC treated rats showed less necrosis and mild microcystic degeneration (Fig. 1b). The quercetin (only) treated tissues exhibited normal brain histology with normal glial nodules and gliosis (Fig. 1b). The section of control kidney tissue showed normal kidney glomeruli surrounded by tubules (Fig. 1c). The proximal tubular necrosis was seen in hyperammonemic rats (Fig. 1c). The hyperammonemic rats treated with quercetin demonstrated normal glomeruli surrounded by tubules (Fig. 1c). The quercetin (only) treated rats showed no significant changes as compared to control (Fig. 1c).
Fig. 1.
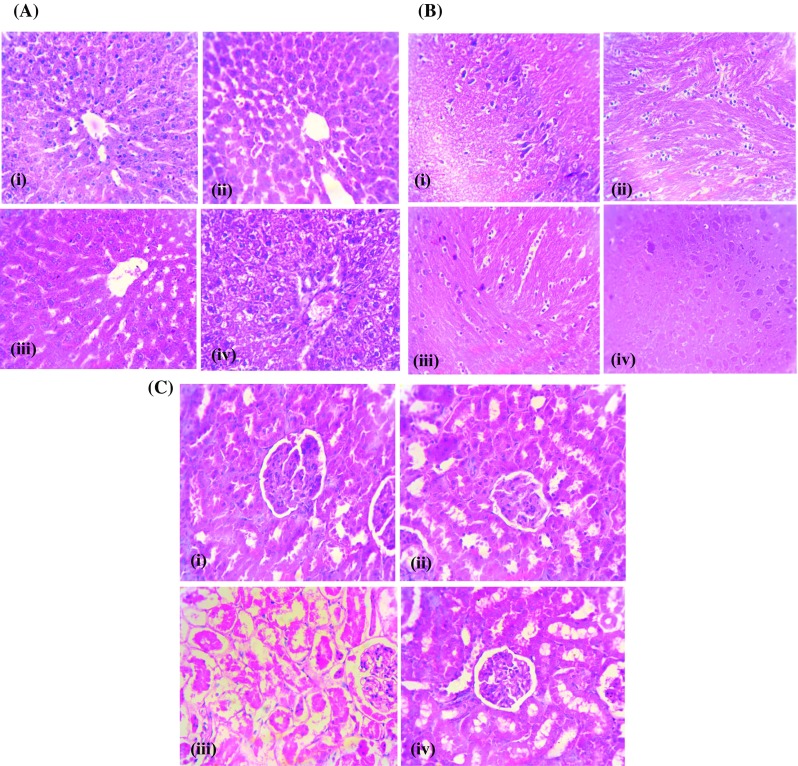
a Effect of quercetin on histopathologic changes in the liver of normal and experimental rats, H&E staining from normal rats. Section of control liver (i) showing normal architecture with hepatocytes radiating from the central vein and normal hepatocytes and no pathological changes, (ii) AC-treated rat liver showing fibrosis, steatosis, fatty inflammation marked and necrosis with fatty deposits, (iii) AC + quercetin-treated liver showing the amelioration of distorted architecture and ammonium chloride-induced steatosis & other pathological changes and (iv) quercetin treated liver with central vein and normal hepatocytes. Original magnification—×40. b Effect of quercetin on histopathologic changes in the brain of rats. (i) Control rat brain with typical appearance of the normal architecture, (ii) AC-treated rat brain showing necrosis and microcystic degeneration, (iii) AC + quercetin treated brain showing amelioration of necrosis and mild microcystic degeneration and (iv) quercetin treated rat brain with normal architecture (magnification—×40). c Effect of quercetin on histopathologic changes in the kidney (i) Control rat kidney shows no pathological changes, (ii) AC treated kidney with proximal tubular necrosis, (iii) AC + quercetin treated kidney showing amelioration of necrosis in glomeruli surrounded by tubules and (iv) quercetin treated rat kidney shows no pathological changes (magnification—×40)
Influence of Quercetin on AC Induced Biochemical Parameters
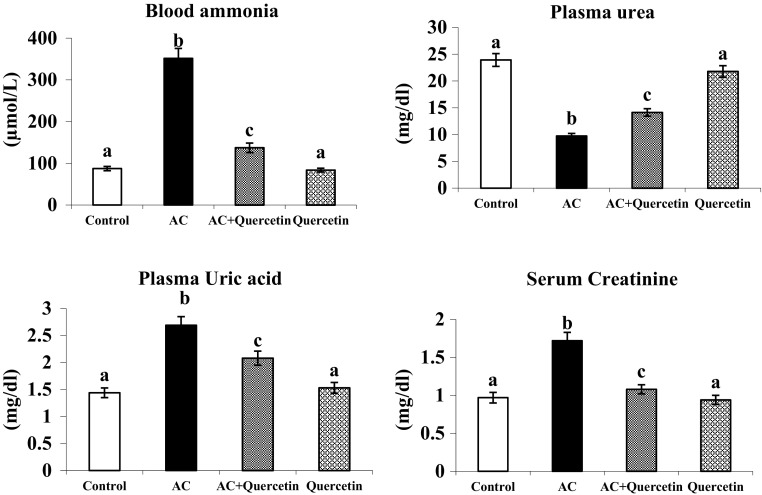
The amount of ammonia (in blood), uric acid (in plasma) and creatinine (in serum) was notably increased in AC treated rats (Fig. 2). But the level of plasma urea was found to be diminished in AC treated rats. Administration of quercetin significantly reversed these changes. Rats treated with quercetin alone exhibited insignificant difference in the level of ammonia, urea, uric acid and creatinine compared to control.
Fig. 2.
Effect of quercetin on blood ammonia and plasma urea, uric acid and serum creatinine of normal and experimental rats. Group I: normal control rats, group II: AC (100 mg/kg), group III: AC + quercetin, group IV: quercetin (50 mg/kg). Each value is mean ± SD for six rats in each group, columns not sharing a common superscript letter differs significantly with each other (p < 0.05, Duncan’s multiple range test)
Lipid Peroxidation Activity
There was a considerable increase in TBARS and HP in hyperammonemia (Fig. 3). Oral supplementation of quercetin to AC treated rats noticeably reduced the level of TBARS and HP (in plasma, liver and brain.) Insignificant alteration was noticed in control and quercetin only treated rats.
Fig. 3.
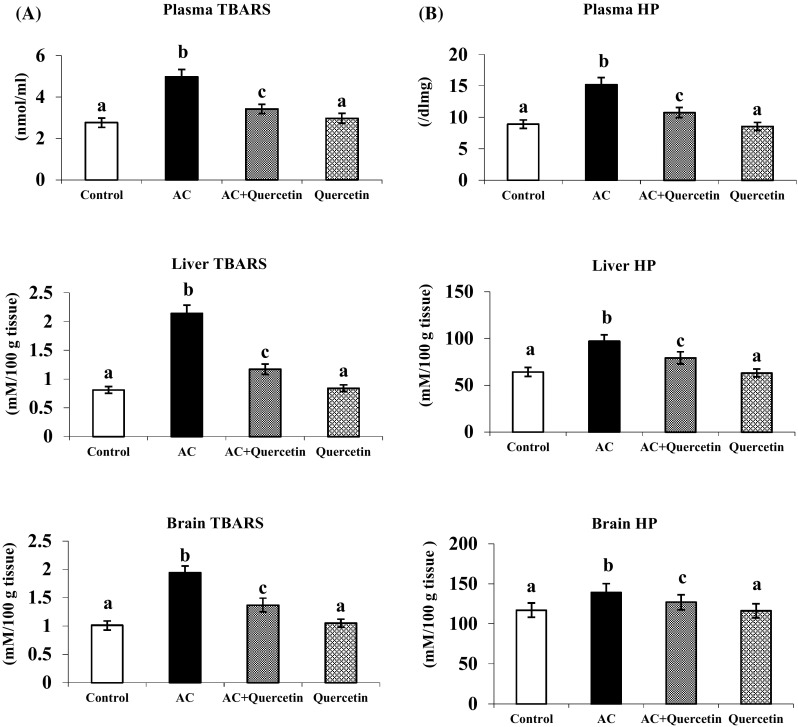
Effect of quercetin on the levels of TBARS and HP in plasma, liver and brain in normal and experimental rats. a Plasma TBARS. b HP in liver and brain. Each value is mean ± SD for six rats in each group, columns not sharing a common superscript letter differs significantly with each other (p < 0.05, Duncan’s multiple range test)
Effect of Quercetin on Antioxidants Levels
AC treated rats showed a marked reduction in the activities of the antioxidant enzymes (SOD, CAT and GPx) in plasma, liver and brain. Oral administration of quercetin to AC-treated rats caused considerable increase in the enzyme activities after AC induction. Rats treated with quercetin to hyperammonemic rats enhanced the level of GSH, vitamins E and C as compared to hyperammonemic rats. Quercetin (only) treated group showed no significant variations in the level of GSH and vitamins E and C as compared to control (Fig. 4).
Fig. 4.
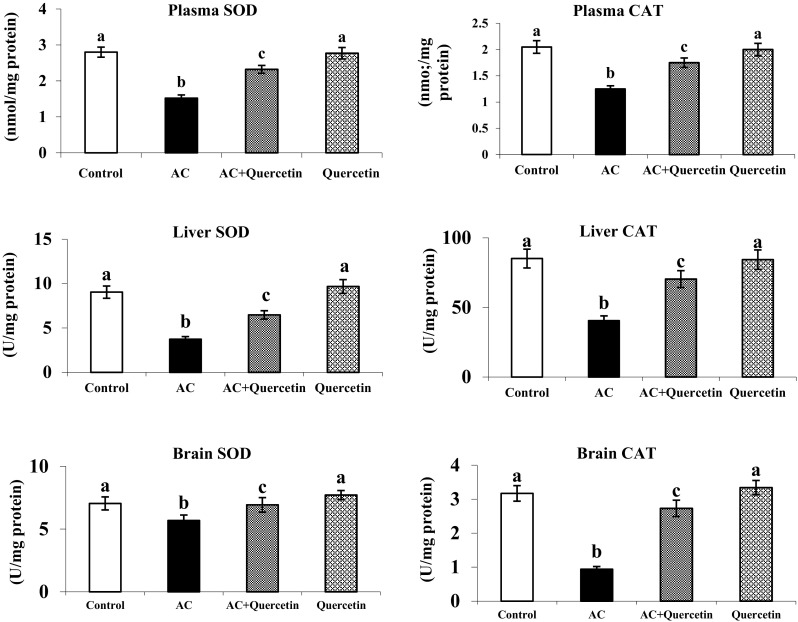
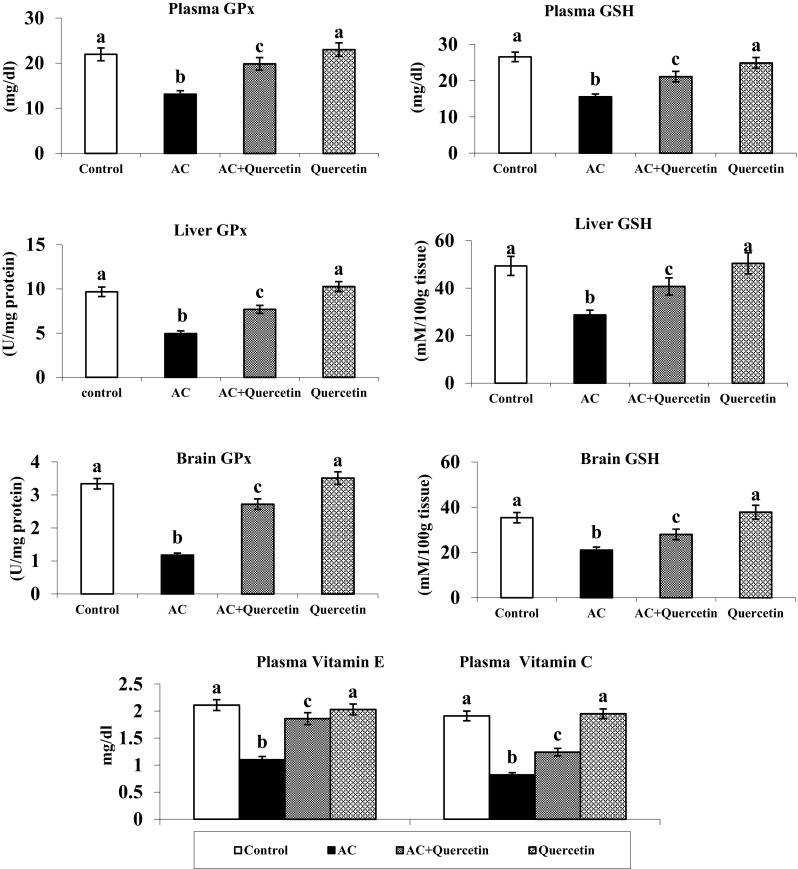
Changes in the activities of SOD, CAT and the levels of GPX in plasma, liver and brain of normal and experimental rats Effect of quercetin on the levels of GSH in plasma, liver and brain Figure legends and vitamins E and C in plasma (mean ± SD).Values not sharing a common superscript letter differ significantly (p < 0.05). UA—one unit of activity was taken as the enzyme reaction, which gave 50 % inhibition of NBT reduction in 1 min. UB—μmol of hydrogen peroxide consumed/minute. UC—μg of glutathione consumed/minute
Liver Marker Enzymes
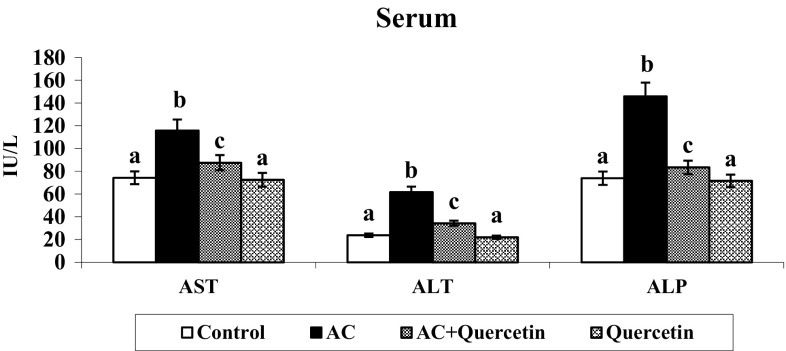
The actions of liver marker enzymes were enhanced in the serum of hyperammonemic rats (Fig. 5). Oral treatment of quercetin to hyperammonemic rats significantly restored the liver marker levels. No significant differences in liver markers were noticed in quercetin (only) treated rats.
Fig. 5.
Effect of quercetin on changes AST, ALT and ALP activities. Group I: normal control rats, group II: AC (100 mg/kg), group III: AC + quercetin, group IV: quercetin (50 mg/kg). Each value is mean ± SD for six rats in each group, columns not sharing a common superscript letter differ significantly with each other (p < 0.05, Duncan’s multiple range test)
Effect of Quercetin on Expression of Inflammatory Markers
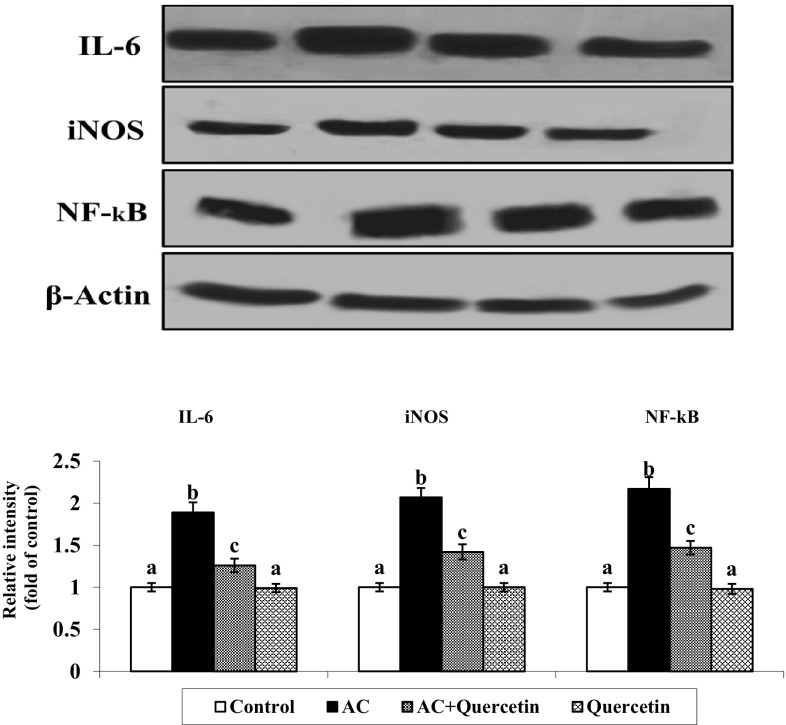
The representative immunoblot showed upregulation of IL-6, iNOS and NF-κB in AC treated rats compared with control. Uptake of quercetin to AC treated rats noticeably down regulated the expression of IL-6, iNOS and NF-κB. There are no significant variations between control and quercetin only treated groups (Fig. 6).
Fig. 6.
Expression level of IL-6, iNOS and NF-kB in AC induced rats. Expression levels of IL-6, iNOS and NF-kB were significantly increased in AC group rats as compared to the control group rats. Quercetin + AC treatment significantly decreased the expression level as compared to only AC treated group rats. Values are mean ± SD (n = 6)
Discussion
AC induced hyperammonemia was associated with elevations of ammonia, uric acid and creatinine and a decrement in the level of plasma urea. Impairment in liver functions like hepatic failure, cirrhosis, etc., could also lead to hyperammonaemia. Quercetin, a flavone glycoside, plentifully present in edible plants is known to possess numerous protective pharmacological activities. It is well documented that phytoantioxidants, like phenolic compounds have the capability to eliminate surplus ammonia, uric acid and serum creatinine and to tender protection in opposition to hyperammonemia [23].
Our results demonstrated that, in hyperammonemic rats the lipid content is reduced to approximately one half suggesting the alteration in lipid metabolism and in the levels of carnitine and its derivatives. The body weight decrement in hyperammonemic rats might be due to alteration in lipid metabolism and less weight gain owing to reduced food intake. Administration of quercetin to hyperammonemic rats restored the body weight was gain.
Elevated lipid peroxidation induced in hyperammonemic rats could be owing to ammonia stimulated free radical synthesis which could cause liver damage. It was documented that surplus ammonia intoxication causes unwarranted stimulation of NMDA receptors, which in turn might cause neuronal degeneration and death. After induction of these receptors, intracellular calcium level is elevated in the postsynaptic neuron. Calcium might bind to calmodulin and could simulate numerous enzymes such as nitric oxide synthase (NOS), leading to elevated synthesis of nitric oxide, which would be accountable for the reduced action of antioxidant enzymes. Nitric oxide could also inhibit catalase and glutathione peroxidase [24]. Further, nitric oxide is also able to inhibit the mitochondrial respiratory chain in astrocytes, causing augmented synthesis of free radicals. Furthermore, nitric oxide could oxidize glutathione, ensuing in reduction of GSH. Hence, we could contemplate that oxidative stress stimulated by ammonia in the brain is owing to elevated synthesis of nitric oxide via the stimulation of NMDA receptors [25]. Considering nitroarginine, an inhibitor of NOS, could prevent the increment in superoxide radical and decrement in antioxidant enzymes induced by ammonia, hyperammonemia could cause augmented nitric oxide (NO) synthesis by two dissimilar mechanisms, one interceding by establishment of NMDA receptors and another by self-regulating of NMDA receptors [26].
The antioxidant properties of quercetin have been investigated [27]. In the present study, ammonium chloride-treated rats demonstrated diminished actions of SOD and CAT in liver and brain. SOD could convert superoxide radicals into hydrogen peroxide, which is subsequently converted by catalase to oxygen and water. The decline in the levels of these antioxidants could be owing to injury of liver and brain tissues. Previous study reported that chronic treatment with quercetin was capable to elevate the reduced levels of SOD [27], which corroborates our present findings.
Glutathione S-transferase is involved in detoxification of electrophiles. Quercetin is capable to augment the level of GSH by elevating antioxidant profile [28]. Vitamins E and C are key antioxidants which have an efficient role in preserving the cellular architecture in opposition to oxidative injury during obstructing the sequence of effect of free radicals [28]. Liver cell destruction normally leads to the release of constituents out of cell into blood stream. AST, ALT and ALP (in serum) are the perceptive markers of liver diseases [29] and their assessment in serum is a reliable index to specify hepatocellular damage.
Hepatic encephalopathy is a major consequence of hyperammonaemia and is influenced by macrophage-derived cytokines, for instance, interleukin IL-6 [30]. Our results documented that quercetin might adjust the expression levels of IL-6 in favor of anti-inflammatory action and cytoprotection. Hyperammonaemia could be an important factor for abnormal expression of iNOS and NF-κB and elevated production of NO in astroglial cells. Astrocytic stimulation of iNOS and NF-κB may contribute to neuronal damage in hyperammonaemia [31]. Increased NO levels could reduce glutamine synthesis, accompanied by reduced GS activity in hyperammonaemia [30, 31]. Our results showed a significantly increased iNOS and NF-κB expression in AC treated rats suggesting a hyperammonaemia mediated neuroinflammatory response. After treatment with quercetin, hyperammonaemic rats showed a significantly decreased expression of iNOS which could be due to anti-oxidant/anti-inflammatory/neuroprotective effects of quercetin.
The histopathology, biochemical indices and expression of inflammatory markers investigated in the present study point out that quercetin could exhibit defense to AC-induced hyperammonemic rats against oxidative stress by its antioxidants, anti-inflammatory and hepatoprotective effects.
Acknowledgments
This research work was supported by the Indian Council of Medical Research ICMR45/3/2013-Bio/BMS dated 25.11.2013, New Delhi, India, in the form of Senior Research Fellowship to S. Kanimozhi is gratefully acknowledged.
Compliance with Ethical Standards
Conflict of interest
The authors declare that there is no conflict of interest.
References
- 1.Jayakumar AR, Sujatha R, Paul V. Effect of ammonia on motor function in adult rats. Brain Res Bull. 1997;43:275–278. doi: 10.1016/S0361-9230(96)00432-7. [DOI] [PubMed] [Google Scholar]
- 2.Monfort P, Felipo V. Long-term potentiation in hippocampus involves sequential activation of soluble guanylate cyclase, cGMP-dependent protein kinase and cGMP-degrading phosphodiesterase, alterations in hyperammonemia. BMC Pharmacol. 2005;5:P66. doi: 10.1186/1471-2210-5-S1-P66. [DOI] [PMC free article] [PubMed] [Google Scholar]
- 3.Majeed KI. Hyperammonemia is associated with an increase in inhibitory neurotransmission as a consequence of two factors. E Med J. 2005;2:2–15. [Google Scholar]
- 4.Wang C, Zhang SH, Wang PF, Li W, Lu J. Effects of ammonium on the antioxidative response in Hydrilla verticillata Royle plants. Ecotoxicol Environ Saf. 2010;73:189–195. doi: 10.1016/j.ecoenv.2009.08.012. [DOI] [PubMed] [Google Scholar]
- 5.Mittler R. Oxidative stress, antioxidants and stress tolerance. Trends Plant Sci. 2002;7:405–410. doi: 10.1016/S1360-1385(02)02312-9. [DOI] [PubMed] [Google Scholar]
- 6.Echeverry C, Arredondo F, Abin-Carriquiry JA, Midiwo JO, Ochieng C, Kerubo L. Pretreatment with natural flavones and neuronal cell survival after oxidative stress: a structure-activity relationship study. J Agric Food Chem. 2010;58:2111–2115. doi: 10.1021/jf902951v. [DOI] [PubMed] [Google Scholar]
- 7.Dok-Go H, Lee KH, Kim HJ, Lee EH, Lee J, Song YS, et al. Neuroprotective effects of antioxidative flavonoids, quercetin, (1)—dihydroquercetin and quercetin 3-methyl ether, isolated from Opuntiaficus-indicavar. saboten. Brain Res. 2003;965:130–131. doi: 10.1016/S0006-8993(02)04150-1. [DOI] [PubMed] [Google Scholar]
- 8.Subramanian P, Jayakumar M, Jayapalan JJ, Hashim OH. Chronotherapeutic effect of fisetin on expression of urea cycle enzymes and inflammatory markers in hyperammonaemic rats. Pharmacol Rep. 2014;66:1037–1042. doi: 10.1016/j.pharep.2014.06.018. [DOI] [PubMed] [Google Scholar]
- 9.Ishisaka A, Ichikawa S, Sakakibara H, Piskula MK, Nakamura T, Kato Y, et al. Accumulation of orally administered quercetin in brain tissue and its antioxidative effects in rats. Free Radic Biol Med. 2011;51:1329–1336. doi: 10.1016/j.freeradbiomed.2011.06.017. [DOI] [PubMed] [Google Scholar]
- 10.Wolheim DF. Preanalytical increase of ammonia in blood specimens from healthy subjects. Clin Chem. 1984;30:906–908. [PubMed] [Google Scholar]
- 11.Varley H, Gowenlock AH, Bell M. Practical clinical biochemistry. 4. New Delhi: CBS Publishers; 1984. [Google Scholar]
- 12.Yagi K. Lipid peroxides and human disease. Chem Phys Lipids. 1987;45:337–351. doi: 10.1016/0009-3084(87)90071-5. [DOI] [PubMed] [Google Scholar]
- 13.Fraga CG, Leibovitz BF, Toppel AL. Lipid peroxidation measured as TBARS in tissue slices. Characterization and comparison with homogenate and microsomes. Free Radic Biol Med. 1988;4:155–161. doi: 10.1016/0891-5849(88)90023-8. [DOI] [PubMed] [Google Scholar]
- 14.Jiang ZY, Hunt JV, Wolff SP. Ferrous ion oxidation in the presence of xylenol orange for detection of lipid hydroperoxides in low-density lipoprotein. Anal Biochem. 1992;202:384–389. doi: 10.1016/0003-2697(92)90122-N. [DOI] [PubMed] [Google Scholar]
- 15.Kakkar P, Das B, Viswanathan PN. A modified spectrophotometric assay of SOD. Indian J Biochem Biophys. 1984;21:130–132. [PubMed] [Google Scholar]
- 16.Sinha KA. Colorimetric assay of catalase. Anal Biochem. 1972;47:389–394. doi: 10.1016/0003-2697(72)90132-7. [DOI] [PubMed] [Google Scholar]
- 17.Ellman GC. Tissue sulfhydyl groups. Arch Biochem Biophys. 1959;82:70–77. doi: 10.1016/0003-9861(59)90090-6. [DOI] [PubMed] [Google Scholar]
- 18.Rotruck JT, Pope AL, Ganther HE, Swason AB. Selenium: biochemical role as a component of glutathione peroxidase. Science. 1973;179:588–590. doi: 10.1126/science.179.4073.588. [DOI] [PubMed] [Google Scholar]
- 19.Dimitrov NV, Meyer C, Gilliland D, Ruppenthal M, Chenoweth W, Malone W. Plasma tocopherol concentrations in response to supplemental vitamin E. Am J Clin Nutr. 1991;53:723–729. doi: 10.1093/ajcn/53.3.723. [DOI] [PubMed] [Google Scholar]
- 20.Roe JH, Kuether CA. Detection of ascorbic acid in whole blood and urine through the 2,4-dinitrophyenyl hydrazine of dehydroascorbic acid. J Biol Chem. 1943;147:399–407. [Google Scholar]
- 21.Schumann G, Klauke R. New IFCC reference procedures for the determination of catalytic activity concentrations of five enzymes in serum: preliminary upper reference limits obtained in hospitalized subjects. Clin Chim Acta. 2003;327:69–79. doi: 10.1016/S0009-8981(02)00341-8. [DOI] [PubMed] [Google Scholar]
- 22.Lowry OH, Rosebrough NJ, Farr AL, Randall RJ. Protein measurement with Folin Phenol reagent. J Biol Chem. 1951;193:265–275. [PubMed] [Google Scholar]
- 23.Jayakumar M, Subramanian P. Antihyperammonemic effect of fisetin on hyperammonemic rats: a biochemical study. Int J Mod Res Rev. 2013;2:33–39. [Google Scholar]
- 24.Asahi M, Fujii J, Suzuki K, Seo HG, Kuzuya T, Hori M, et al. Inactivation of glutathione peroxidase by nitric oxide. Implication for cytotoxicity. J Biol Chem. 1995;270:21035–21039. doi: 10.1074/jbc.270.36.21035. [DOI] [PubMed] [Google Scholar]
- 25.Kosenko E, Kaminsky Y, Lopata O, Muravyov N, Kaminsky A, Hermenegildo C, et al. Nitroarginine, an inhibitor of nitric oxide synthase, prevents changes in superoxide radical and antioxidant enzymes induced by ammonia intoxication. Metab Brain Dis. 1998;13:29–41. doi: 10.1023/A:1020626928259. [DOI] [PubMed] [Google Scholar]
- 26.Kosenko E, Kaminsky Y, Grau E, Minana MD, Marcaida G, Grisolia S, et al. Brain ATP depletion induced by acute ammonia intoxication in rats is mediated by activation of the NMDA receptor and Na 1, K1-ATPase. J Neurochem. 1994;63:2172–2178. doi: 10.1046/j.1471-4159.1994.63062172.x. [DOI] [PubMed] [Google Scholar]
- 27.Annapurna A, Ansari MA, Manjunath PM. Partial role of multiple pathways in infarct size limiting effect of quercetin and rutin against cerebral ischemia-reperfusion injury in rats. Eur Rev Med Pharmacol Sci. 2013;17:491–500. [PubMed] [Google Scholar]
- 28.Scholz RW, Reddy PV, Wynn MK, Graham KS, Liken AD, Gumpricht E, et al. Glutathione dependent factors and inhibition of rat liver microsomal lipid peroxidation. Free Radic Biol Med. 1997;23:815–828. doi: 10.1016/S0891-5849(97)00067-1. [DOI] [PubMed] [Google Scholar]
- 29.Rajesh MG, Latha MS. Preliminary evaluation of antihepatotoxic activity of Kamilari, a poly herbal formulation. J Ethnopharmacol. 2004;91:99–104. doi: 10.1016/j.jep.2003.12.011. [DOI] [PubMed] [Google Scholar]
- 30.Braissant O, McLin VA, Cudalbu C. Ammonia toxicity to the brain. J Inherit Metab Dis. 2013;36:595–612. doi: 10.1007/s10545-012-9546-2. [DOI] [PubMed] [Google Scholar]
- 31.Rao KV, Jayakumar AR, Tong X, Alvarez VM, Norenberg MD. Marked potentiation of cell swelling by cytokines in ammonia-sensitized cultured astrocytes. J Neuroinflam. 2010;7:66. doi: 10.1186/1742-2094-7-66. [DOI] [PMC free article] [PubMed] [Google Scholar]


