

INTRODUCTORY PARAGRAPH
Chromosome missegregation into a micronucleus can cause complex and localized genomic rearrangements1,2 known as chromothripsis3, but the underlying mechanisms have not been established. Here we developed an inducible Y centromere-selective inactivation strategy by exploiting a CENP-A/histone H3 chimera to directly examine the fate of missegregated chromosomes in otherwise diploid human cells. Using this approach, we identified a temporal cascade of events that are initiated upon centromere inactivation involving chromosome missegregation, fragmentation, and re-ligation that span three consecutive cell cycles. Following centromere inactivation, a micronucleus harboring the Y chromosome is formed in the first cell cycle. Chromosome shattering, producing up to 53 dispersed fragments from a single chromosome, is triggered by premature micronuclear condensation prior to or during mitotic entry of the second cycle. Lastly, canonical non-homologous end joining (NHEJ), but not homology-dependent repair, is shown to facilitate re-ligation of chromosomal fragments in the third cycle. Thus, initial errors in cell division can provoke further genomic instability through fragmentation of micronuclear DNAs coupled to NHEJ-mediated reassembly in the subsequent interphase.
Chromosome segregation errors during mitosis are a well-recognized cause of numerical aneuploidy and have been implicated in the formation of chromosomal translocations4, both hallmark features of cancer genomes. Whether – and if so, how – such mitotic errors also contribute to the development of complex structural rearrangements remains poorly understood. Chromothripsis can be detected in a broad spectrum of human cancers3,5 and is predicted to occur during a single, catastrophic event that contemporaneously generates multiple genomic rearrangements onto one or a few chromosome(s)3. While features of chromothripsis have been recapitulated from experimental systems involving dicentric bridge formation6 or exogenous DNA damage induction7, sequencing evidence from plant models1 and human cells2, and genetics in yeast8, has suggested that complex and localized rearrangements can be triggered by chromosome missegregation into aberrant compartments called micronuclei. The exact cellular mechanism(s) for how missegregated chromosomes become chromothriptic remains unknown, although an attractive hypothesis3,9,10 involves chromosome pulverization in micronuclei – an observation initially made half a century ago11 – followed by incorrect reassembly of fragments through DNA repair.
Attempts to directly address these underlying mechanisms have been lacking due to experimental limitations of conventional cell-based methods for producing micronuclei by chemically-induced prolonged mitotic arrest to generate random chromosome segregation errors. This approach precludes discriminating the micronucleated chromosome from normal, nuclear chromosomes in mitosis and prevents monitoring the fate of the initially missegregated chromosome for more than one cell generation. Moreover, mitotic arrest can itself produce unwanted DNA damage and/or activate an apoptotic degradation event12–15. We sought to bypass these limitations by inducing the missegregation of a specific chromosome-of-interest into micronuclei that can be examined over successive cell cycles without mitotic perturbation. To do so, we exploited a unique feature of the human Y chromosome centromere that permitted conditional, centromere-selective control for assembly of the kinetochore – the spindle microtubule-attachment complex that is required for chromosome segregation.
Kinetochores are assembled on the outer surface of centromeric chromatin through nucleation by CENtromere Protein C (CENP-C)16, which is recruited and stably attached at centromeres through its direct binding to the centromeric histone H3 variant CENP-A17 and the DNA sequence-specific binding protein CENP-B18. The amino- and carboxy-terminal tails of CENP-A mediate centromeric recruitment of CENP-C (Fig. 1a) through redundant CENP-B-dependent and -independent mechanisms, respectively18–21. Since either of these CENP-A tails is sufficient for nucleating kinetochore assembly and subsequent chromosome segregation, we previously proposed that the CENP-B-dependent pathway operates as a “back-up” mechanism to reinforce centromere function18. CENP-B specifically binds to repetitive 17 bp motif sequences, termed CENP-B boxes, interspersed throughout the alphoid repeats found in all human centromeres with the single exception of the Y chromosome centromere22,23. Recognizing this distinct feature, we reasoned that complete replacement of CENP-A at all centromeres with a chimeric CENP-A variant in which the CENP-C-recruiting, carboxy-terminal tail (spanning six amino acids) is substituted with the corresponding region of histone H3 (hereafter referred to as CENP-AC-H3, Supplementary Fig. 1a)19 would selectively inactivate the Y centromere while leaving its position epigenetically marked by chromatin incorporating CENP-AC-H3 (Fig. 1a).
Figure 1. An inducible CENP-A replacement strategy enables functional and selective inactivation of the Y chromosome centromere in human cells.
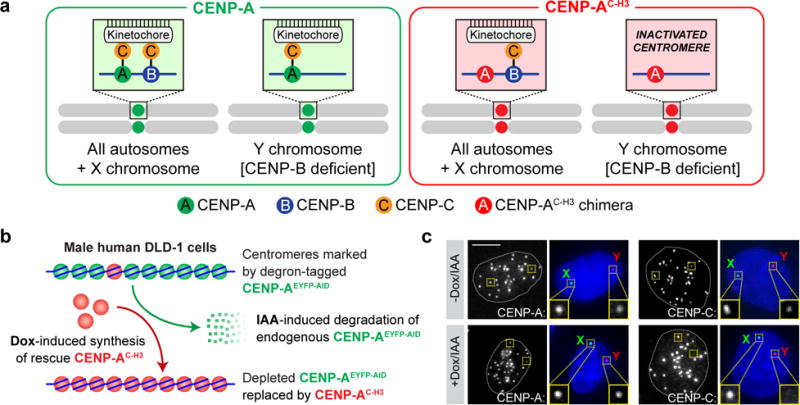
(a) Schematic depicting the strategy used to functionally inactivate the CENP-B-deficient Y centromere with a CENP-A chimera containing the carboxy-terminal tail of histone H3 (CENP-AC-H3) that cannot directly recruit CENP-C. All other chromosomes assemble kinetochores through the CENP-B-dependent pathway. (b) Schematic depicting the approach for inducible replacement of endogenous CENP-A (green circles) at all centromeres with CENP-AC-H3 (red circles). Doxycycline (dox) induces transcriptional synthesis of the rescue CENP-AC-H3 chimera and auxin (IAA) triggers rapid degradation of the endogenous, auxin-inducible degron (AID)-tagged CENP-A protein. (c) Immuno-FISH images of DLD-1 cells rescued with CENP-AC-H3 following 24h dox/IAA treatment. DNA FISH was used to spatially identify the locations of the X (green) and Y (red) centromeres in DAPI-stained interphase nuclei combined with immunofluorescence for detection of CENP-A or CENP-C. Images are representative of 2 independent experiments. Scale bar, 5 μm.
To engineer a cell-based system for Y centromere inactivation, we employed a replacement strategy for removal of endogenous CENP-A by induced proteolysis and simultaneous transcriptional induction of CENP-AC-H3 (Fig. 1b and detailed in Supplementary Fig. 1b). The male human DLD-1 cell line was chosen as it was known to maintain a diploid karyotype with a low basal rate of spontaneous micronucleus formation (<3% of cells) and to be both mismatch repair- and p53-deficient, thereby enabling chromosome missegregation and/or DNA damage without eliciting a p53-dependent cell cycle arrest24,25. We first stably integrated a gene encoding TIR1, the plant E3 ubiquitin ligase mediating auxin-dependent target protein destruction26,27. This was followed by TAL effector nuclease-mediated gene editing to disrupt one endogenous CENPA allele and to amino-terminally tag the CENP-A encoded by the second allele with an enhanced yellow fluorescent protein fused to an auxin-inducible degron (CENP-A–/EYFP-AID), the latter of which permits rapid and complete degradation26,27 of AID-tagged CENP-A within ~90 minutes after addition of the plant hormone auxin (indole-3-acetic acid, IAA) (Supplementary Fig. 1c). Finally, we stably integrated a single copy, doxycycline (dox)-inducible gene encoding the CENP-AC-H3 chimera (or CENP-AWT [wild-type] as a control) whose basal level of transcription produced CENP-AC-H3 at ~10% of normal CENP-A levels (Supplementary Fig. 1d–f).
Induced destruction of CENP-AEYFP-AID simultaneous with induced transcription of CENP-AC-H3 upon dox/IAA addition led to rapid loss of endogenous CENP-A and its replacement with CENP-AC-H3 within one cell cycle28 at every centromere without loss of centromere identity (as indicated by co-localization with anti-centromere antibodies [ACA] – Supplementary Fig. 1e). Whereas CENP-AEYFP-AID depletion alone resulted in complete lethality, its replacement with CENP-AC-H3 rescued broad centromere function and cell viability without affecting clonogenic growth (Supplementary Fig. 1g), proliferation rate (~25–27 hours per doubling – Supplementary Fig. 1h–i) or cell cycle distribution (Supplementary Fig. 1j) – all of which were comparable to untreated parental cells or those rescued by CENP-AWT. CENP-AC-H3-rescued cells had normal mitotic duration (41±11 min, n=50 H2B-mRFP-labeled mitoses filmed) and were also capable of sustaining mitotic arrest when challenged with the microtubule inhibitor nocodazole (Supplementary Fig. 1j).
As expected, after induced degradation of CENP-AEYFP-AID and its replacement with CENP-AC-H3, the essential kinetochore-nucleating protein CENP-C was selectively lost from the Y centromere (Fig. 1c) despite continued marking of Y centromere position by CENP-AC-H3. Correspondingly, the Y chromosome underwent rapid population-wide loss from primary nuclei at a rate of ~30% per cell division (as measured by a Y centromere-bound fluorescent in situ hybridization [FISH] probe, Fig. 2a). Almost a quarter (23±1%) of CENP-AC-H3-rescued cells contained micronuclei within 48 hours of CENP-A replacement (Fig. 2b), whereas elevated micronucleation was not observed in control cells or those rescued with CENP-AWT (Supplementary Fig. 2a). By the second day after CENP-AC-H3 replacement, more than half of mitoses (57±5%) developed chromosome segregation errors, the large majority (87±5%) of which were accompanied by defects in initial chromosome alignment (Fig. 2c).
Figure 2. Y centromere inactivation triggers Y chromosome missegregation and accumulation into micronuclei.
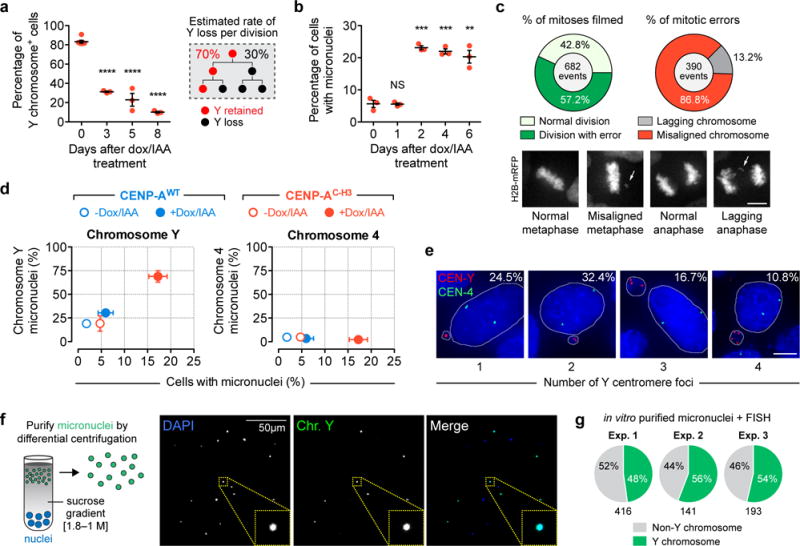
(a) Percentage of Y chromosome-positive signals in the primary nucleus measured by centromere FISH. Lines represent the mean ± SEM of n = 6 (0d, 1,758 cells) and n = 3 independent experiments (3–8d, 672–1,605 cells per condition). The right schematic depicts how Y loss is perpetuated over repeated doublings within a population. (b) Percentage of micronucleated cells measured by DAPI staining. Lines represent the mean ± SEM of n = 3 independent experiments (2,045–3,153 cells per condition). Asterisks from a–b indicate significance by two-tailed Student’s t-test compared to untreated control cells. ****P<0.0001, ***P<0.001, **P<0.01, NS = not significant. (c) 2d CENP-AC-H3-rescued cells stably encoding histone H2B-mRFP were filmed by time-lapse microscopy for chromosome segregation errors. Data represent the mean of n = 3 independent experiments. Scale bar, 5 μm. (d) Cells rescued with CENP-AWT or CENP-AC-H3 for 5d were analyzed by DAPI-staining to quantify the percentage of micronucleated cells (x-axis) and cross-plotted against the percentage of micronuclei containing either chromosome Y or 4 (y-axis) as measured by centromere FISH. Data represent the mean ± SEM of n = 3 independent experiments per axis, and statistical analyses and sample sizes for each axis are provided in Supplementary Fig. 2a–b. (e) Representative images of 5d CENP-AC-H3-rescued cells probed by centromere FISH for chromosomes Y (red) and 4 (green). The percentage represents the distribution of micronuclei harboring ≥1 Y centromere foci (102 micronuclei pooled from 3 independent experiments). Counterstain with DAPI shown in blue. Scale bar, 5 μm. (f) Representative image of DAPI-stained micronuclei purified from 4d CENP-AC-H3-rescued cells hybridized to Y chromosome painting probes (green) by FISH. (g) Pie charts depicting the proportion of purified micronuclei with Y chromosome-positive FISH signals. Numbers below charts indicate the number of micronuclei analyzed per experiment. Source data for a, b, c, and g are provided in Supplementary Table 1.
FISH probes targeting the Y centromere and the centromere of a control autosome (chromosome 4) were used to establish that most micronuclei (527/754 micronuclei examined, or 70±10%, P=0.008) contained the Y chromosome (Fig. 2d, Supplementary Fig. 2b), while micronucleated chromosome 4 was rarely observed (<3%). A ~35-fold enrichment in CENP-AC-H3 cells with Y-containing micronuclei (Supplementary Fig. 2c) was measured compared to untreated CENP-AWT-rescued cells, with a proportion (~49%) of micronuclei containing two or three Y centromere signals per micronucleus (Fig. 2e, Supplementary Fig. 2d). These micronuclei were often larger in size (R2=0.70, Supplementary Fig. 2e), likely indicating replication of an initial micronuclear chromosome29 and/or the entrapment of multiple Y chromosomes into the same micronucleus – perhaps through nondisjunction of sister chromatids. To further confirm selective enrichment of the Y chromosome, micronuclei were purified using differential centrifugation30 and analyzed by FISH with a Y chromosome painting probe (Fig. 2f). FISH analysis revealed that 52±4% of purified micronuclei contained Y-specific sequences (Fig. 2g) without detectable contamination of primary nuclei, and the remainder were suspected to entrap a distribution of randomly missegregated chromosomes. We conclude that selective inactivation of the Y centromere efficiently produces micronuclei that are specifically enriched for the human Y chromosome without compromising other major cellular characteristics (summarized in Supplementary Fig. 2f).
Because nuclear envelope disruption is a common fate for micronuclei31, a fluorescent protein fused to a nuclear localization signal (2×RFP-NLS) was used to measure compartmentalization between induced Y chromosome micronuclei and those spontaneously generated from a low basal rate of segregation errors entrapping mostly non-Y chromosomes. Both sources of micronuclei underwent disruption at comparable frequency (~26%, Supplementary Fig. 3a), indicative of similar nuclear membrane integrity in the Y and non-Y micronuclei. Moreover, using immunofluorescence for γH2AX as a marker for double-strand breaks, a spectrum of micronucleus-specific DNA damage was identified in ~30% of micronuclei that ranged from a single focus to extensive damage (Supplementary Fig. 3b–c).
To directly test if and when micronucleated chromosomes underwent fragmentation, a dual-colored FISH assay was performed on mitotic spreads using DNA probes spanning the entire Y chromosome (green) and the Y centromere (red). Y chromosome fragmentation was defined by a spread containing multiple, scattered DNAs (visualized by DAPI) which hybridized to Y chromosome painting probes and ≥1 centromere signal(s) that also bound the painting probe. Although micronuclei were present two days after CENP-A replacement (Fig. 2b), Y chromosomes remained largely intact in mitosis (Fig. 3a). One day later (day three), abundant fragmentation (24±3% of Y chromosome-positive spreads, P=0.0003) appeared (Fig. 3a–b, Supplementary Fig. 4a–b), indicating that shattering requires at least one complete cell cycle following initial micronucleus formation.
Figure 3. Chromosomes in micronuclei are susceptible to extensive and catastrophic shattering in mitosis.
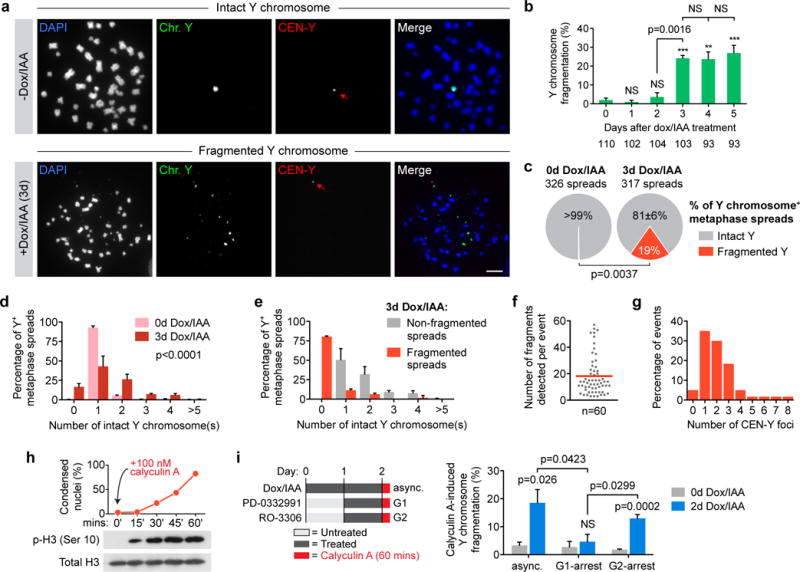
(a) Representative FISH images of metaphase spreads prepared from 0d or 3d CENP-AC-H3-rescued cells co-hybridized to Y chromosome paint probes (green) and Y centromere probes (red). Lower example shown contains ~18 detectable Y fragments and one centromere signal (red arrow). Scale bar, 10 μm. (b) Quantification of fragmentation frequency over the indicated time intervals. Data represent the mean ± SEM of n = 3 independent experiments, and the total number of metaphase spreads analysed across the 3 experiments are indicated below the bars. (c) Metaphase spreads collected from 0d or 3d CENP-AC-H3-rescued cells were analyzed for Y fragmentation as in a–b and represent the mean of n = 3 independent experiments. Data from d–g are compiled from spreads collected in c. (d) Distribution of intact Y chromosome copy number by FISH analysis. Data represent the mean ± SEM of n = 3 independent experiments (317–326 spreads pooled from 3 experiments) and P-value indicates significance by two-way ANOVA. (e) Distribution of intact Y chromosome copy number derived from fragmentation-negative or -positive metaphase spreads following 3d CENP-AC-H3 rescue and FISH analysis. Data represent the mean ± SEM of n = 3 independent experiments (255 non-fragmented spreads and 62 fragmented spreads total). (f) The number of detectable Y fragments produced per fragmentation event was quantified and the red line indicates the mean of 60 events. (g) Distribution of the number of Y centromere signals produced per fragmentation event (60 events scored). (h) Addition of calyculin A to asynchronous cells induces rapid chromosome condensation (top) and histone H3 phosphorylation (bottom). DAPI-stained DLD-1 cells were examined for condensation and metaphase-like appearance from >135 nuclei per time point. (i) Calyculin A was used to induce premature chromosome condensation (as indicated on the left) followed by spread preparation and processing for FISH as in (a). Data represent the mean ± SEM of n = 4 independent experiments (162–276 spreads per condition). Asterisks and p-values for b–c and i indicate significance by two-tailed Student’s t-test compared to untreated control cells or as denoted. ***P<0.001, **P<0.01, NS = not significant. Source data for b, c, d, e, h, and i are provided in Supplementary Table 1.
Following three-day centromere inactivation, copy number analysis from >300 metaphases with a detectable Y chromosome (Fig. 3c) revealed frequent Y chromosome aneuploidy (Fig. 3d), although additional copies of intact Y chromosome(s) rarely accompanied spreads with Y fragmentation (Fig. 3e). Sixty shattering events were examined in detail; each generating between 3–57 chromosomal FISH fragments large enough to be detected microscopically with an average of 18 fragments per event (Fig. 3f). Approximately 35% of fragmented metaphases contained a single centromere focus (with up to 53 Y chromosome fragments), whereas others harbored ≥2 foci (Fig. 3g), indicative of either a break within the centromeric region and/or co-fragmentation of multiple Y chromosomes. There was a weak correlation (R2=0.22) between the number of fragments generated and the number of centromere signals present (Supplementary Fig. 4c), consistent with the majority of events produced from one Y chromosome. Additionally, mitoses with overt fragmentation of a non-Y chromosome were rare (4/643 spreads examined).
Micronuclei are prone to nuclear envelope disruption during interphase that terminates normal nuclear function31 – a defect which can provoke delayed or stalled replication in S-phase9,11 and/or the acquisition of DNA damage9,31,32 throughout interphase – suggesting that one mechanism for chromosome fragmentation33 is the sudden compaction upon mitotic entry of incompletely replicated or unrepaired micronuclear DNAs. To test this, the PP1/PP2A phosphatase inhibitor calyculin A was added to interphase cells containing micronuclei prior to shattering (2d dox/IAA treatment – Fig. 2b, Fig. 3b) to drive abrupt, premature chromosome condensation accompanied by serine 10 phosphorylation of histone H3 (Fig. 3h, Supplementary Fig. 4d). Calyculin A alone was insufficient to fragment the Y chromosome in non-micronucleated control cells regardless of cell cycle position (Fig. 3i). In contrast, addition of calyculin A to micronucleated cells in interphase produced fragmented Y chromosomes prematurely (Fig. 3i), consistent with mitotic entry as the trigger for shattering or detection of shattering that had occurred during interphase. Use of cell synchronization (Supplementary Fig. 4e) revealed that calyculin A promoted fragmentation of the Y chromosome in cells in G2, but not in G1 (Fig. 3i). Thus, condensation-induced fragmentation was dependent on passage into or through S-phase, consistent with the hypothesis that disruption during interphase “primes” the micronuclear chromosome(s) for shattering in mitosis2,11,31. An alternative shattering mechanism could be cytoplasmic accumulation of active cyclin B1−Cdk134 complexes in late G2 that may prematurely shuttle into disrupted micronuclei to initiate micronuclear chromosome condensation and fragmentation in interphase prior to mitotic entry.
Despite continued cell proliferation (Supplementary Fig. 1h), the frequency of Y chromosome fragmentation remained constant between days 3–5 after centromere inactivation (Fig. 3b), suggesting possible cycles of shattering coupled with reassembly of fragments into intact chromosomes. To test this hypothesis and to identify the potential repair pathway(s), we assessed whether Y chromosome fragments from the first mitotic cycle (day 3) would persist into the second mitosis (day 4) (Fig. 4a) following inhibition of each of the three mammalian DNA double-strand break repair mechanisms35: canonical non-homologous end joining (NHEJ), homologous recombination (HR), and microhomology-mediated end joining (MMEJ). Two essential components from each distinct pathway were individually suppressed using small interfering RNAs (siRNAs) (Fig. 4b–c). Inhibition of NHEJ by reductions in DNA Ligase IV (LIG4) or DNA-PKcs resulted in a two-fold increase in Y fragmentation frequency in the second mitotic cycle (Fig. 4d–e), but neither interfered with cell proliferation (Fig. 4f) nor affected fragmentation in the first mitotic cycle with or without centromere inactivation (Fig. 4g). Pharmacological inhibition of LIG4 or DNA-PKcs similarly prevented reassembly of chromosomal fragments (Fig. 4h).
Figure 4. Shattered chromosomal fragments are re-ligated by canonical non-homologous end joining.
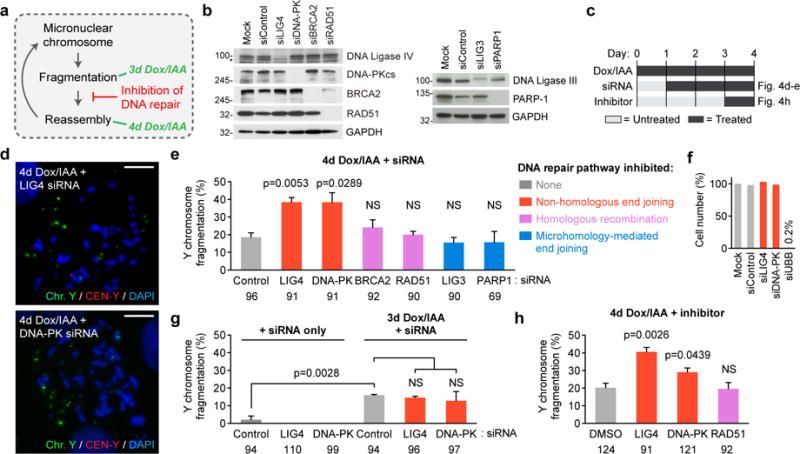
(a) Schematic depicting hypothesis of turnover between fragmentation and reassembly. (b) Depletion of target protein as confirmed by immunoblotting 3d post-siRNA transfection in DLD-1 cells. Asterisk indicates a non-specific band from the anti-LIG4 antibody. Blots are representative of 2 independent experiments, and unprocessed scans are shown in Supplementary Fig. 6. (c) Experimental schematic used for the indicated panels. Detailed timeline for each experiment is provided in Supplementary Fig. 4f. (d) Representative metaphase FISH images of Y chromosome fragmentation events derived from 4d CENP-AC-H3-rescued cells 3d post-transfection with the indicated siRNAs. Scale bar, 10 μm. (e) Quantification of d. Data represent the mean ± SEM of n = 3 independent experiments, and the number of total metaphase spreads analysed are shown below the graph. (f) DLD-1 cell numbers were counted 3d post-transfection with the indicated siRNAs and normalized to mock-transfected cells. Data represent the mean of biological triplicates. (g) Quantification of metaphase spreads with Y chromosome fragmentation with or without 3d CENP-AC-H3 rescue following 3d siRNA transfection. Data represent the mean ± SEM of n = 3 independent experiments, and the number of total metaphase spreads analyzed are indicated. (h) Quantification of Y chromosome fragmentation from 4d CENP-AC-H3-rescued cells treated with chemical DNA repair inhibitors as indicated in (c). Data represent the mean ± SEM of n = 3 independent experiments (LIG4, RAD51) or n = 4 independent experiments (DMSO, DNA-PK), and the number of total metaphase spreads analyzed are indicated. Significance for e and g–h are determined by two-tailed Student’s t-test compared to control siRNAs or DMSO conditions or as denoted. NS = not significant. Source data for e, f, and h are provided in Supplementary Table 1.
In contrast to NHEJ, inhibition of HR or MMEJ by depletion of BRCA2/RAD51 or LIG3/PARP-1, respectively, or treatment with a RAD51 inhibitor, had no effect on fragment reassembly (Fig. 4e and 4h). Given that suppression of NHEJ alone is sufficient to prevent fragment repair (Fig. 4d–e and 4h), shattered micronuclear DNAs may be poor substrates for recognition and/or processing by components of HR and MMEJ. Thus, canonical NHEJ is the predominant DNA repair mechanism that facilitates the re-joining of micronuclei-derived chromosome fragments, an outcome consistent with the sequence junctions of chromothriptic events identified in human cancer genomes3,36, congenital disorders37, and experimentally-derived breakpoints1,2 – the majority of which lack stretches of homology or microhomology.
Prior sequencing efforts had suggested that chromothriptic-like reassembly in the primary nucleus is surprisingly efficient2, although a proportion of micronuclei persist throughout mitosis and fail to reincorporate into the nucleus9. Whether – and if so, to what extent – micronucleus-specific DNA repair activity contributes to fragment re-ligation remains unknown. To determine whether fragment reassembly occurs within micronuclei, DNA extracted from purified micronuclei (following 4d dox/IAA treatment, Fig. 2f–g) were subjected to paired-end sequencing to search for and quantify potential intra-chromosomal re-ligation events. Genomic DNAs from parental cells were sequenced in parallel as a reference, and paired-reads of equivalent size and quality were generated from each source of DNA (Supplemental Fig. 5a–b). Consistent with prior measurements by FISH (Fig. 2g), purified micronuclear fractions were selectively enriched for the Y chromosome, as indicated by an average ~27-fold enrichment in Y-mapped sequencing reads (Fig. 5a). Due to co-sedimentation with micronuclei, these fractions were also enriched (~300-fold) for mitochondrial DNA sequences that were excluded from further analyses.
Figure 5. Repair by non-homologous end joining does not occur efficiently within micronuclei.
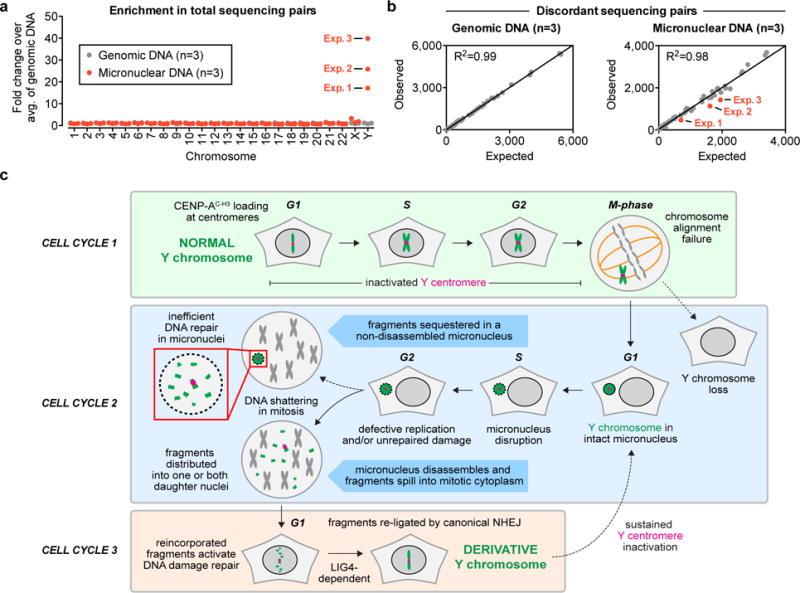
(a) Enrichment in the number of paired-end sequencing reads mapping to each chromosome. Each data point represents an independent DNA sample, and micronuclear DNAs were obtained from the purified fractions shown in Fig. 2f–g. The total number of reads are provided in Statistics Source Data. (b) Discordant pairs (with read-ends mapping >100 kb apart on the same chromosome) were quantified and plotted against an expected number of discordant pairs produced from random ligation events during library construction that were extrapolated from the graphs in Supplementary Fig. 5c. Each dot represents a single chromosome from n = 3 independent samples derived from the indicated DNA source, and the red dots represent the Y chromosome. (c) Model depicting how micronucleation, shattering, and NHEJ-mediated repair facilitates chromothripsis on initially missegregated chromosomes within three consecutive cell cycles.
Discordant sequencing pairs – a readout for structural rearrangements38 – were quantified for each sample and defined as reads whose paired-ends mapped >100 kilobases apart on the same chromosome. Consistent across three independent experimental samples for every micronuclear chromosome, discordant pairs were not detected significantly above a level expected from random re-ligation events that arise artificially during next-generation DNA library construction (Fig. 5b). The number of discordant background events (which accounts for ~0.05% of total sequencing pairs) can be estimated as a polynomial function of chromosome concentration within a given sample (a second order rate reaction, Supplemental Fig. 5c). For the Y chromosome, discordant pairs were detected slightly below an expected frequency – a reduction that may reflect the complex sequence features of the human Y chromosome39. Because sequencing of micronuclear fractions exclude chromosomes that were subjected to repair after nuclear incorporation, these data suggest that NHEJ-dependent re-ligation spatially occurs primarily in the nucleus following fragment reincorporation. Thus, consistent with terminated nuclear function within disrupted micronuclei31, repair activity in micronuclei either does not occur or occurs at an efficiency too low to be detected by sequencing.
The approach reported here can in principle be used to inactivate any CENP-B-deficient centromere, in particular rare chromosomes containing neocentromeres. Applying this strategy for the Y chromosome, we have determined the fate of missegregated chromosomes over subsequent cell generations and have reconstructed the sequence of major events underlying chromothripsis involving chromosomal micronucleation, fragmentation, and reassembly. Our results support a multi-cell cycle mechanism for chromothripsis (Fig. 5c) in which a missegregated chromosome entrapped into a micronucleus first undergoes shattering induced through mitotic entry-driven premature micronuclear chromosome condensation. In the next cell cycle, the resulting fragments are incorporated into one or both newly-formed daughter nuclei – perhaps through one or more undetermined DNA tethering mechanism(s) – and efficiently re-ligated in random order by LIG4 in a manner analogous to translocation formation in human cells40. We propose that error-prone canonical NHEJ, which independent of sequence homology between fragmented ends, produces structural rearrangements onto a chromosome initially missegregated from two cell cycles earlier.
METHODS
Cell culture, generation of stable cell lines, and reagents
T-REx Flp-In DLD-1 cells (provided by S. Taylor, University of Manchester, UK) were cultured in Dulbecco’s Modified Eagle’s Medium (DMEM, Thermo Fisher) supplemented with 10% tetracycline-free fetal bovine serum (Omega Scientific) and 100 U/mL penicillin-streptomycin. Cells were maintained at 37°C under 5% CO2 and atmospheric oxygen. CENPA alleles were genetically modified in TIR1-expressing T-REx Flp-In DLD-1 cells26 by co-transfection with pcDNA3.1 plasmids (Invitrogen) encoding TAL effector nucleases, as previously described18, and an EYFP-AID donor construct targeting the translation start codon of CENPA. Single EYFP+ cells were isolated by fluorescence-activated cell sorting (Sony SH800) and screened by immunoblotting and PCR for CENP-A–/EYFP-AID clones. CENP-AWT and CENP-AC-H3 rescue cDNAs were cloned into pcDNA5/FRT/TO plasmids and co-transfected with pOG44 into TIR1-DLD-1 CENP-A–/EYFP-AID cells using X-tremeGENE 9 (Roche). Cells that underwent stable Flp recombinase-mediated transgene integration at the FRT locus were selected with 100 μg/mL hygromycin (Thermo Fisher), and Y chromosome-positive clones were confirmed by FISH.
To generate stable cell lines expressing fluorescent reporters of interest, H2B-mRFP and mCherry-NLS-TagRFP (annotated as 2×RFP-NLS, a gift from E. Hatch and M. Hetzer, Salk Institute, USA) open reading frames were cloned into pBABE retroviral vectors and packaged in 293GP cells by co-transfection with pVSV-G using X-tremeGENE 9. Viral supernatants after 48- or 72-hour transfection were filtered (0.45 μm) and target cells were infected in the presence of 5 μg/mL polybrene (Santa Cruz) for ~16 hours. Fluorescent cells were isolated by fluorescence-activated cell sorting (Sony SH800).
Doxycycline and the auxin plant hormone indole-3-acetic acid (IAA) purchased from Sigma were dissolved in cell culture-grade water and used at 1 μg/mL and 500 μM, respectively. For cell cycle arrest experiments, 100 ng/mL nocodazole (Sigma) was used for mitotic arrest, 1 μM PD-0332991 (provided by S. Dowdy, UC San Diego, USA) was used for G1 arrest, and 10 μM RO-3306 (Sigma) was used for G2 arrest, all of which were dissolved in DMSO. The following DNA damage repair inhibitors were dissolved in DMSO and used at the indicated concentrations: 250 μM SCR7 (LIG4 inhibitor), 25 μM RI-1 (RAD51 inhibitor, both provided by A. Shiau, Ludwig Institute for Cancer Research, USA), and 10 μM NU7026 (DNA-PKcs inhibitor, Abcam).
All cell lines were tested for mycoplasma and confirmed free of contamination. The cell lines used in this study were not authenticated and are not found in the database of commonly misidentified cell lines that is maintained by ICLAC and NCBI BioSample.
Cell growth and clonogenic assays
For cell doubling time measurements, cells were plated into six-well dishes in triplicate and counted at three days intervals. For cell cycle analysis, ethanol-fixed cells were stained with 10 μg/mL propidium iodide and 50 μg/mL RNase A and analyzed for DNA content by flow cytometry on a BD LSR II instrument (BD Biosciences). For clonogenic growth assays, 100 cells were plated into six-well dishes in triplicate for two weeks. Methanol-fixed colonies were stained with a 0.5% crystal violet, 25% methanol solution and manually quantified.
Mitotic spread preparation and DNA fluorescent in situ hybridization (FISH)
For interphase FISH, cells plated in chambered slides were fixed in cold methanol:acetic acid (3:1) for 15 mins and dehydrated with 80% ethanol. For metaphase spreads, cells were arrested for 4 hours with 100 ng/mL colcemid (KaryoMAX, Thermo Fisher), harvested by trypsinization, and incubated at 37°C in hypotonic 75 mM KCl solution for six mins. Cell pellets were then fixed with cold methanol:acetic acid (3:1) and dropped onto slides. For calyculin A-induced spreads, trypsinized cell pellets were resuspended in 1 mL medium containing 100 nM calyculin A (Calbiochem) and incubated at 37°C. After 1 hour, 9 mL cold PBS was added, centrifuged, and cells were processed as described for metaphase spreads.
For DNA FISH, centromere enumeration and/or whole chromosome painting probes (MetaSystems) combined at equal ratio were applied to slides, sealed with a coverslip, co-denatured at 75°C for 2 mins, and hybridized overnight at 37°C in a humidified chamber. Slides were subsequently washed with 0.4× SCC at 72°C for 2 mins and rinsed in 2× SCC, 0.05% Tween-20 at room temperature for 30 seconds. Slides were then rinsed in water, counterstained with DAPI, and mounted in anti-fade solution. FISH images were acquired on a DeltaVision Core system (Applied Precision) at 60× magnification (5 × 1μm z-sections) and maximum intensity projections were generated using softWoRx program.
Quantification of fragmentation FISH
Following Y chromosome paint and centromere FISH on metaphase spreads, Y chromosome-positive spreads were manually scored for fragmentation based on the following criteria: (i) Y chromosome paint signal must be DAPI-positive, (ii) Y centromere signal must be DAPI-positive and overlap with paint signal, (iii) each fragmentation event must generate a minimum of three Y chromosome fragments, and (iv) at least one acentric Y fragment must be generated. For calyculin A experiments, only “metaphase-like” spreads that yielded distinct and normal appearing single (G1) or double chromatids (G2) were scored.
Immunofluorescence and immuno-FISH
For indirect immunofluorescence, cells plated onto poly-L-lysine-coated coverslips were fixed in 4% formaldehyde for 10 mins. Cells were pre-extracted with 0.3% Triton X-100 in PBS for 5 mins and incubated in Triton Block (0.2 M Glycine, 2.5% FBS, 0.1% Triton X-100, PBS). The following primary antibodies were used at 1:1,000 dilution (unless noted) in Triton Block and washed with 0.1% Triton X-100 in PBS: anti-CENP-A (Abcam, ab13939), anti-CENP-C (MBL, PD030), 1:400 ACA (Antibodies Incorporated, 15-235-0001), anti-phospho H2AX (S139) clone JBW301 (EMD Millipore, 05-636), and 1:200 anti-Lamin B1 (Proteintech Group, 12987-1-ap). Immunofluorescent images were acquired on a DeltaVision Core system at 40–60× magnification (30 × 0.2μm z-sections) and deconvolved maximum intensity projections were generated using softWoRx program. ImageJ was used to quantify fluorescent intensity. For immunofluorescence combined with DNA FISH, the immunofluorescence procedure was performed first followed by the described FISH procedure.
Immunoblotting
Whole-cell extracts were collected in SDS sample buffer and boiled for 10 mins. Samples were resolved by SDS-PAGE, transferred to PVDF, and blocked with 5% milk in PBST (PBS, 0.1% Tween-20). The following primary antibodies were used at 1:1,000 dilution (unless noted) in PBST: anti-CENP-A (Cell Signaling, 2186), anti-phospho histone H2AX (ser139) clone JBW301 (EMD Millipore, 05-636), anti-phospho histone H3 (ser10) (Cell Signaling, 9706), 1:4,000 anti-histone H3 (Sigma H0164), anti-LIG4 (GeneTex, GTX100100), anti-DNA-PKcs (Bethyl, A300-516A), anti-LIG3 (Bethyl, A301-637A), anti-PARP (BD Pharmingen, 556362, kindly provided by X. Wu, The Scripps Research Institute, USA), anti-BRCA2 (Bethyl, A303-434A), anti-RAD51 (Abgent, AM8421b), and 1:2,000 anti-GAPDH (Cell Signaling, 14C10). Blots were probed with 1:4,000 dilutions of HRP-conjugated secondary antibodies (GE Healthcare) and exposed to film. All unprocessed film scans with the appropriate size markers are provided in Supplementary Fig. 6.
siRNA transfection
The following SMARTpool ON-TARGETplus siRNAs were purchased from GE Dharmacon and used: LIG4 (L-004254-00-0005), DNA-PK (L-005030-00-0005), BRCA2 (L-003462-00-0005), RAD51 (L-003530-00-0005), LIG3 (L-009227-00-0005), and PARP1 (L-006656-03-0005). Transfections were conducted using Lipofectamine RNAiMAX (Thermo Fisher) at a final siRNA concentration of 20 nM. Non-targeting siRNAs (D-001810-04-05) were used for experimental controls, and siRNAs targeting Ubiquitin B (UBB, L-013382-00-0005) were used to measure transfection efficiency by cell lethality (>99% cell death following 48 hour transfection).
Live-cell imaging
DLD-1 cells expressing retrovirus-integrated H2B-mRFP were plated in chambered slides (Ibidi) and switched to CO2-independent medium (Thermo Fisher) supplemented with 10% fetal bovine serum prior to filming by time-lapse microscopy. Images were acquired on a DeltaVision Core system in a controlled 37°C environment at 4-min intervals for 12 hours using 40× magnification (10 × 4μm z-sections) and low powered exposures. Maximum intensity projections were generated using softWoRx program and movies were analyzed in ImageJ. Mitotic timing is defined as the duration from nuclear envelope breakdown to anaphase onset.
Micronuclei purification and sequencing
The procedure described by Shimizu and Wahl30 were closely followed for micronuclei purification with the exception of hydroxyurea treatment. Briefly, ~200 million cells were collected, resuspended, and incubated in DMEM containing 10 μg/mL cytochalasin B (Sigma) for 30 mins at 37°C, pelleted, and gently dounce homogenized in cold lysis buffer (10 mM Tris-HCl, 2 mM magnesium acetate, 3 mM CaCl2, 0.32 M sucrose, 0.1 mM EDTA, 1 mM DTT, 0.1% NP-40, 0.15 mM spermine, 0.75 mM spermidine, 10 μg/ml cytochalasin B, pH 8.5, 4°C) with ten slow strokes of a loose-fitting pestle. Release of nuclei was confirmed by DAPI-staining and microscopy. The homogenate was centrifuged (Thermo Scientific Sorvall Legend XTR) through a step gradient of 1.06, 1.4, and 1.8 M sucrose buffer (10 mM Tris-HCl, 5 mM magnesium acetate, 0.1 mM EDTA, 1 mM DTT, 0.3% BSA, 0.15mM spermine, 0.75 mM spermidine, pH 8.0, 4°C). The 1.8 M sucrose fraction was pelleted using ultracentrifugation (Beckman Coulter Optima L-80 XP), resuspended in 0.8 M sucrose buffer, and separated through a linear gradient of 1.0 to 1.8 M sucrose buffer using centrifugation (Thermo Scientific Sorvall Legend XTR). 0.25–0.5 mL fractions collected from the top of the gradient were examined for purity by DAPI-staining. Fractions containing pure micronuclei free of primary nuclei contamination were combined and diluted in PBS. 5% of the final fraction were fixed in methanol:acetic acid (3:1) and spotted onto a glass slide for FISH analysis. Genomic (from untreated parental DLD-1 CENP-AC-H3) and micronuclear DNAs were extracted using a Quick-gDNA MiniPrep column (Zymo Research). Micronuclear fractions typically recovered ~40 ng of total DNA per experiment.
For library preparation, DNA samples were fragmented using Adaptive Focused Acoustics (E220 Focused Ultrasonicator, Covaris) to produce a target average fragment size of 1,000 bp. Fragmented DNA was purified using the Agencourt AMPure XP beads (Beckman Coulter) and sequencing libraries were generating using the KAPA Hyper Prep Kit (KAPA Biosystems) following manufacturer’s instructions using 9 cycles of amplification. Library quality was assessed using High Sensitivity D1000 kit on a 2200 TapeStation instrument (Agilent Technologies) and size-selected on a PippinHT (Sage Sciences) instrument with a 1.5% agarose gel for 600–1,500 bp fragments. Paired-end sequencing was performed using an Illumina HiSeq 2500 instrument, generating 100 bp × 2 reads to a target depth of approximately 60 million paired reads per sample.
Discordant sequencing analysis
Sequencing read quality for all samples were confirmed with FastQC (http://www.bioinformatics.bbsrc.ac.uk/projects/fastqc/), and adapter sequences were trimmed on both ends using cutadapt. Reads were mapped to the hg38 human reference genome using Bowtie2 with maximum valid fragment length set to 2,000 bp. Alignment files were sorted and merged using SAMtools to generate individual files for each sample. Duplicate reads were removed using Picard’s MarkDuplicates (http://broadinstitute.github.io/picard).
Cutadapt
Martin M. Cutadapt removes adapter sequences from high-throughput sequencing reads. EMBnet.journal 17, 10-12 (2011). doi:http://dx.doi.org/10.14806/ej.17.1.200
Bowtie2
Langmead B, Salzberg SL. Fast gapped-read alignment with Bowtie 2. Nat Methods 9(4), 357-359 (2012). doi:http://dx.doi.org/10.1038/nmeth.1923
Samtools
Li H, Handsaker B, Wysoker A, Fennell T, Ruan J, Homer N, Marth G, Abecasis G, Durbin R and 1000 Genome Project Data Processing Subgroup. The Sequence Alignment/Map format and SAMtools. Bioinformatics 25, 2078-9 (2009).
DNA fragment sizes were recalculated using 1,000 mapped read pairs per chromosome, each with mapping quality ≥35 and no clipped bases. Fragment size was defined as the distance between the first and last bases on the reference genome to which either read in the pair mapped. Because extreme fragment size outliers can skew these calculations, and are likely the result of chimeric fragments or true rearrangements rather than representing extremely large fragments, the top and bottom 2% of fragment sizes were removed before calculating the mean and variance.
Read pairs with mapping quality <35 were filtered out for the discordant pair analysis. Repeats such as LINEs and SINEs were not masked, as differences in the locations of such repeats are unlikely given that both genomic and micronuclear DNA samples were derived from the same cell line. Discordant read pairs caused by differences between the reference genome and the genome of the cell line should therefore be present at equal proportions in both samples. Discordant pairs were defined as paired sequencing reads in which ends mapped at least 100,000 bp apart on the same chromosome.
To measure if discordant pairs were enriched in the micronuclear samples, we considered how discordant read pairs arise in the absence of de novo rearrangements. Discordant pairs are present in sequencing datasets as a result of random ligation of short DNA fragments during library preparation. Because this formation is random, discordant pairs can be viewed as a second order reaction in which two fragments of DNA from the same chromosome randomly collide and ligate. Therefore, the number of such pairs should be proportional to the square of the fraction of total reads from that chromosome – a prediction that is supported by the genomic and micronuclear DNA sequencing datasets shown in Supplementary Fig. 5c. The predicted fraction of discordant pairs for each chromosome was calculated as f2 * n * 18.34, where f = the fraction of total reads from the chromosome, n = the total number of discordant pairs in the dataset, and 18.34 is a normalization factor equal to 1 divided by the sum of the squares of the fraction of total reads from each chromosome.
Statistical analysis and reproducibility
No statistical method was used to predetermine sample size and experiments were not randomized. Investigators were not blinded to group allocation during experiments or outcome assessment. GraphPad Prism 5.0 software was used to calculate statistical significance as specified in the figure legends. Graphs represent mean ± standard error (unless noted) and a p-value of <0.05 derived from at least three independent experiments was considered to be statistically significant. Figures with representative images were repeated independently at least twice (except for Fig. 3h that was performed once to identify optimal treatment time for downstream experiments). Data points for each quantitative experiment can be found in the Statistics Source Data (Supplementary Table 1). Unprocessed film scans from all immunoblotting experiments are shown in Supplementary Fig. 6 with the relevant size markers indicated.
Data availability
DNA sequencing data reported in this study have been deposited in NCBI Sequence Read Archive with the primary accession code SRP074439, and source data for Fig. 5a–b and Supplementary Fig. 5a–b have been provided in Supplementary Table 1. All other data that support the findings of this study are available from the corresponding author upon request.
Supplementary Material
Acknowledgments
We thank K. Jepsen and the UC San Diego IGM Genomics Center (MCC P30 CA023100) for DNA library preparation and sequencing, A. Shiau, S. Dowdy, E. Hatch, M. Hetzer, X. Wu, and T. Pyntikova for providing reagents, D. Jenkins, I. Goyal, and Y. Sun for technical assistance, and the UC San Diego School of Medicine Microscopy Core (NINDS P30 NS047101) for shared use of equipment. This work was funded by a grant from the NIH (GM029513) to D.W.C., who receives salary support from the Ludwig Institute for Cancer Research. D.C.P. is supported by the Howard Hughes Medical Institute and NIH (HG007852). P.L. was supported by a Cancer Cell Biology Training Grant from the NCI (5T32CA067754-18) and a postdoctoral fellowship from the Hope Funds for Cancer Research (HFCR-14-06-06).
Footnotes
AUTHOR CONTRIBUTIONS
P.L. and D.W.C. conceived the project, designed the experiments, and wrote the manuscript. P.L. conducted the experiments and analyzed the data. D.F. constructed the parental AID-tagged CENP-A cell line and provided key experimental input. P.L. and D.H.K. performed purification of micronuclei. O.S. assisted with FISH experiments. L.S.T., H.S., and D.C.P. analyzed the sequencing data. All authors contributed comments on the final manuscript.
COMPETING FINANCIAL INTERESTS
The authors have no competing financial interests.
References
- 1.Tan EH, et al. Catastrophic chromosomal restructuring during genome elimination in plants. eLife. 2015;4 doi: 10.7554/eLife.06516. [DOI] [PMC free article] [PubMed] [Google Scholar]
- 2.Zhang CZ, et al. Chromothripsis from DNA damage in micronuclei. Nature. 2015;522:1–27. doi: 10.1038/nature14493. [DOI] [PMC free article] [PubMed] [Google Scholar]
- 3.Stephens PJ, et al. Massive Genomic Rearrangement Acquired in a Single Catastrophic Event during Cancer Development. Cell. 2011;144:27–40. doi: 10.1016/j.cell.2010.11.055. [DOI] [PMC free article] [PubMed] [Google Scholar]
- 4.Janssen A, et al. Chromosome Segregation Errors as a Cause of DNA Damage and Structural Chromosome Aberrations. Science. 2011;333:1895–1898. doi: 10.1126/science.1210214. [DOI] [PubMed] [Google Scholar]
- 5.Rausch T, et al. Genome Sequencing of Pediatric Medulloblastoma Links Catastrophic DNA Rearrangements with TP53 Mutations. Cell. 2012;148:59–71. doi: 10.1016/j.cell.2011.12.013. [DOI] [PMC free article] [PubMed] [Google Scholar]
- 6.Maciejowski J, Li Y, Bosco N, Campbell PJ, de Lange T. Chromothripsis and Kataegis Induced by Telomere Crisis. Cell. 2015;163:1641–1654. doi: 10.1016/j.cell.2015.11.054. [DOI] [PMC free article] [PubMed] [Google Scholar]
- 7.Mardin BR, et al. A cell-based model system links chromothripsis with hyperploidy. Mol Syst Biol. 2015;11:828–828. doi: 10.15252/msb.20156505. [DOI] [PMC free article] [PubMed] [Google Scholar]
- 8.Sabatinos SA, Ranatunga NS, Yuan JP, Green MD, Forsburg SL. Replication stress in early S phase generates apparent micronuclei and chromosome rearrangement in fission yeast. Mol Biol Cell. 2015;26:3439–3450. doi: 10.1091/mbc.E15-05-0318. [DOI] [PMC free article] [PubMed] [Google Scholar]
- 9.Crasta K, et al. DNA breaks and chromosome pulverization from errors in mitosis. Nature. 2012;482:53–58. doi: 10.1038/nature10802. [DOI] [PMC free article] [PubMed] [Google Scholar]
- 10.Holland AJ, Cleveland DW. Chromoanagenesis and cancer: mechanisms and consequences of localized, complex chromosomal rearrangements. Nat Med. 2012;18:1630–1638. doi: 10.1038/nm.2988. [DOI] [PMC free article] [PubMed] [Google Scholar]
- 11.Kato H, Sandberg AA. Chromosome pulverization in human cells with micronuclei. J Natl Cancer Inst. 1968;40:165–179. [PubMed] [Google Scholar]
- 12.Orth JD, Loewer A, Lahav G, Mitchison TJ. Prolonged mitotic arrest triggers partial activation of apoptosis, resulting in DNA damage and p53 induction. Mol Biol Cell. 2012;23:567–576. doi: 10.1091/mbc.E11-09-0781. [DOI] [PMC free article] [PubMed] [Google Scholar]
- 13.Ganem NJ, Pellman D. Linking abnormal mitosis to the acquisition of DNA damage. J Cell Biol. 2012;199:871–881. doi: 10.1083/jcb.201210040. [DOI] [PMC free article] [PubMed] [Google Scholar]
- 14.Dalton WB, et al. Human Cancer Cells Commonly Acquire DNA Damage during Mitotic Arrest. Cancer Res. 2007;67:11487–11492. doi: 10.1158/0008-5472.CAN-07-5162. [DOI] [PMC free article] [PubMed] [Google Scholar]
- 15.Hayashi MT, Cesare AJ, Fitzpatrick JAJ, Lazzerini-Denchi E, Karlseder J. A telomere-dependent DNA damage checkpoint induced by prolonged mitotic arrest. Nat Struct Mol Biol. 2012;19:387–394. doi: 10.1038/nsmb.2245. [DOI] [PMC free article] [PubMed] [Google Scholar]
- 16.Klare K, et al. CENP-C is a blueprint for constitutive centromere-associated network assembly within human kinetochores. J Cell Biol. 2015;210:11–22. doi: 10.1083/jcb.201412028. [DOI] [PMC free article] [PubMed] [Google Scholar]
- 17.Carroll CW, Milks KJ, Straight AF. Dual recognition of CENP-A nucleosomes is required for centromere assembly. J Cell Biol. 2010;189:1143–1155. doi: 10.1083/jcb.201001013. [DOI] [PMC free article] [PubMed] [Google Scholar]
- 18.Fachinetti D, et al. DNA Sequence-Specific Binding of CENP-B Enhances the Fidelity of Human Centromere Function. Developmental Cell. 2015;33:314–327. doi: 10.1016/j.devcel.2015.03.020. [DOI] [PMC free article] [PubMed] [Google Scholar]
- 19.Fachinetti D, et al. A two-step mechanism for epigenetic specification of centromere identity and function. Nat Cell Biol. 2013;15:1–13. doi: 10.1038/ncb2805. [DOI] [PMC free article] [PubMed] [Google Scholar]
- 20.Logsdon GA, et al. Both tails and the centromere targeting domain of CENP-A are required for centromere establishment. J Cell Biol. 2015;208:521–531. doi: 10.1083/jcb.201412011. [DOI] [PMC free article] [PubMed] [Google Scholar]
- 21.Guse A, Carroll CW, Moree B, Fuller CJ, Straight AF. In vitro centromere and kinetochore assembly on defined chromatin templates. Nature. 2011;477:354–358. doi: 10.1038/nature10379. [DOI] [PMC free article] [PubMed] [Google Scholar]
- 22.Masumoto H, Masukata H, Muro Y, Nozaki N, Okazaki T. A human centromere antigen (CENP-B) interacts with a short specific sequence in alphoid DNA, a human centromeric satellite. J Cell Biol. 1989;109:1963–1973. doi: 10.1083/jcb.109.5.1963. [DOI] [PMC free article] [PubMed] [Google Scholar]
- 23.Earnshaw WC, et al. Molecular cloning of cDNA for CENP-B, the major human centromere autoantigen. J Cell Biol. 1987;104:817–829. doi: 10.1083/jcb.104.4.817. [DOI] [PMC free article] [PubMed] [Google Scholar]
- 24.Thompson SL, Compton DA. Proliferation of aneuploid human cells is limited by a p53-dependent mechanism. J Cell Biol. 2010;188:369–381. doi: 10.1083/jcb.200905057. [DOI] [PMC free article] [PubMed] [Google Scholar]
- 25.Hinchcliffe EH, et al. Chromosome missegregation during anaphase triggers p53 cell cycle arrest through histone H3.3 Ser31 phosphorylation. Nat Cell Biol. 2016;18:668–675. doi: 10.1038/ncb3348. [DOI] [PubMed] [Google Scholar]
- 26.Holland AJ, Fachinetti D, Han JS, Cleveland DW. Inducible, reversible system for the rapid and complete degradation of proteins in mammalian cells. Proceedings of the National Academy of Sciences. 2012;109:E3350–E3357. doi: 10.1073/pnas.1216880109. [DOI] [PMC free article] [PubMed] [Google Scholar]
- 27.Nishimura K, Fukagawa T, Takisawa H, Kakimoto T, Kanemaki M. An auxin-based degron system for the rapid depletion of proteins in nonplant cells. Nat Meth. 2009;6:917–922. doi: 10.1038/nmeth.1401. [DOI] [PubMed] [Google Scholar]
- 28.Jansen LET, Black BE, Foltz DR, Cleveland DW. Propagation of centromeric chromatin requires exit from mitosis. J Cell Biol. 2007;176:795–805. doi: 10.1083/jcb.200701066. [DOI] [PMC free article] [PubMed] [Google Scholar]
- 29.Leach NT, Jackson-Cook C. Micronuclei with multiple copies of the × chromosome: do chromosomes replicate in micronuclei? Mutat Res. 2004;554:89–94. doi: 10.1016/j.mrfmmm.2004.03.004. [DOI] [PMC free article] [PubMed] [Google Scholar]
- 30.Shimizu N, Kanda T, Wahl GM. Selective capture of acentric fragments by micronuclei provides a rapid method for purifying extrachromosomally amplified DNA. Nat Genet. 1996;12:65–71. doi: 10.1038/ng0196-65. [DOI] [PubMed] [Google Scholar]
- 31.Hatch EM, Fischer AH, Deerinck TJ, Hetzer MW. Catastrophic nuclear envelope collapse in cancer cell micronuclei. Cell. 2013;154:47–60. doi: 10.1016/j.cell.2013.06.007. [DOI] [PMC free article] [PubMed] [Google Scholar]
- 32.Terradas M, Martín M, Tusell L, Genescà A. DNA lesions sequestered in micronuclei induce a local defective-damage response. DNA Repair (Amst) 2009;8:1225–1234. doi: 10.1016/j.dnarep.2009.07.004. [DOI] [PubMed] [Google Scholar]
- 33.Johnson RT, Rao PN. Mammalian cell fusion: induction of premature chromosome condensation in interphase nuclei. Nature. 1970;226:717–722. doi: 10.1038/226717a0. [DOI] [PubMed] [Google Scholar]
- 34.Gavet O, Gavet O, Pines J. Activation of cyclin B1-Cdk1 synchronizes events in the nucleus and the cytoplasm at mitosis. J Cell Biol. 2010;189:247–259. doi: 10.1083/jcb.200909144. [DOI] [PMC free article] [PubMed] [Google Scholar]
- 35.Ceccaldi R, Rondinelli B, D’Andrea AD. Repair Pathway Choices and Consequences at the Double-Strand Break. Trends in Cell Biology. 2016;26:52–64. doi: 10.1016/j.tcb.2015.07.009. [DOI] [PMC free article] [PubMed] [Google Scholar]
- 36.Malhotra A, et al. Breakpoint profiling of 64 cancer genomes reveals numerous complex rearrangements spawned by homology-independent mechanisms. Genome Res. 2013;23:762–776. doi: 10.1101/gr.143677.112. [DOI] [PMC free article] [PubMed] [Google Scholar]
- 37.Kloosterman WP, et al. Constitutional Chromothripsis Rearrangements Involve Clustered Double-Stranded DNA Breaks and Nonhomologous Repair Mechanisms. Cell Reports. 2012;1:648–655. doi: 10.1016/j.celrep.2012.05.009. [DOI] [PubMed] [Google Scholar]
- 38.Campbell PJ, et al. Identification of somatically acquired rearrangements in cancer using genome-wide massively parallel paired-end sequencing. Nat Genet. 2008;40:722–729. doi: 10.1038/ng.128. [DOI] [PMC free article] [PubMed] [Google Scholar]
- 39.Skaletsky H, et al. The male-specific region of the human Y chromosome is a mosaic of discrete sequence classes. Nature. 2003;423:825–837. doi: 10.1038/nature01722. [DOI] [PubMed] [Google Scholar]
- 40.Ghezraoui H, et al. Chromosomal Translocations in Human Cells Are Generated by Canonical Nonhomologous End-Joining. Mol Cell. 2014;55:829–842. doi: 10.1016/j.molcel.2014.08.002. [DOI] [PMC free article] [PubMed] [Google Scholar]
Associated Data
This section collects any data citations, data availability statements, or supplementary materials included in this article.
Supplementary Materials
Data Availability Statement
DNA sequencing data reported in this study have been deposited in NCBI Sequence Read Archive with the primary accession code SRP074439, and source data for Fig. 5a–b and Supplementary Fig. 5a–b have been provided in Supplementary Table 1. All other data that support the findings of this study are available from the corresponding author upon request.