

Abstract
Coenzyme Q (Q) is a lipid-soluble antioxidant essential in cellular physiology. Patients with Q deficiencies, with few exceptions, seldom respond to treatment. Current therapies rely on dietary supplementation with Q10, but due to its highly lipophilic nature, Q10 is difficult to absorb by tissues and cells. Plant polyphenols, present in the human diet, are redox active and modulate numerous cellular pathways. In the present study, we tested whether treatment with polyphenols affected the content or biosynthesis of Q. Mouse kidney proximal tubule epithelial (Tkpts) cells and human embryonic kidney cells 293 (HEK 293) were treated with several types of polyphenols, and kaempferol produced the largest increase in Q levels. Experiments with stable isotope 13C-labeled kaempferol demonstrated a previously unrecognized role of kaempferol as an aromatic ring precursor in Q biosynthesis. Investigations of the structure-function relationship of related flavonols showed the importance of two hydroxyl groups, located at C3 of the C ring and C4′ of the B ring, both present in kaempferol, as important determinants of kaempferol as a Q biosynthetic precursor. Concurrently, through a mechanism not related to the enhancement of Q biosynthesis, kaempferol also augmented mitochondrial localization of Sirt3. The role of kaempferol as a precursor that increases Q levels, combined with its ability to upregulate Sirt3, identify kaempferol as a potential candidate in the design of interventions aimed on increasing endogenous Q biosynthesis, particularly in kidney.
Keywords: Coenzyme Q, plant polyphenols, flavonols, kaempferol, antioxidants, Sirt3, 4-hydroxybenzoic acid, kidney cells
Graphical abstract

1. Introduction
Coenzyme Q (Q) is the only lipid-soluble antioxidant synthesized endogenously and present in all cellular membranes. It plays an important role in cellular metabolism and protects membranes and lipoproteins from protein oxidation and lipid peroxidation [1]. The biosynthesis of Q is still not completely characterized. Its biosynthesis is divided into three steps: the synthesis of the polyisoprenoid tail, the attachment of the tail to the benzoquinone ring precursor, followed by subsequent modifications of the ring. In higher eukaryotes, synthesis of the polyisoprenoid tail depends on the cytosolic mevalonate pathway and on polyisoprenyl-diphosphate synthases located within the mitochondria [2, 3]. The number of isoprene units (designated as the subscript n, Qn) in the polyisoprenyl tail varies in different organisms. While Saccharomyces cerevisiae synthesize Q6 and humans mainly Q10, mice have two major isoforms, Q9 and Q10 [4]. The polyprenyltransferase Coq2 joins the quinone ring precursor to the polyisoprenoid tail inside mitochondria, and then the ring is modified by distinct enzymes encoded by several COQ genes [5]. These modifications include three hydroxylations, one decarboxylation, two O-methylations and one C-methylation.
4-Hydroxybenzoic acid (4HB) was considered to function as the only confirmed ring precursor of Q for more than 40 years. In 2010 Marbois et al. and Pierrel et al. characterized p-aminobenzoic acid (PABA) as a novel Q precursor in yeasts [6, 7]. In 2014, Block et al. showed that Arabidopsis is able to use p-coumarate, but not PABA, as another ring precursor in Q biosynthesis [8]. Recently, in 2015, Xie et al. have described that human and E. coli cells do not utilize PABA as precursor in the biosynthesis of Q while both p-coumarate and resveratrol, another polyphenol structurally similar to p-coumarate, can serve as a ring precursors of Q biosynthesis in E. coli, yeasts and human cells [9].
A decrease of Q biosynthesis and total Q levels correlates with physiological aging in some tissues [10]. Q10 deficiencies related to distinct diseases are observed in patients, and fortunately some patients with Q deficiencies respond to treatment with dietary supplementation of Q10 [5, 11]. However, the long polyisoprenoid chain renders Q10 highly lipophilic and difficult to absorb by cells. Thus, the poor bioavailability of exogenous Q10 often results in treatments that are ineffective [12]. To develop more successful strategies, efforts should also focus on identifying molecules that enhance the endogenous synthesis of Q.
A traditional view is that plant polyphenols constitute a principal source of antioxidants in human diet. However, polyphenols are redox active compounds that elicit cellular signaling and modulate pathways that determine activity of the mitochondrial electron transport chain, membrane potential and biogenesis, intra-mitochondrial oxidative status and, ultimately, mitochondria-triggered cell death [13]. The more than 5,000 polyphenol molecules identified have been classified into five major chemical families, namely flavonoids, phenolic acids, stilbenes, lignans and curcuminoids [14]. Studies reveal that their specific chemical structure affects their biological properties [14, 15], and some of them can act as Q ring precursors [9].
In the present study, we determined the effect of several polyphenols on Q content and biosynthesis. Among the several polyphenols tested, kaempferol produced the strongest increase in Q content and acted as a novel ring precursor of Q biosynthesis in mammalian cells. The effect of kaempferol on Q biosynthesis may be linked to the numerous beneficial effects attributed to flavonoids. Our studies indicate a novel potential biosynthetic pathway leading to aromatic ring precursors of Q and also suggest new strategies that can help to alleviate the symptoms associated with Q deficiency in aging or disease states.
2. Material and methods
2. 1. Chemicals and reagents
Non-labeled kaempferol, resveratrol, quercetin, piceatannol, apigenin, luteolin, naringenin, curcumin, and ferulic acid were obtained from Santa Cruz Biotechnology, Inc. All these compounds were checked in the Mass Spectrometry & Chromatography Service of the University of Córdoba and contamination with 4HB, vanillic or protocatechuic acid was not detected at levels higher than 0.01% of solid material. PABA, 4HB, vanillin, nicotinamide (NAM), 4-hydroxyphenylacetic acid and p-cresol were purchased from Sigma-Aldrich. 13C-kaempferol was obtained from IsoLife and D6-curcumin and D3-ferulic acid were purchased from SynInnova. 13C12-curcumin was synthesized from 13C6-vanillin (Cambridge Isotopes Laboratories Inc) following a published procedure [16]. Standards of Q4, Q6, Q9 and Q10 were purchased from Sigma-Aldrich. Dipropoxy-Q10 was synthesized essentially as described by Edlund [17] for diethoxy-Q10, except 1-propanol was substituted for ethanol while maintaining the other reagents and conditions.
2. 2. Cell cultures
Mouse kidney proximal tubule epithelial (Tkpts) cells [18], were provided by Dr. Elsa Bello-Reuss (Texas Tech University Health Science Center) and Dr. Judit K. Magyesi (University of Arkansas for Medical Sciences, Little Rock, AR). Human embryonic kidney cells 293 (HEK 293), human liver hepatoma cells (Hep G2), human promyelocytic leukemia cells (HL-60), mouse liver hepatoma cells (Hepa 1.6) and mouse embryonic fibroblast (MEFs) were also used in some studies. These cell lines were obtained from ATCC, whereas MEFs were obtained in our own laboratory by repeated subculture of cells derived from mouse embryos following a standard 3T3 immortalization protocol [19]. Tkpts and Hepa 1.6 cells were grown in DMEM/F12 with 4.5 g/L glucose supplemented with 10% FBS, 2 mM L-glutamine, and gentamicin-amphotericin B (125 μg/ml and 5 mg/ml, respectively). The same media but containing 1 g/L of glucose was used to culture HEK 293 cells. MEFs were cultured in DMEM with 2 g/L glucose supplemented with 10% fetal bovine serum (FBS, Sigma-Aldrich), 2 mM L-glutamine and gentamicin. Hep G2 cells were maintained in MEM containing 1 g/L glucose and supplemented with 10% FBS, 1% sodium pyruvate, 1% L-glutamine and gentamicin-amphotericin B. HL-60 cells were grown in RPMI-1640 supplemented with 10% FBS, 2 mM L-glutamine and gentamicin-amphotericin B. All cultures were maintained at 37 °C in a humidified atmosphere with 5% CO2.
Saccharomyces cerevisiae BY4741, with genotype MAT a his3Δ1 leu2Δ0 met15Δ0 ura3Δ0 [20] was used in all the determinations involving yeasts. Cells were grown in drop-out-dextrose medium (DOD) composed of 2% dextrose, 6.8 g/L Bio101 yeast nitrogen base minus pABA minus folate with ammonium sulfate and 5.83 mM sodium monophosphate (pH adjusted to 6.0 with NaOH). The yeast colonies were maintained in solid plate yeast extract peptone dextrose (YPD) medium composed of 1% Bacto-Yeast extract, 2% Bacto-Peptone, 2% Dextrose and 2% Bacto agar.
2. 3. Treatments of human and mouse cells with polyphenols, and viability assays
The same experimental conditions were used for all compounds when tested in mouse and human cells. Assays were performed in six-well plates with an initial amount of 50,000–100,000 cells/well. Cells were incubated with the tested compounds for 48 h under standard culture conditions (37 °C, 5% CO2). Once the treatment was completed, cells were detached from culture plates and pelleted by low-speed centrifugation (approximately 1,000 g). Cell pellets were collected and stored at −80 °C until use. Final concentrations of each polyphenol in assays to determine Q content and biosynthesis were selected from the results of viability assays to ensure that experimental conditions did not jeopardize cell viability. To perform these assays, 50 μl/ml of a 5 mg/ml stock of 3-(4,5-dimethylthiazol-2-yl)-2,5-diphenyltetrazolium bromide (MTT, Sigma) was added to the cell cultures (previously plated in 24 well-plates). After 2 h of incubation at 37 °C in 5% CO2, the medium was removed, the formazan solubilized with 0.04M HCl in absolute isopropanol, and the absorbance measured at 590 nm in a plate reader (Optic Ivymen System 2000-C).
2. 4. Growth and treatment of yeast cells with polyphenols
BY4741 yeast were grown in 50 ml precultures in DOD medium overnight in a shaking incubator (30 °C, 250 rpm). A sample of the yeast preculture was inoculated in 18 × 150 mm borosilicate test tubes containing 5 ml of DOD medium to give an initial cell density of 0.2 A600. Incubations continued at 30 °C and 250 rpm until a cell density of 0.5 A600. At that point, designated polyphenol compounds were added to attain a final concentration of 10 μM and incubation resumed. The tubes were removed from the shaker at 3 h. The A600 values were measured and the cell pellets were collected and stored at −20 °C.
2. 5. Preparation of cell and tissue extracts
Whole lysates were prepared from cells as described by Ariza et al. [21] and steady state protein levels were determined by Western blot (see below). Tissues were obtained from Sirt3 knockout mice and their corresponding genetic background-matched controls bred at the Gladstone Institute (San Francisco, CA, USA). Extracts from these tissues were prepared as described by Ariza et al. [21].
2. 6. Lipid extractions
2. 6. 1. Lipid extractions for HPLC-electrochemical detection measurements
Mouse and human cell pellets (approx. 106 cells) from the different treatments or 20 mg of the tissue homogenate were collected and resuspended in 90 μl of Hanks’ balanced salt solution. Samples were then solubilized using 10 μl of 10% SDS followed by 200 μl of 95:5 ethanol-isopropanol. After vigorous vortexing, 500 μl of hexane were added and the samples were centrifuged for 5 min at 12,500 rpm in an Eppendorf Minispin. Lipids were recovered within the upper hexane phase, and this extraction step was repeated twice. Hexane phases were combined and the solvent evaporated under vacuum. Lipid extracts were stored frozen at −80 °C until use.
2. 6. 2. Lipid extractions for HPLC-MS/MS measurements
Di-propoxy-Q10 was added to the pellets as internal standard in mouse and human samples while Q4 was used in yeast samples. Cell pellets were vortexed in 1 ml of methanol and 1 ml of petroleum ether. The organic upper layer was transferred to a new tube. Another 1 ml of petroleum ether was added to the original methanol layer, and samples were vortexed again. The organic phase was removed, and the combined organic phase was dried under a stream of nitrogen gas.
2. 7. Measurements of Q levels by HPLC
HPLC analysis was carried out with a Beckman Gold System (Beckman Coulter, USA) connected to a Coulochem II electrochemical detector (ESA, Chemsfold, MA, USA). The chromatographic separation was performed with a C18 reverse phase analytical column (4.6 mm × 25 cm, Ultrasphere ODS, 5 μm particle). The mobile phase was composed of methanol/isopropanol/1M ammonium acetate, pH 4.4, (53:45:2), and a flow rate of 1 ml/min. The analytical cell (ESA, Model 5010) was set at potentials of −500 mV and +300 mV in electrodes 1 and 2, respectively. The entire procedure was performed at room temperature. Lipid extracts were dissolved in 30 μl of methanol, and the sample was subjected then to a reduction step by adding 1 μl of freshly prepared 50 mM sodium borohydride just before injection into the system. This procedure results in the reduction of the quinones (Q) to their corresponding hydroquinones (QH2), which are detected at the second electrode with maximal sensitivity, and allows for a shorter chromatography time. Retention times were 10–11 min for reduced Q9H2 and 14–15 min for reduced Q10H2. The area units of hydroquinone peaks were integrated and referred to the reduced Q10H2 standard. Normalized values were obtained by referring to the amount of protein of each sample, calculated previously with a Bradford assay [22].
2. 8. Assays of Q biosynthesis
2. 8. 1. Assays with a radiolabeled precursor
Q biosynthesis was measured with the radiolabeled precursor 4-hydroxy-(U-14C) benzoate (14C-4HB) synthesized from (U-14C)-tyrosine (Amersham) essentially as described by Clarke et al. [23] with a minor modification: aqueous tyrosine was dissolved in 25 μl of 10 M KOH and 12.5 μl of 10 M NaOH before blown to near dryness under nitrogen. 14C-4HB (100,000 CPM) was added to the cells during the 48 h incubation with the treatment. Samples were processed as described previously by Córdoba-Pedregosa et al. [24]. Briefly, cells were rinsed twice with Hanks’ balanced salt solution and fixed for 15 min in 1 ml of 5% trichlocoacetic acid (TCA). After thoroughly washing with TCA to remove the non-incorporated precursor, the radioactivity from the TCA-insoluble Q-containing fraction was directly extracted with 1 ml of 1 M NaOH for 2 h at room temperature with gentle stirring. Radioactivity was quantified in a Beckman scintillation counter by mixing 900 μl of each sample with 4 ml of scintillation liquid. The CPM values so obtained were then referred to the total amount of protein in each sample.
2. 8. 2. Assays with stable isotope-labeled compounds
Lipid extracts were measured by HPLC-tandem mass spectrometry (MS/MS) analyses as previously described by Xie et al. [9] with minor modifications. Samples were resuspended in 200 μl of ethanol containing 1 mg/ml benzoquinone in order to oxidize all the lipids prior to chromatographic separation with a mobile phase composed of 90% solvent A (95:5 mixture of methanol:isopropanol containing 2.5 mM ammonium formate) and 10% solvent B (isopropanol containing 2.5 mM ammonium formate) at a constant flow rate of 1 ml/min. Transitions monitored are described in Table 1. The area value of each peak, normalized with the correspondent standard curve and internal standard, was referred either to the initial amount of protein in the case of determinations carried out in murine and human cells, or to the total OD present in the yeast cell pellet (as determined by measurements of A600).
Table 1. HPLC-MS-MS transitions for each analyte.
We summarize here the transitions used for each molecule in the HPLC-MS/MS. We monitored both the protonated and the ammoniated transitions.
| Molecule | m/z (+ H) | m/z (+ NH3) |
|---|---|---|
| Q4 | 455.3/197.08 | 472.3/197.08 |
| Q6 | 591.4/197.08 | 608.4/197.08 |
| 13C6-Q6 | 597.4/203.08 | 614.4/203.08 |
| Q9 | 795.6/197.08 | 812.6/197.08 |
| D3-Q9 | 798.6/200.08 | 815.6/200.08 |
| 13C6-Q9 | 801.6/203.08 | 818.6/203.08 |
| Q10 | 863.6/197.08 | 880.6/197.08 |
| D3-Q10 | 866.6/200.08 | 883.6/200.08 |
| 13C6-Q10 | 869.6/203.08 | 886.6/203.08 |
| Dipropoxy-Q10 | 919.7/253.1 | 936.7/253.1 |
2. 9. Polyacrylamide gel electrophoresis and Western blot immunodetection
The procedure was performed as described by Ariza et al. [21] with samples of whole cell extracts (50 μg of protein) applied per gel lane. The following primary antibodies were used: Anti-Sirt3 (Santa Cruz Biotechnology, Inc) at 1:1000 dilution, anti-acetyl lysine (Cell Signaling) at 1:1000 dilution, and anti-Coq2 [25] at 1:1000 dilution. In all cases, horseradish peroxidase-conjugated secondary antibodies were used to reveal immunoreactivity by enhanced chemiluminescence. An anti-rabbit secondary antibody (at 1:2,000 dilution, Santa Cruz Biotechnology, Inc) was used for Sirt3 and acetyl lysine, while an anti-chicken secondary antibody (at 1:5,000 dilution, Sigma-Aldrich) was used for Coq2.
2. 10. Statistical analyses
Statistical analyses were performed using GraphPad Prism 5.03 (GraphPad Software Inc., San Diego, CA, USA). All the data shown are mean ± standard error (SEM) from at least five replicates. Normality of data was checked by Kolmogorov-Smirnov test with the Dallal-Wilkinson-Lilliefor corrected p value. Means were compared using either the parametric two-tail Student’s t-test or non-parametric Mann-Whitney test depending on the results of the normality test. Significant differences were referred as *p<0.05, **p<0.01 and ***p<0.001.
3. Results
3. 1. Kaempferol increases Q in cultured kidney cells
We determined the effect of several polyphenols on Q content and biosynthesis. Each compound used in this study was first added to cells at concentrations ranging from 5 nM to 100 μM over a period of 48 h, and tested with the MTT assay to determine effects on cellular viability (see Supplementary Figure S1). Based on these data, we chose to test phenolic compounds at concentrations ranging from 5 nM to 10 μM to detect possible effects on Q content. Within this range, none of the polyphenols under study decreased viability significantly, and only a small increase in viability was observed at 1μM piceatannol.
Next, we tested how two stilbenoids (resveratrol and piceatannol) and two flavonols (quercetin and kaempferol) affected Q levels in Tkpts cells. As shown in Figure 1A, resveratrol produced a slight increase of Q9 and Q10 levels at most concentrations above 50 nM, whereas the other stilbenoid tested, piceatannol, and the flavonol quercetin had no effect on Q levels (either Q9 or Q10) at any of the concentrations tested. In contrast, kaempferol produced a dramatic increase of both Q9 and Q10 at 100 nM and higher concentrations, producing a plateau at concentrations between 500 nM and 10 μM (Figure 1B). We also confirmed a substantial increase of Q9 and Q10 levels in Tkpts cells treated with kaempferol at concentrations above 100 nM when specific values were calculated on a protein basis (Supplementary Figure S2).
Figure 1. Kaempferol strongly increases Q levels in Tkpts cells.

Q9 and Q10 levels were determined in Tkpts cells treated with different polyphenols at the given concentrations for 48 h. After the incubation period, lipids were extracted and Q levels quantified. (A) Stilbenoids. Resveratrol, but not piceatannol, produced a modest increase of Q9 and Q10 levels. (B) Flavonols. Quercetin did not affect Q levels, but kaempferol produced a dramatic increase of both Q9 and Q10. (C–D) Flavones and a flavanone. Apigenin, but not luteolin or naringenin, slightly increased Q9 and Q10 levels. (E) Basic chemical skeleton of flavonoids. Statistically significant differences between control and treatments are represented by *p<0.05, **p<0.01 and ***p<0.001.
Given the differential effects of kaempferol and quercetin (which differ only in one hydroxyl group), we hypothesized that the chemical structure of the flavonoids could influence their effect on Q content (see chemical structures of the compounds used in Supplementary Figure S1 and the basic chemical skeleton of flavonoids in Figure 1E). Thus, we tested how additional polyphenols of the flavonoid group affected Q levels in Tkpts cells. For these experiments, we chose two flavones: apigenin, luteolin (Figure 1C), and one flavanone: naringenin (Figure 1D). Among these three flavonoids, only apigenin produced a slight increase in Q at concentrations between 500 nM and 10 μM, although a concentration of 50 nM was found inhibitory and statistically significant differences were observed for Q9 but not for the Q10 isoform (Figure 1C).
The following experiments, aimed to elucidate how flavonoids function to increase Q levels, were focused on kaempferol, as this polyphenol was by far the most efficient in augmenting the amounts of cellular Q.
3. 2. Kaempferol activation of the mitochondrial sirtuin Sirt3 is unrelated with the increased Q levels
Kaempferol has been reported to up-regulate Sirt3 [26, 27], a mitochondrial sirtuin that plays an important role in regulating cellular processes like homeostasis, oxidative stress and aging [28]. Up-regulation of mitochondrial Sirt3 optimizes redox processes linked to the electron transport chain and boosts antioxidant defense in this organelle by activating ROS-scavenging systems [29]. Thus, it seemed possible that Sirt3-mediated changes might affect Q levels by providing an antioxidant environment that would diminish oxidative Q degradation. To investigate this, Tkpts cells were treated with kaempferol and the up-regulation of mitochondrial Sirt3 was then assessed. As depicted in Supplementary figure S3A, treatment of Tkpts cells with kaempferol increased significantly the levels of the mitochondrially-targeted (cleaved) form of Sirt3 at concentrations that also increased Q9 and Q10 levels. We next proceeded to verify whether this up-regulation of Sirt3 mediated the increase in Q levels or, on the contrary, it was an independent event. To this purpose, we tested whether simultaneous treatment with NAM, a well-known inhibitor of sirtuin deacetylase activity [27], impacted Q levels in Tkpts cells treated with kaempferol. As shown in Figure 2A, treatment with 10 mM NAM did not alter basal levels of Q in Tkpts cells, and the kaempferol-mediated increase of Q9 and Q10 was completely unaffected by NAM. A western-blot using an anti-acetyl lysine antibody confirmed that, under our experimental conditions, deacetylase activity was significantly inhibited by 10 mM NAM since this treatment produced a substantial increase of protein acetylation (Supplementary figure S3B). Furthermore, we also determined Q levels in several tissues obtained from Sirt3 knockout mice. In each tissue examined, including muscle, liver, kidney, and brain, Q levels from Sirt3 knockout mice were not significantly different from their background-matched controls (Figure 2B). Thus, although similar concentrations of kaempferol can indeed up-regulate Sirt3-dependent mitochondrial functions and increase amounts of Q, the increase in Q content does not appear to be related to the upregulation of Sirt3 activity.
Figure 2. The mitochondrial sirtuin Sirt3 does not participate in the regulation of Q levels.

(A) General inhibition of sirtuin deacetylases by nicotinamide (NAM) at 10 mM did not prevent the increase of Q levels in Tkpts cells treated kaempferol (K) at 10 μM. (B) Q levels are not altered in tissues (skeletal muscle, liver, kidney and brain) obtained from Sirt3 knockout mice in comparison with age-matched controls. Asterisks denote statistically significant differences (***p<0.001).
3. 3. Kaempferol activates endogenous Q biosynthesis by acting as a ring precursor in mouse and human kidney cells
We considered the possibility that the increase of Q levels caused by kaempferol could be a consequence of a higher Q biosynthetic rate. To test this possibility, we followed two different approaches. First, we studied how PABA, a well-characterized inhibitor of Coq2 activity in animal cells [30, 31], affected Q levels in control and in Tkpts cells that had been treated simultaneously with kaempferol. As expected, PABA decreased Q levels in the control cells. Moreover, PABA abolished the increase of Q in response to kaempferol treatment, indicating a direct link between kaempferol and Q biosynthesis (Figure 3A).
Figure 3. Kaempferol augmentation of Q levels is related to the enhancement of Q biosynthesis.

(A) Inhibition of the Coq2 polyprenyltransferase with PABA decreased Q levels in control Tkpts cells and abolished the increase of Q9 and Q10 in cells treated with kaempferol (K). Cells were cultured for 48 h in the presence of kaempferol at 10 μM and/or PABA at 1 mM. Lipids were then extracted for quantification of Q by HPLC. (B) Competition assay of 14C-4HB incorporation into Q. Treatment of cells with 10 μM kaempferol (K) inhibited the incorporation of 14C-4HB into Q, which indicates competition of kaempferol and 4HB as Q ring precursors. (C) Demonstration of the role played by kaempferol as a Q ring precursor in Tkpts cells. Cells were cultured for 48 h in the presence of unlabeled (K) or 13C-labeled kaempferol (13C-K) at 10 μM. Unlabeled (12C, open bars) and 13C6-labeled (closed bars) Q were then measured with HPLC-MS/MS. The majority of Q measured in cells treated with 13C-kaempferol was 13C6-Q, demonstrating a role for kaempferol as a novel Q ring precursor. Asterisks denote statistically significant differences (***p<0.001).
Secondly, we measured Q biosynthesis with an assay based on the incorporation of exogenous 14C-labeled 4HB as Q ring precursor. Our results showed that kaempferol produced a substantial decrease in the incorporation of 14C-4HB (Figure 3B). The simultaneous increase of Q levels and decrease of 14C-4HB incorporation into Q by kaempferol, implies that this compound competes with the substrate 4HB to behave as a ring precursor for Q biosynthesis. To confirm this possibility, we cultured Tkpts cells in the presence of 13C-labeled kaempferol and then measured the levels of 12C-Q and 13C6-Q with HPLC-MS-MS. This technique allows the simultaneous measurement of the amount of cellular Q derived from endogenous 4HB (12C-Q) and the amount of newly synthesized Q derived from 13C-kaempferol (13C6-Q). Total levels of Q obtained in the presence of 13C-kaempferol were also compared with those obtained when cells were grown in the presence of the non-labeled polyphenol. We found that Q9 and Q10 levels increased equally with both non-labeled and 13C-kaempferol. Of note, when the 13C-labeled precursor was used, nearly all the Q present in Tkpts cells was 13C6-Q, identifying kaempferol as an efficient novel Q ring precursor (Figure 3C). Similar experiments were carried out to test the effects of kaempferol in human HEK 293 cells, another kidney cell line and, as observed for Tkpts cells, Q levels were also increased by kaempferol treatment. Furthermore, when 13C-kaempferol was used, almost all the Q present in HEK 293 cells was 13C6-Q (Supplementary Figure S4A). In sum, our results demonstrate a role for kaempferol as a Q ring precursor both in murine and human kidney cell lines.
Colonic microflora metabolize kaempferol to 4-hydroxyphenylacetic acid (4HPAA) and 4-methyphenol (or p-cresol) [32, 33]. Moreover, Serra et al. [34] have detected 4HB derived from the metabolic pathway of kaempferol in rat microflora, possibly as a result of further 4HPAA processing. To investigate if kidney cells could directly transform kaempferol in a similar way, we tested whether 4HPAA or p-cresol could serve as Q ring precursors. A MTT assay ruled out any toxicity of these compounds in concentrations ranging from 5 nM to 100 μM (data not shown). Thus, we used both 4HPAA and p-cresol at a similar concentration as that used in our previous experiments with kaempferol (10 μM). Our results showed that neither 4HPAA nor p-cresol increased Q levels, and they were also unable to compete with 14C-4HB in a Q biosynthesis competition assay (Supplementary Figure S5). Together, these results argue against 4HPAA and p-cresol as metabolites mediating the effect of kaempferol on Q biosynthesis in kidney cells.
3. 4. Role of other phenolic compounds as Q ring precursors
To further study the ability of other dietary phenolic substances to act as precursors in Q biosynthesis we tested curcumin and ferulic acid, which have a quite different structure in comparison with the stilbenoids and flavonoids we already tested. We also analyzed vanillin, a simpler molecule that shares the same ring structure as curcumin, and ferulic acid (see Supplementary Figure S1). Vanillic acid, which also bears hydroxyl and methoxy groups in the same position of the ring, has been previously described as a Q ring precursor in mammals [35]. As shown in Figure 4A, total Q9 levels were decreased when Tkpts cells were treated with both unlabeled or 13C12-labeled curcumin, with no 13C6-Q being detected in the latter case. The same trend was observed for Q10 levels, although a statistically significant decrease was observed only in the case of 13C12-labeled curcumin. Similar results were obtained using D6-curcumin in Tkpts cells (data not shown). Vanillin also produced a decrease of Q9 levels, and the same trend was observed for Q10 although without statistical significance. Strikingly, even when total Q levels were decreased, we were able to detect a signal for 13C6-Q9 although not for 13C6-Q10 in lipid extracts obtained from cells cultured in the presence of 13C6-vanillin (Figure 4A). However, the proportion of 13C6-Q9 present in cells treated with 13C6-vanillin was only about 2%, which is much lower than that produced by 13C-kaempferol (see Figure 3C). Ferulic acid did not produce any significant change of total Q levels, and deuterated forms of Q9 or Q10 only accounted for a minor portion of total Q after treatment of Tkpts cells with D3-ferulic acid (Figure 4B).
Figure 4. Effect of curcumin, ferulic acid and vanillin on Q biosynthesis in Tkpts cells.

(A) Q levels were slightly decreased in Tkpts cells treated with curcumin and vanillin. A small amount of 13C6-Q was detected when Tkpts cells were treated with 13C6-vanillin, but not when treated with 13C12-curcumin, indicating that curcumin does not act as a Q ring precursor. (B) Ferulic acid did not alter Q levels and no deuterated signal was recovered after the treatment with D3-ferulic acid, indicating that ferulic acid does not serve as a Q ring precursor. Statistically significant differences in total Q9 or Q10 between control and treatments are represented by *p<0.05, **p<0.01 and ***p<0.001.
Treatments were also carried out in human HEK 293 cells and, in this case, we found that both curcumin and vanillin increased Q levels. We were unable to detect any 13C6-Q10 in cells cultured for 48 h in the presence of 13C12-labeled curcumin (Supplementary Figure S4B), which indicated that the increase of Q levels is not related to augmented Q biosynthesis. Total amounts of Q were also increased in HEK 293 cells cultured in the presence of 13C6-labeled vanillin, but 13C6-Q10 was only about 1% of total Q (Supplementary Figure S4B), making it unlikely that augmented Q biosynthesis plays a prominent role for the increase of Q levels observed in this cell type. Treatment with ferulic acid did not alter Q levels and the deuterated form of Q10 (D3-Q10) was not detected. In summary, we demonstrate that neither curcumin nor ferulic acid serve as ring precursor for the Q biosynthetic pathway in mouse or human kidney cells, whereas vanillin plays only a minor role in comparison with kaempferol or with the endogenous substrate 4HB.
3. 5. 4HB availability is a limiting step for Q biosynthesis in kidney cells
The efficient utilization of kaempferol by kidney cells as a Q ring precursor could be linked to a limited availability of endogenous ring precursors in these cells. In accordance, Pierrel et al. [7] described that availability of the ring precursor (4HB or PABA) was a rate-limiting step for the biosynthesis of Q6 in yeasts cultured in PABA-free medium. To test whether the effect of kaempferol-mediated increase in Q levels in mammalian cells resulted from limiting amounts of endogenous ring precursors, we measured Q levels in cells that had been treated with exogenous 4HB. For these determinations, we compared the response of the two kidney-derived cell types (mouse Tkpts and human HEK 293) with that of non-kidney cell lines, including mouse liver hepatoma Hepa 1.6, MEFs, human liver hepatoma Hep G2, and human promyelocytic leukemia HL-60 cells. As depicted in Figure 5, Q levels were dramatically increased in the two kidney-derived cell lines when cultured in the presence of 4HB, and attained levels four- to six-fold higher as compared to the corresponding no addition control. HEK 293 cells were particularly sensitive to supplementation of culture medium with 4HB, with a close to maximal response being already achieved at concentrations as low as 5 nM 4HB. In the mouse Hepa 1.6 cell line, Q levels were increased two-fold by 4HB concentrations between 5 nM and 1 μM but, strikingly, this response was lost at concentration of 10 μM and higher. In the case of MEFs, a slight increase was obtained for the Q9 isoform at concentrations of 4HB between 50 nM and 1 μM, but no significant changes were observed for Q10. Except for a slight increase of Q10 levels at 50 nM 4HB in Hep G2 cells, no further alteration of Q levels by exogenous 4HB supplementation was observed in this cell line or in HL-60 cells at any concentration.
Figure 5. 4HB is a limiting step in the biosynthesis of Q in kidney cells.
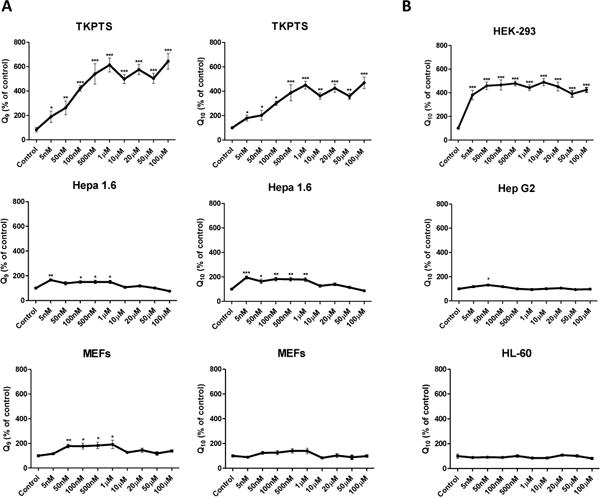
(A) Different types of murine cells were treated with increasing concentrations of 4HB. Tpkts cells exhibited a dramatic increase in Q9 and Q10 levels. However, only a slight increase at some concentrations of 4HB was observed for Hepa 1.6 and MEFs. (B) Similar experiments were performed in human cell lines. Human kidney-derived cells (HEK 293) displayed a significant increase of Q10 levels, but this effect was not found in human lines from another origin, such as Hep G2 or HL-60. The dramatic increase of Q levels in Tkpts and HEK 293 supports that availability of 4HB is a limiting step for the Q biosynthetic pathway in kidney cells. Statistically significant differences in total Q9 or Q10 between control and treatments are represented by *p<0.05, **p<0.01 and ***p<0.001.
Taken together, these results indicate that availability of endogenous 4HB is a limiting step for Q biosynthesis in kidney cells, and that incorporation of exogenously applied ring precursors, such as kaempferol is favored. This could be due to a rapid flow of metabolites towards Q biosynthesis, which maintains very low levels of upstream substrates such as endogenous 4HB in kidney cells. This interpretation was further supported by the comparison of Q levels in Tkpts and Hepa 1.6 cells, the former containing much higher amounts of Q, particularly Q10 (Figure 6A), and of the polyprenyltransferase Coq2, the enzyme that catalyzes the condensation reaction between ring and hydrophobic tail precursors, which was found also significantly enriched in Tkpts in comparison with Hepa 1.6 cells (Figure 6B). This situation resembles that of kidney and liver tissues in the mouse [25].
Figure 6. Kidney-derived Tkpts cells display increased levels of Q and Coq2 in comparison with hepatic Hepa1.6 cells.

(A) Q levels and Q9/Q10 ratio. Q levels were higher and Q9/Q10 ratio lower in Tkpts than in Hepa 1.6 cells. (B) Coq2 prenyltransferase levels. Arbitrary units depicted in the graph relate directly to the immunoblots shown underneath, which derive from the same film. Statistically significant differences between both cell types are represented by **p<0.01 and ***p<0.001.
3. 6. Kaempferol is not utilized as a Q ring precursor by yeast cells as efficiently as 4HB
Since yeast utilize several ring precursors alternative to 4HB for Q biosynthesis, such as PABA [6, 7], p-coumarate and resveratrol [9], we investigated whether kaempferol might also serve as a biosynthetic Q precursor in S. cerevisiae. In this study, we also investigated the effects of ferulic acid, vanillin, and curcumin, which had not been tested previously as putative Q biosynthetic ring precursors. As stated above, all of these compounds share the same ring structure as vanillic acid. Results obtained with these compounds were compared with those obtained with the endogenous substrate 4HB. Importantly, for these experiments yeast cells were cultured in minus PABA medium, since the presence of PABA in the medium could mask a role for the phenolics as putative Q biosynthetic precursors [6, 7]. Yeast cells were grown for 3 h in the presence of each compound at 10 μM concentration, and lipids were extracted for Q6 quantification. As depicted in Figure 7A, no significant differences could be observed in the Q6 levels between cells treated with the unlabeled compounds compared to the control cells.
Figure 7. Kaempferol, ferulic acid, vanillin and curcumin are not utilized as Q ring precursors as efficiently as 4HB in yeast.

(A) Effect of kaempferol, ferulic acid, vanillin and curcumin on Q6 levels. BY4741 yeast cells were treated with these compounds at 10 μM concentrations each, or with EtOH to establish the vehicle control. Yeast were subsequently grown for 3 h in PABA-minus folate-minus medium. (B) Effect of 13C-ring-labeled compounds on de novo Q6 biosynthesis. BY4741 yeast cells were treated with 13C6-4HB, 13C-kaempferol, 13C6-vanilin, 13C12-curcumin, or with EtOH to establish the vehicle control. Significant differences refer to the control condition and are represented by *p<0.05.
We next cultured yeast cells in the presence of 13C-labeled kaempferol to test whether kaempferol might still serve as a ring precursor of Q6 in yeast. Although13C6-Q6 was detected, it comprised only two to four percent of the total Q content (Figure 7B). In contrast, 13C6-4HB was readily incorporated into 13C6-Q6, and also significantly enhanced the total Q content (Figure 7B) indicating that, compared to kaempferol, yeast can utilize 4HB as a Q ring precursor with a substantially higher efficacy. As we previously observed in kidney cells, despite the decrease of Q6 levels produced by vanillin, some 13C6-labeled Q6 could be detected when yeast cells were grown in the presence of 13C6-labeled vanillin. Finally, as also found previously for kidney cells, no 13C6-labeled Q6 was detected when yeast cells were cultured in the presence of 13C12-curcumin, suggesting this compound does not serve as a Q ring precursor.
4. Discussion
Polyphenols, which are widely present in foods and beverages of plant origin, have received great interest during the last years due to their positive effects on human health. Several studies have strongly supported a role for polyphenols in the prevention of important diseases such as cancer, cardiovascular disease, chronic inflammation and neurodegenerative disease [36]. The beneficial properties of polyphenols have been partially attributed to a role as antioxidants as well as to their ability to modulate molecular targets and signaling pathways. Their antioxidant capacity is widely linked to their ability to reduce free radical formation and to scavenge free radicals, but other mechanisms of action serving to elevate endogenous antioxidants are also important. For example, polyphenols can induce antioxidant enzymes such as glutathione peroxidase, catalase and superoxide dismutase and inhibit the expression of enzymes such as xanthine oxidase [37]. Another important factor is the molecular structure of these compounds, which can modulate their properties and functions. Of note, the 3-hydroxyl group in flavonols is considered especially important for their antioxidant activities [38].
As a lipid-soluble antioxidant that can be endogenously synthesized by all organisms, Q plays a major role in antioxidant defense [30]. Resveratrol and p-coumarate have been described as Q ring precursors in E. coli, S. cerevisiae and human cells, but the possibility that polyphenols could actually increase the levels of this lipid antioxidant in cells has not been explored. A capacity to increase endogenous Q levels could be a very important finding to palliate Q deficiencies associated with aging or disease. Kidney cells are especially sensitive to a decrease of Q levels, and a nephrotic syndrome is a major clinical phenotype in Q deficiencies [39]. For this reason, we selected two kidney-derived lines, murine Tkpts and human HEK 293 cells, to study the capacity of different polyphenols to increase Q levels.
Two stilbenes, (resveratrol and piceatannol), and two flavonols, (quercetin and kaempferol), were selected in the first phase of our studies. Resveratrol has been the subject of intense research due to its purported cardiovascular protective, antiplatelet, antioxidant, anti-inflammatory, blood-glucose-lowering and anti-cancer activities (reviewed in [40]). Piceatannol is a hydroxylated analogue of resveratrol and shares the structural motif and biological activities, being even more potent in some studies [41]. Apart from the beneficial effects of stilbenes, the regular consumption of flavonoids is related to reduced risk of a number of chronic diseases, including cancer, cardiovascular disease and neurodegenerative disorders (reviewed in [42]). Flavonoids are divided into several groups, with flavonols being those containing the 3-hydroxy group, which has been considered very important for antioxidant activity. For our determinations, we chose quercetin and kaempferol, the two most common compounds in this group. Among these four compounds, only kaempferol efficiently increased Q levels in kidney cells and, interestingly, the effects were observed at concentrations that can be attainable physiologically both by consumption of flavonoids-containing food and by oral supplementation [15, 43, 44]. Since this ability may derive from its chemical structure, we also tested additional structurally related flavonoids. We chose two flavones, apigenin and luteolin, and one flavanone, naringenin. Of these, only apigenin caused a slight increase in Q9 and Q10 at select concentrations, although its effects were extremely limited in comparison with kaempferol and a slight inhibition was also observed for one of the concentrations tested.
The increase in Q levels by kaempferol in kidney cells depends directly on the stimulation of Q biosynthesis. The kaempferol-mediated increase in Q was blocked by the Q biosynthesis inhibitor PABA; conversely addition of kaempferol competed with incorporation of 14C-4HB into 14C-labeled Q. Cells treated with 13C-kaempferol generated newly synthesized 13C6-Q, and demonstrated that kaempferol behaves as a novel Q ring precursor in mammalian cells. The metabolism of kaempferol responsible for its incorporation into the Q biosynthetic pathway remains to be established, although two possibilities can be proposed: (1) kaempferol could act directly as a Q precursor being itself a substrate for the Coq2 transferase and would be subsequently metabolized and modified by different Coq proteins until it reaches the final structure of Q; or alternatively (2) kaempferol could be cleaved in the cell to yield potential ring precursors which would be then integrated into this pathway. Indeed, previous studies have shown that flavonoids can be transformed by colonic microflora into phenolic acids. However, the type of metabolic products depends on what phenolic compound is metabolized and its specific structure [34]. Cleavage of kaempferol by colonic microflora occurs between C-3 and C-4 carbons of ring C, forming 4HPAA [32, 33] derived from the B ring, 4HPAA is then rapidly decarboxylated to form p-cresol [45]. If kidney cells were able to perform a biochemical transformation of kaempferol similar to that described for colonic microflora, this would provide an efficient source of Q precursors. However, neither 4HPAA nor p-cresol increased Q levels nor competed with 14C-4HB, demonstrating that these compounds do not act as Q ring precursors. Therefore, even if kaempferol is cleaved in renal cells before entering the Q biosynthetic pathway, these known metabolites are not involved in augmenting Q levels.
Whatever the metabolic route involved, an increase of alternative Q ring precursors in cells will only result in higher Q levels if cells have low availability of endogenous 4HB. Pierrel et al. [7] described 4HB as a limiting step in the biosynthesis of Q in S. cerevisiae cells and, as we have demonstrated here, this also holds true for kidney cells, although not for other cell lines such as MEFs, Hep G2 and HL-60. The increase of Q observed after a treatment with nanomolar concentrations of 4HB or kaempferol confirms that the availability of endogenous ring precursors is very low in kidney cells of both mouse and human origin. The fact that many cell types do not show increased Q levels in response to exogenous 4HB is in agreement with the early demonstration that 4HB may be present at saturating concentrations in liver, as determined by in vitro assays with liver tissue slices [46]. Tissue-specificity regarding the effect of supplementation with ring precursors on Q biosynthesis is further supported by the observations of Wang et al. [47], who demonstrated that adding the ring precursor 2,4-dihydroxybenzoic acid (2,4-DHB) to the drinking water of Q-deficient Mclk1 KO mice resulted in a healthier phenotype, an increase in Q levels and an improvement of the mitochondrial respiratory capacity in heart, kidney and skeletal muscle, although no statistically significant differences were observed in small intestine. Moreover, when 2,4-DHB was given to wild-type mice an increase of Q9 levels was still detected in kidney mitochondria, but no increase was observed in mitochondria isolated from heart, liver, skeletal muscle or intestine, which agrees with the idea that, even under normal (non deficient) conditions, availability of Q ring precursors is a limiting step in kidney.
In a previous report [25], we demonstrated maximal levels of Coq2 polypeptide in those organs displaying the highest Q concentrations, such as kidney and heart. In accordance, the murine kidney-derived Tkpts cells also showed significantly higher levels of both Q and Coq2 polypeptide than murine hepatic Hepa 1.6 cells. Higher levels of the Coq2 transferase might maintain low cellular concentrations of the ring precursor 4-HB due to its rapid use via the Coq2 prenyltransferase activity. Higher Coq2 levels could also account for making these cells particularly responsive to ring precursors as 4HB or kaempferol, leading to a significant increase of Q levels upon supplementation. Further experiments will be needed to fully understand how kaempferol is metabolized to take part directly in the biosynthesis of Q.
Experiments carried out with S. cerevisiae demonstrated that kaempferol is not effective in increasing Q6 levels or acting as a Q ring precursor in this eukaryotic cell model, even when ring precursors are limiting the biosynthesis of Q. Previous studies indicate that yeast cultured under PABA limiting conditions show increased Q6 content when supplemented with either 4HB or PABA (6). The lack of an effect of kaempferol indicates that yeast cannot utilize flavonoids in the same manner as mammalian cells.
The non-flavonoid compound curcumin, which contains two ferulic acid moieties linked via a methylene bridge at the carbonyl group C atoms, undergoes metabolism in animals, possesses antioxidant capacity and produces beneficial effects on diabetes, inflammation and neurodegenerative disease by modulating multiple signal molecules (transcription factors, enzymes, etc.) and controlling gene expression [48]. Structure of curcumin and ferulic acid differs substantially from that of flavonoids and stilbenoids, so testing their effect on Q system was of considerable interest. However, our data indicate that neither curcumin nor ferulic acid increase Q levels, and only ferulic produced a small but detectable signal of D3-labeled Q in kidney cells. Similar results were obtained in yeast cells. Chemical structure is a key factor that define the functions and the effect of the different polyphenols. In our study, flavonoids were more efficient used in Q biosynthesis than other non-flavonoid compounds like stilbenoids and curcuminoids. Moreover, one member of the flanovol group (kaempferol) and one member from the flavone group (apigenin) were the ones that displayed the strongest effect increasing Q9 and Q10 levels in renal cells.
The difference between flavonols and flavones is distinguished by the presence of a hydroxyl group in the C3 position. This group seems to be critical because kaempferol (that possesses this group) is much more efficient in increasing Q levels than apigenin and, interestingly, this specific OH group has been linked to an increase of antioxidant activity [38]. However, kaempferol and apigenin have a common characteristic that also seems to be an important determinant for their effect on Q biosynthesis: both compounds possess one hydroxyl group in the B ring. The presence of two hydroxyl groups in this ring, as is the case for quercetin and luteolin, abolishes the effect of these flavonoids on Q biosynthesis. One study that compared the anxiolytic effect of different flavonols noted that this activity decreased with an increasing number of hydroxyl groups in the B ring: kaempferol revealed again the strongest effect, whereas myricetin (which possesses three hydroxyl groups) did not have any effect [49].
In addition, kaempferol has been previously described as a Sirt3 activator. This mitochondrial sirtuin mediates the adaptation of increased energy demand during adverse conditions to increase the production of energy equivalents, and also deacetylates and activates mitochondrial enzymes involved in fatty acid β-oxidation, amino acid metabolism, the electron transport chain, and antioxidant defense [28]. Our results have shown that mitochondrial levels of Sirt3 were indeed increased after kaempferol treatment, confirming these effects also take place in renal cells. However, treatment of kidney cells with NAM, a general inhibitor of sirtuin activity, did not affect the kaempferol-induced increase of Q levels, indicating that Sirt3 activation does not mediate kaempferol effects on Q biosynthesis. Furthermore, Q levels measured in different tissues obtained from Sirt3 knockout mice did not differ from those measured in their wild-type littermates, indicating that Sirt3 does not modulate Q biosynthesis.
Further experimentation is warranted to elucidate whether dietary kaempferol supplementation also increases Q levels in animals, both under normal and Q-deficient conditions. Extensive metabolism of kaempferol when administered with the diet results in very low levels of circulating kaempferol in mice [50], which could hamper potential beneficial effects on Q biosynthesis. However, given the specific response of kidney to small amounts of ring precursors, it is still possible that dietary kaempferol could lead to increased Q levels in this organ, as previously observed for 2,4-DHB [47]. Increasing the availability of Q precursors in cells could move the metabolic flux in favor of the synthesis of Q, helping to ameliorate the phenotype associated with certain Q deficiencies, at least for some organs such as kidney.
In conclusion, we demonstrate that some components of a healthy diet can influence the levels of Q in renal cells. The flavonol kaempferol is identified here as having the strongest effect on increased Q levels due to its action as a novel ring precursor in Q biosynthesis. The ability of kaempferol to simultaneously increase Q and Sirt3 levels, link several of the beneficial effects previously described for this molecule. Further experiments, both in vitro and in vivo, will be needed to elucidate the exact metabolic pathway by which kaempferol participates in Q biosynthesis, as well as to test its potential beneficial effects in vivo.
Supplementary Material
An assay of viability was performed for each phenolic compound with the MTT assay. The resulting values of A590nm were used to select a concentration range that did not affect cell viability, and was then used for subsequent experiments to determine Q content.
Treatments were carried out as described in Figure 1. Values of Q levels were referred to protein (Bradford assay) to obtain specific values. The figure depicts the percentage of change in specific levels of Q compared to the untreated control. Statistically significant differences between control and treatments are represented by *p<0.05 and ***p<0.001.
Supplementary figure S3.- (A) Kaempferol increases mitochondrial Sirt3. A western-blot against Sirt3 shows that the mitochondrial form of Sirt3 is upregulated by kaempferol (*p<0.05) at 10 μM. Arbitrary units depicted in the graph relate directly to the immunoblots shown underneath, and the immunoblots derive from the same film. (B) Nicotinamide inhibits deacetylase activity in Tkpts cells. Anti-acetyl lysine antibody was used to confirm the inhibitory effect of nicotinamide (NAM). As expected, acetylation levels were significantly increased in presence of nicotinamide (***p<0.01). In (A) and (B), Ponceau S staining was used to correct for minor differences in protein loading between samples.
(A) Kaempferol is confirmed as a Q ring precursor (***p<0.01) and increased Q levels (***p<0.01) in human HEK 293 cells. (B) 13C6-Q10 is not detected when HEK 293 cells were treated with 13C12-labeled curcumin, demonstrating that curcumin does not act as Q ring precursor. (C) Ferulic acid does not serve as Q ring precursor because no deuterated signal is recovered after treatment of HEK 293 cells with D3-ferulic acid.
(A) Q levels are not increased in Tkpts cells incubated with 4HPAA or p-cresol. (B) A radiolabeled Q biosynthesis assay with 14C-4HB shows that neither 4HPAA nor p-cresol compete with 14C-4HB as Q precursors. Together, these results indicate these compounds do not serve as potential aromatic ring precursors of Q biosynthesis in Tkpts cells.
Highlights.
Kaempferol strongly increases coenzyme Q levels in kidney cells, whereas other phenolics such as resveratrol or apigenin are much less active.
Increase of coenzyme Q by kaempferol is not related to the upregulation of sirtuin activity but is due to a novel role of this phenolic as a biosynthetic ring precursor which competes with endogenous 4-hydroxybenzoate.
Limited availability of endogenous biosynthetic ring precursors is a feature of renal cells that determines enhanced sensitivity to supplementation with exogenous precursor substances, in comparison with cells of different origins.
The yeast Saccharomyces cerevisiae is unable to use efficiently kaempferol in coenzyme Q biosynthesis.
Acknowledgments
Supported by the Spanish Ministerio de Economía y Competitividad Grants (BFU2011-23578 and BFU2015-64630-R) cofinanced with EU FEDER funds, Junta de Andalucía (CVI-276) and Universidad de Córdoba. LFR and EGC were supported by FPU fellowships from the Spanish Ministerio de Educación, Cultura y Deporte and CVI-276. C.S. and A.I.J. were supported by award AT006896 from NCCIH of the NIH to C.S., O.K. was supported by GM071779 from NIGMS of the NIH, and A.N. and A.A. were supported by a grant from the National Science Foundation (MCB-1330803) to C.F.C. Dr. Elsa Bello-Reuss and Dr. Judit Magyesi (University Medical Center, Lubbock, TX, USA) kindly provided the mouse kidney proximal tubule epithelial (Tkpts) cells. The authors thank the personnel from the Servicio Centralizado de Apoyo a la Investigación (SCAI; Universidad de Córdoba) for technical support.
Abbreviations
- Q
Coenzyme Q
- 2,4-DHB
2,4-dihydroxybenzoic acid
- DOD
drop-outdextrose medium
- FBS
fetal bovine serum
- 4HB
4-Hydroxybenzoic acid
- 4HPAA
4-hydroxyphenylacetic acid
- MEF
mouse embryonic fibroblast
- MTT
3-(4,5-dimethylthiazol-2-yl)-2,5-diphenyltetrazolium bromide
- PABA
nicotinamide, NAM, paminobenzoic acid
- YPD
yeast extract peptone dextrose
- TCA
trichlocoacetic acid
Footnotes
Publisher's Disclaimer: This is a PDF file of an unedited manuscript that has been accepted for publication. As a service to our customers we are providing this early version of the manuscript. The manuscript will undergo copyediting, typesetting, and review of the resulting proof before it is published in its final citable form. Please note that during the production process errors may be discovered which could affect the content, and all legal disclaimers that apply to the journal pertain.
References
- 1.Villalba JM, Parrado C, Santos-Gónzalez M, Alcaín FJ. Therapeutic use of coenzyme Q10 and coenzyme Q10-related compounds and formulations. Expert Opin Invetig Drugs. 2010;19(4):1–20. doi: 10.1517/13543781003727495. [DOI] [PubMed] [Google Scholar]
- 2.Ericsson J, Dallner G. Distribution, biosynthesis, and function of mevalonate pathway lipids. Sub-cellular biochemistry. 1993;21:229–72. doi: 10.1007/978-1-4615-2912-5_11. [DOI] [PubMed] [Google Scholar]
- 3.Desbats MA, Lunardi G, Doimo M, Trevisson E, Salviati L. Genetic bases and clinical manifestations of coenzyme Q10 (CoQ 10) deficiency. Journal of inherited metabolic disease. 2015;38(1):145–56. doi: 10.1007/s10545-014-9749-9. [DOI] [PubMed] [Google Scholar]
- 4.Hayashi K, Ogiyama Y, Yokomi K, Nakagawa T, Kaino T, Kawamukai M. Functional conservation of coenzyme Q biosynthetic genes among yeasts, plants, and humans. PloS one. 2014;9(6):e99038. doi: 10.1371/journal.pone.0099038. [DOI] [PMC free article] [PubMed] [Google Scholar]
- 5.Acosta MJ, Vazquez Fonseca L, Desbats MA, Cerqua C, Zordan R, Trevisson E, Salviati L. Coenzyme Q biosynthesis in health and disease. Biochimica et biophysica acta. 2016;1857(8):1079–1085. doi: 10.1016/j.bbabio.2016.03.036. [DOI] [PubMed] [Google Scholar]
- 6.Marbois B, Xie LX, Choi S, Hirano K, Hyman K, Clarke CF. para-Aminobenzoic acid is a precursor in coenzyme Q6 biosynthesis in Saccharomyces cerevisiae. The Journal of biological chemistry. 2010;285(36):27827–38. doi: 10.1074/jbc.M110.151894. [DOI] [PMC free article] [PubMed] [Google Scholar]
- 7.Pierrel F, Hamelin O, Douki T, Kieffer-Jaquinod S, Muhlenhoff U, Ozeir M, Lill R, Fontecave M. Involvement of mitochondrial ferredoxin and para-aminobenzoic acid in yeast coenzyme Q biosynthesis. Chemistry & biology. 2010;17(5):449–59. doi: 10.1016/j.chembiol.2010.03.014. [DOI] [PubMed] [Google Scholar]
- 8.Block A, Widhalm JR, Fatihi A, Cahoon RE, Wamboldt Y, Elowsky C, Mackenzie SA, Cahoon EB, Chapple C, Dudareva N, Basset GJ. The Origin and Biosynthesis of the Benzenoid Moiety of Ubiquinone (Coenzyme Q) in Arabidopsis. The Plant cell. 2014;26(5):1938–1948. doi: 10.1105/tpc.114.125807. [DOI] [PMC free article] [PubMed] [Google Scholar]
- 9.Xie LX, Williams KJ, He CH, Weng E, Khong S, Rose TE, Kwon O, Bensinger SJ, Marbois BN, Clarke CF. Resveratrol and para-coumarate serve as ring precursors for coenzyme Q biosynthesis. Journal of lipid research. 2015;56(4):909–19. doi: 10.1194/jlr.M057919. [DOI] [PMC free article] [PubMed] [Google Scholar]
- 10.Sohal RS, Forster MJ. Coenzyme Q, oxidative stress and aging. Mitochondrion. 2007;7(Suppl):S103–11. doi: 10.1016/j.mito.2007.03.006. [DOI] [PMC free article] [PubMed] [Google Scholar]
- 11.Ozaltin F. Primary coenzyme Q10 (CoQ 10) deficiencies and related nephropathies. Pediatric nephrology. 2014;29(6):961–9. doi: 10.1007/s00467-013-2482-z. [DOI] [PubMed] [Google Scholar]
- 12.Wang Y, Hekimi S. Understanding Ubiquinone. Trends in cell biology. 2016;26(5):367–78. doi: 10.1016/j.tcb.2015.12.007. [DOI] [PubMed] [Google Scholar]
- 13.Sandoval-Acuna C, Ferreira J, Speisky H. Polyphenols and mitochondria: an update on their increasingly emerging ROS-scavenging independent actions. Arch Biochem Biophys. 2014;559:75–90. doi: 10.1016/j.abb.2014.05.017. [DOI] [PubMed] [Google Scholar]
- 14.Hatia S, Septembre-Malaterre A, Le Sage F, Badiou-Beneteau A, Baret P, Payet B, Lefebvre d’hellencourt C, Gonthier MP. Evaluation of antioxidant properties of major dietary polyphenols and their protective effect on 3T3-L1 preadipocytes and red blood cells exposed to oxidative stress. Free radical research. 2014;48(4):387–401. doi: 10.3109/10715762.2013.879985. [DOI] [PubMed] [Google Scholar]
- 15.Scalbert A, Williamson G. Dietary intake and bioavailability of polyphenols. The Journal of nutrition. 2000;130(8S Suppl):2073s–85s. doi: 10.1093/jn/130.8.2073S. [DOI] [PubMed] [Google Scholar]
- 16.Gordon ON, Graham LA, Schneider C. Facile synthesis of deuterated and [(14) C]labeled analogs of vanillin and curcumin for use as mechanistic and analytical tools. Journal of labelled compounds & radiopharmaceuticals. 2013;56(14):696–9. doi: 10.1002/jlcr.3102. [DOI] [PMC free article] [PubMed] [Google Scholar]
- 17.Edlund PO. Determination of coenzyme Q10, alpha-tocopherol and cholesterol in biological samples by coupled-column liquid chromatography with coulometric and ultraviolet detection. Journal of chromatography. 1988;425(1):87–97. doi: 10.1016/0378-4347(88)80009-4. [DOI] [PubMed] [Google Scholar]
- 18.Ernest S, Bello-Reuss E. Expression and function of P-glycoprotein in a mouse kidney cell line. The American journal of physiology. 1995;269(2 Pt 1):C323–33. doi: 10.1152/ajpcell.1995.269.2.C323. [DOI] [PubMed] [Google Scholar]
- 19.Todaro GJ, Green H. Quantitative studies of the growth of mouse embryo cells in culture and their development into established lines. The Journal of cell biology. 1963;17:299–313. doi: 10.1083/jcb.17.2.299. [DOI] [PMC free article] [PubMed] [Google Scholar]
- 20.Brachmann CB, Davies A, Cost GJ, Caputo E, Li J, Hieter P, Boeke JD. Designer deletion strains derived from Saccharomyces cerevisiae S288C: a useful set of strains and plasmids for PCR-mediated gene disruption and other applications. Yeast (Chichester, England) 1998;14(2):115–32. doi: 10.1002/(SICI)1097-0061(19980130)14:2<115::AID-YEA204>3.0.CO;2-2. [DOI] [PubMed] [Google Scholar]
- 21.Ariza J, Gonzalez-Reyes JA, Jodar L, Diaz-Ruiz A, de Cabo R, Villalba JM. Mitochondrial permeabilization without caspase activation mediates the increase of basal apoptosis in cells lacking Nrf2. Free radical biology & medicine. 2016;95:82–95. doi: 10.1016/j.freeradbiomed.2016.03.015. [DOI] [PMC free article] [PubMed] [Google Scholar]
- 22.Bradford MM. A rapid and sensitive method for the quantitation of microgram quantities of protein utilizing the principle of protein-dye binding. Analytical biochemistry. 1976;72(1–2):248–54. doi: 10.1016/0003-2697(76)90527-3. [DOI] [PubMed] [Google Scholar]
- 23.Clarke CF, Williams W, Teruya JH. Ubiquinone Biosynthesis in Saccharomyces cerevisiae. The Journal of biological chemistry. 1991;266(25):16636–44. [PubMed] [Google Scholar]
- 24.Cordoba-Pedregosa Mdel C, Villalba JM, Alcain FJ. Determination of coenzyme Q biosynthesis in cultured cells without the necessity for lipid extraction. Analytical biochemistry. 2005;336(1):60–3. doi: 10.1016/j.ab.2004.09.031. [DOI] [PubMed] [Google Scholar]
- 25.Parrado-Fernandez C, Lopez-Lluch G, Rodriguez-Bies E, Santa-Cruz S, Navas P, Ramsey JJ, Villalba JM. Calorie restriction modifies ubiquinone and COQ transcript levels in mouse tissues. Free radical biology & medicine. 2011;50(12):1728–36. doi: 10.1016/j.freeradbiomed.2011.03.024. [DOI] [PMC free article] [PubMed] [Google Scholar]
- 26.Marfe G, Tafani M, Indelicato M, Sinibaldi-Salimei P, Reali V, Pucci B, Fini M, Russo MA. Kaempferol induces apoptosis in two different cell lines via Akt inactivation, Bax and SIRT3 activation, and mitochondrial dysfunction. Journal of cellular biochemistry. 2009;106(4):643–50. doi: 10.1002/jcb.22044. [DOI] [PubMed] [Google Scholar]
- 27.Cimen H, Han MJ, Yang Y, Tong Q, Koc H, Koc EC. Regulation of succinate dehydrogenase activity by SIRT3 in mammalian mitochondria. Biochemistry. 2010;49(2):304–11. doi: 10.1021/bi901627u. [DOI] [PMC free article] [PubMed] [Google Scholar]
- 28.Kincaid B, Bossy-Wetzel E. Forever young: SIRT3 a shield against mitochondrial meltdown, aging, and neurodegeneration. Frontiers in aging neuroscience. 2013;5:48. doi: 10.3389/fnagi.2013.00048. [DOI] [PMC free article] [PubMed] [Google Scholar]
- 29.Weir HJ, Lane JD, Balthasar N. SIRT3: A Central Regulator of Mitochondrial Adaptation in Health and Disease. Genes & cancer. 2013;4(3–4):118–24. doi: 10.1177/1947601913476949. [DOI] [PMC free article] [PubMed] [Google Scholar]
- 30.Turunen M, Olsson J, Dallner G. Metabolism and function of coenzyme Q. Biochimica et Biophysica Acta (BBA) - Biomembranes. 2004;1660(1–2):171–199. doi: 10.1016/j.bbamem.2003.11.012. [DOI] [PubMed] [Google Scholar]
- 31.Gonzalez-Aragon D, Buron MI, Lopez-Lluch G, Herman MD, Gomez-Diaz C, Navas P, Villalba JM. Coenzyme Q and the regulation of intracellular steady-state levels of superoxide in HL-60 cells. BioFactors. 2005;25(1–4):31–41. doi: 10.1002/biof.5520250105. [DOI] [PubMed] [Google Scholar]
- 32.Winter J, Moore LH, Dowell VR, Jr, Bokkenheuser VD. C-ring cleavage of flavonoids by human intestinal bacteria. Applied and environmental microbiology. 1989;55(5):1203–8. doi: 10.1128/aem.55.5.1203-1208.1989. [DOI] [PMC free article] [PubMed] [Google Scholar]
- 33.Moradi-Afrapoli F, Oufir M, Walter FR, Deli MA, Smiesko M, Zabela V, Butterweck V, Hamburger M. Validation of UHPLC-MS/MS methods for the determination of kaempferol and its metabolite 4-hydroxyphenyl acetic acid, and application to in vitro blood-brain barrier and intestinal drug permeability studies. Journal of pharmaceutical and biomedical analysis. 2016;128:264–74. doi: 10.1016/j.jpba.2016.05.039. [DOI] [PubMed] [Google Scholar]
- 34.Serra A, Macià A, Romero MP, Reguant J, Ortega N, Motilva MJ. Metabolic pathways of the colonic metabolism of flavonoids (flavonols, flavones and flavanones) and phenolic acids. Food chemistry. 2012;130(2):383–393. [Google Scholar]
- 35.Nambudiri AM, Brockman D, Alam SS, Rudney H. Alternate routes for ubiquinone biosynthesis in rats. Biochemical and biophysical research communications. 1976;76(2):282–8. doi: 10.1016/0006-291x(77)90723-9. [DOI] [PubMed] [Google Scholar]
- 36.Del Rio D, Rodriguez-Mateos A, Spencer JP, Tognolini M, Borges G, Crozier A. Dietary (poly)phenolics in human health: structures, bioavailability, and evidence of protective effects against chronic diseases. Antioxidants & redox signaling. 2013;18(14):1818–92. doi: 10.1089/ars.2012.4581. [DOI] [PMC free article] [PubMed] [Google Scholar]
- 37.Du Y, Guo H, Lou H. Grape seed polyphenols protect cardiac cells from apoptosis via induction of endogenous antioxidant enzymes. Journal of agricultural and food chemistry. 2007;55(5):1695–701. doi: 10.1021/jf063071b. [DOI] [PubMed] [Google Scholar]
- 38.Tsao R. Chemistry and Biochemistry of Dietary Polyphenols. Nutrients. 2010;2(12):1231–1246. doi: 10.3390/nu2121231. [DOI] [PMC free article] [PubMed] [Google Scholar]
- 39.Quinzii CM, Hirano M. Primary and secondary CoQ(10) deficiencies in humans. BioFactors. 2011;37(5):361–5. doi: 10.1002/biof.155. [DOI] [PMC free article] [PubMed] [Google Scholar]
- 40.Kursvietiene L, Staneviciene I, Mongirdiene A, Bernatoniene J. Multiplicity of effects and health benefits of resveratrol. Medicina (Kaunas, Lithuania) 2016;52(3):148–55. doi: 10.1016/j.medici.2016.03.003. [DOI] [PubMed] [Google Scholar]
- 41.Arai D, Kataoka R, Otsuka S, Kawamura M, Maruki-Uchida H, Sai M, Ito T, Nakao Y. Piceatannol is superior to resveratrol in promoting neural stem cell differentiation into astrocytes. Food Funct. 2016;7(10):4432–4441. doi: 10.1039/c6fo00685j. [DOI] [PubMed] [Google Scholar]
- 42.Kozlowska A, Szostak-Wegierek D. Flavonoids–food sources and health benefits. Roczniki Panstwowego Zakladu Higieny. 2014;65(2):79–85. [PubMed] [Google Scholar]
- 43.Manach C, Scalbert A, Morand C, Remesy C, Jimenez L. Polyphenols: food sources and bioavailability. Am J Clin Nutr. 2004;79(5):727–47. doi: 10.1093/ajcn/79.5.727. [DOI] [PubMed] [Google Scholar]
- 44.Calderon-Montano JM, Burgos-Moron E, Perez-Guerrero C, Lopez-Lazaro M. A review on the dietary flavonoid kaempferol. Mini reviews in medicinal chemistry. 2011;11(4):298–344. doi: 10.2174/138955711795305335. [DOI] [PubMed] [Google Scholar]
- 45.Labib S, Hummel S, Richling E, Humpf HU, Schreier P. Use of the pig caecum model to mimic the human intestinal metabolism of hispidulin and related compounds. Molecular nutrition & food research. 2006;50(1):78–86. doi: 10.1002/mnfr.200500144. [DOI] [PubMed] [Google Scholar]
- 46.Ranganathan S, Ramasarma T. The regulation of the biosynthesis of ubiquinone in the rat. The Biochemical journal. 1975;148(1):35–9. doi: 10.1042/bj1480035. [DOI] [PMC free article] [PubMed] [Google Scholar]
- 47.Wang Y, Oxer D, Hekimi S. Mitochondrial function and lifespan of mice with controlled ubiquinone biosynthesis. Nature communications. 2015;6:6393. doi: 10.1038/ncomms7393. [DOI] [PMC free article] [PubMed] [Google Scholar]
- 48.Ghosh S, Banerjee S, Sil PC. The beneficial role of curcumin on inflammation, diabetes and neurodegenerative disease: A recent update. Food and chemical toxicology: an international journal published for the British Industrial Biological Research Association. 2015;83:111–24. doi: 10.1016/j.fct.2015.05.022. [DOI] [PubMed] [Google Scholar]
- 49.Vissiennon C, Nieber K, Kelber O, Butterweck V. Route of administration determines the anxiolytic activity of the flavonols kaempferol, quercetin and myricetin–are they prodrugs? The Journal of nutritional biochemistry. 2012;23(7):733–40. doi: 10.1016/j.jnutbio.2011.03.017. [DOI] [PubMed] [Google Scholar]
- 50.Zabela V, Sampath C, Oufir M, Moradi-Afrapoli F, Butterweck V, Hamburger M. Pharmacokinetics of dietary kaempferol and its metabolite 4-hydroxyphenylacetic acid in rats. Fitoterapia. 2016;115:189–197. doi: 10.1016/j.fitote.2016.10.008. [DOI] [PubMed] [Google Scholar]
Associated Data
This section collects any data citations, data availability statements, or supplementary materials included in this article.
Supplementary Materials
An assay of viability was performed for each phenolic compound with the MTT assay. The resulting values of A590nm were used to select a concentration range that did not affect cell viability, and was then used for subsequent experiments to determine Q content.
Treatments were carried out as described in Figure 1. Values of Q levels were referred to protein (Bradford assay) to obtain specific values. The figure depicts the percentage of change in specific levels of Q compared to the untreated control. Statistically significant differences between control and treatments are represented by *p<0.05 and ***p<0.001.
Supplementary figure S3.- (A) Kaempferol increases mitochondrial Sirt3. A western-blot against Sirt3 shows that the mitochondrial form of Sirt3 is upregulated by kaempferol (*p<0.05) at 10 μM. Arbitrary units depicted in the graph relate directly to the immunoblots shown underneath, and the immunoblots derive from the same film. (B) Nicotinamide inhibits deacetylase activity in Tkpts cells. Anti-acetyl lysine antibody was used to confirm the inhibitory effect of nicotinamide (NAM). As expected, acetylation levels were significantly increased in presence of nicotinamide (***p<0.01). In (A) and (B), Ponceau S staining was used to correct for minor differences in protein loading between samples.
(A) Kaempferol is confirmed as a Q ring precursor (***p<0.01) and increased Q levels (***p<0.01) in human HEK 293 cells. (B) 13C6-Q10 is not detected when HEK 293 cells were treated with 13C12-labeled curcumin, demonstrating that curcumin does not act as Q ring precursor. (C) Ferulic acid does not serve as Q ring precursor because no deuterated signal is recovered after treatment of HEK 293 cells with D3-ferulic acid.
(A) Q levels are not increased in Tkpts cells incubated with 4HPAA or p-cresol. (B) A radiolabeled Q biosynthesis assay with 14C-4HB shows that neither 4HPAA nor p-cresol compete with 14C-4HB as Q precursors. Together, these results indicate these compounds do not serve as potential aromatic ring precursors of Q biosynthesis in Tkpts cells.