Abstract
Background
The aim of this study was to investigate the feasibility of using acoustic radiation force impulse (ARFI) elastography, AST-to-platelet ratio index (APRI), and FIB-4 in assessing liver fibrosis and free portal pressure in patients with hepatitis B.
Material/Methods
We enrolled 126 patients with hepatitis B who underwent liver surgery at the General Surgery Department of the First Affiliated Hospital of Shihezi University Medical School from February 2013 to August 2015. Preoperatively, shear wave velocity (SWV) of the liver was measured with the Siemens S2000 ultrasound system to reflect liver stiffness. Serological markers were collected and fibrosis indices APRI and FIB-4 were calculated. Intraoperatively, liver tissues were harvested and free portal pressure (FPP) was measured. Postoperatively, fibrosis of liver tissues was pathologically staged.
Results
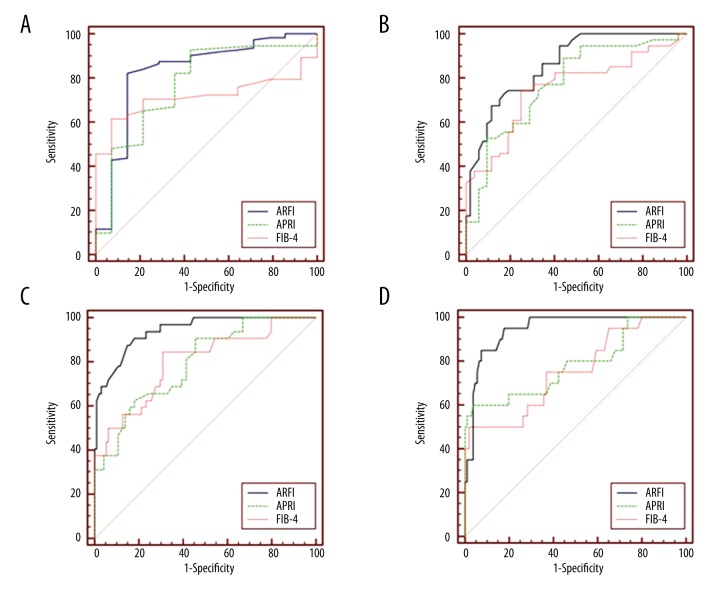
The results of SWV, APRI, FIB-4, and FPP were all correlated with the degree of liver fibrosis (Spearman correlation coefficients: r=0.777, P<0.001; r=0.526, P<0.001; r=0.471, P<0.001; p<0.000; r=0.675, p<0.000). Receiver operating characteristic curve (ROC) analysis showed that the areas under the curve (AUC) of ARFI, APRI, and FIB-4 in diagnosing liver fibrosis were 0.830, 0.768, and 0.717, respectively, for stage F≥1; 0.861, 0.773, and 0.754, respectively, for stage F≥2; 0.941, 0.793, and 0.779, respectively, for stage F≥3; and 0.945, 0.783, and 0.754, respectively, for stage F=4. SWV, APRI, and FIB-4 were all correlated with FPP (Pearson correlation coefficients: 0.387, P<0.001; 0.446, P<0.001; 0.419, P<0.001).
Conclusions
ARFI, APRI, and FIB-4 can assess liver fibrosis in patients with hepatitis B when assessing the portal venous pressure. The difference in diagnostic efficacy between the 3 was not significant.
MeSH Keywords: Acoustics; Elasticity Imaging Techniques; Liver Cirrhosis, Alcoholic; Portal Pressure
Background
Liver fibrosis (LF) is a process in which the body responds to and repairs the liver injury caused by various pathogenic factors. In the initial stage, the process is manifested as extrahepatocellular deposition of fibrous matrix, which may progress to cause structural changes and reconstruction of hepatic lobules and ultimately lead to cirrhosis [1]. Researchers have found that the degree of LF can reflect the effectiveness of antiviral therapy in patients with viral liver diseases, where the severity of LF is associated with patients’ clinical outcomes and may reflect the prognosis of patients [2,3]. LF can be caused by a variety of factors such as viral infection, alcohol abuse, and autoimmune diseases, which may ultimately progress to cirrhosis. Portal hypertension is the most common complication of cirrhosis [4], and pressure in the portal vein is closely associated with the severity of disease [5,6]. However, early LF and portal hypertension lack typical clinical symptoms due to powerful liver compensation. Studies have shown that early aggressive intervention can reverse the progression of LF [7], which can delay or even prevent patients with chronic liver diseases from developing portal hypertension [8]. Therefore, assessment of LF and portal venous pressure is important for the development of therapeutic strategies, monitoring of disease progression, and efficacy of treatments.
Currently, liver biopsy is still considered the criterion standard in diagnosing LF [9]. Portal pressure gradient and free portal pressure (FPP), which are 2 recognized measurements of portal venous pressure, are invasive examinations that are not easily accepted by patients, require high medical costs, and are difficult to implement at the grassroots level. Portal venous pressure rises gradually with the exacerbation of LF [10,11]. Some scholars have demonstrated through elastography technology that liver stiffness can indirectly reflect portal venous pressure [12–14]. In this study, hepatitis B patients undergoing liver surgery were selected as subjects and SWV was measured using ARFI technology to reflect liver stiffness. Preoperatively, serological markers of LF were collected and fibrosis indices APRI and FIB-4 were calculated. FPP was measured intraoperatively and fibrosis of liver tissues was pathologically staged postoperatively. The above results were studied, with the aim of preliminarily investigating the assessment of LF in patients with hepatitis while assessing the portal venous pressure.
Material and Methods
General information
Patients with hepatitis B who were admitted to our hospital for open hepatectomy from February 2013 to August 2015 were selected. Inclusion criteria were: those positive for HBsAg, who did not receive anti-liver fibrosis medication. Exclusion criteria were: patients with severe cardiopulmonary diseases or blood diseases; and patients who had recently taken coagulation-affecting drugs; those with cholestasis, acute liver injury, cavernous transformation of portal vein, positive HCV-Ab, HIV infection, autoimmune hepatitis, or compressed major intrahepatic vessels. Finally, a total of 126 eligible patients signed informed consent and were enrolled into this study. Of these, 81 were males and 45 were females, with a mean age of 48.3 (21–66) years. This study was approved by the Institutional Review Board of the First Affiliated Hospital of Shihezi University School of Medicine. Each of the subjects signed written informed consent.
ARFI imaging
All patients underwent ARFI examination within 1 week preoperatively. Patients were fasted for more than 8 h. The Siemens ACUSON S2000 ultrasound system with ARFI imaging software and 4C1 convex probe was used. All patients underwent routine ultrasound scanning of the liver in supine position. Right arms were lifted around the head to fully expose the intercostal spaces on the right side, then a probe was gently placed at the 5–7th right intercostal spaces. After starting the ARFI imaging system, liver parenchyma around proposed surgical sites were detected while avoiding visible intrahepatic vascular structure. Patients were asked to hold their breath during each of the ARFI measurements. Measurements were done 10 times at the right lobe of the liver, at the depth of 2 to 3 cm under the liver capsule.
Serological markers of LF
Blood was collected from all patients on admission for detecting biochemical, blood routine tests, and coagulation indices. LF-related indices, APRI and FIB-4, were calculated according to the following formulas:
Intraoperative measurement of FPP
Intraoperatively, the right gastroepiploic vein or superior mesenteric vein was fully exposed and dissected. An infusion tube was filled with normal saline, connected to the intravenous catheter, and exhausted, followed by occlusion of the tail end. The intravenous catheter was inserted into the dissected vein and fixed. The infusion tube was lifted vertically and opened at the top end. Liquid in the infusion tube dropped naturally until stabilized, and the liquid surface height was measured with the anterior lumbar margin as the zero point, which was precisely the FPP (cmH2O).
Pathological examination
All liver tissue specimens were collected from the normal liver tissues at the resection margins of space-occupying liver lesions. Tissues close to the elastography imaging sites were collected whenever possible. The specimens were 10% formalin-fixed, paraffin-embedded, sliced, and stained with HE and MASSON. Biopsies were read blindly by 1 senior pathologist for staging of LF. LF was classified into stages 0 through 4 according to the Metavir system [14], where stage 0 (F0) has no fibrosis; stage 1 (F1) has portal fibrosis without septa; stage 2 (F2) has portal fibrosis with few septa; stage 3 (F3) has numerous septa without cirrhosis; and stage 4 (F4) has cirrhosis.
Statistical methods
All data were statistically analyzed using SPSS (SPSS Inc., Chicago, IL, USA) 17.0 and MedCalc 12.7.0 software (MedCalc Software bvba, Mariakerke, Belgium). Measurement data were tested for normality and expressed as mean ± standard deviation if they had normal distribution; otherwise, they are expressed as median (interquartile range). Ranked data were analyzed by Spearman correlation test, while measurement data were analyzed by Pearson correlation test. ROC curves of ARFI, APRI, and FIB-4 were plotted; cutoff value, sensitivity, and specificity were calculated; and differences in AUC were examined by Z test. p<0.05 was considered statistically significant.
Results
The basic characteristics are shown in Table 1.
Table 1.
Characteristics of the included patients.
| Characteristics | |
|---|---|
| No. of patients | 126 |
| Age, mean (SD) [range], years | 48.3 (9.3) [21–66] |
| Male, n (%) | 81 (64.3) |
| BMI, mean (SD) [range], kg/m2 | 24.2 (2.9) [17.7–36.2] |
| AST, median (IQR) [range], IU/l | 31.0 (24.0–47.5) [14.0–376.0] |
| ALT, median (IQR) [range], IU/l | 41.0 (25.0–67.5) [8.0–362.0] |
| ALP, median (IQR) [range], IU/l | 72.0 (62.0–91.6) [37.0–406.0] |
| GGT, median (IQR) [range], IU/l | 33.0 (21.00–73.0) [11.0–412.0] |
| Total bilirubin, median (IQR) [range], umol/l | 13.9 (10.6–20.1) [4.2–187.5] |
| Serum albumin, mean (SD) [range], g/l | 41.5 (4.1) [23.0–49.6] |
| Platelets count, mean (SD) [range], 109/l | 186.5 (52.5) [94.0–311.0] |
| Prothrombin activity, mean (SD) [range], % | 98.4 (13.5) [68.0–142.0] |
| METAVIR fibrosis stage, n (%) | |
| F0 | 12 (9.5%) |
| F1 | 38 (30.2%) |
| F2 | 42 (33.3%) |
| F3 | 14 (11.1%) |
| F4 | 20 (15.9%) |
Assessment of LF in hepatitis B patients using ARFI technology
ARFI detection results of 126 hepatitis B patients showed that SWV was 0.88~2.72 m/s. Spearman rank correlation analysis revealed that SWV was positively correlated with the degree of LF (r=0.777, P <0.001, Figure 1). ROC curve analysis showed that the AUC of ARFI in diagnosing stages F≥1, F≥2, F≥3, and F=4 LF were 0.830, 0.861, 0.941, and 0.945, respectively. The optimal cutoff values of ARFI in diagnosing stages F≥1, F≥2, F≥3, and F=4 were 1.21 m/s, 1.59 m/s, 1.74 m/s, and 1.92 m/s, respectively (Table 2).
Figure 1.
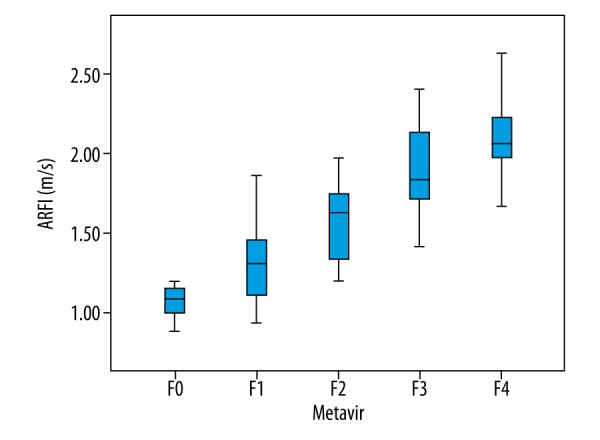
Box plots showing distribution of ARFI values according to histological fibrosis stage. The length of the box is the interquartile range and the median (50th percentile) is the line drawn through the box.
Table 2.
The diagnostic performance of ARFI, APRI, and FIB-4.
| Metavir | Cutoff value | AUC (95% CI) | Sensitivity (%, 95% CI) | Specificity (%, 95% CI) | +LR | −LR | |
|---|---|---|---|---|---|---|---|
| ARFI | F≥1 | 1.21 | 0.830 (0.753–0.891) | 82.14 (73.8–88.7) | 85.71 (57.2–98.2) | 5.75 (1.6–20.8) | 0.21 (0.1–0.3) |
| F≥2 | 1.59 | 0.861 (0.788–0.916) | 67.57 (55.7–78.0) | 88.46 (76.6–95.6) | 5.86 (2.7–12.6) | 0.37 (0.3–0.5) | |
| F≥3 | 1.74 | 0.941 (0.884–0.975) | 87.50 (71.0–96.5) | 85.11 (76.3–91.6) | 5.87 (3.6–9.7) | 0.15 (0.06–0.4) | |
| F=4 | 1.92 | 0.945 (0.890–0.978) | 85.00 (62.1–96.8) | 92.45 (85.7–96.7) | 11.26 (5.6–22.5) | 0.16 (0.06–0.5) | |
| APRI | F≥1 | 0.23 | 0.768 (0.685–0.839) | 92.86 (86.4–96.9) | 57.14 (28.9–82.3) | 2.17 (1.2–4.0) | 0.12 (0.06–0.3) |
| F≥2 | 0.33 | 0.773 (0.690–0.843) | 89.19 (79.8–95.2) | 55.77 (41.3–69.5) | 2.02 (1.5–2.8) | 0.19 (0.10–0.4) | |
| F≥3 | 0.38 | 0.793 (0.711–0.860) | 90.62 (75.0–98.0) | 54.26 (43.7–64.6) | 1.98 (1.5–2.5) | 0.17 (0.06–0.5) | |
| F=4 | 0.69 | 0.783 (0.701–0.852) | 60.00 (36.1–80.9) | 96.23 (90.6–99.0) | 15.90 (5.7–44.3) | 0.42 (0.2–0.7) | |
| FIB-4 | F≥1 | 1.31 | 0.717 (0.630–0.793) | 61.61 (51.9–70.6) | 92.86 (66.1–99.8) | 8.63 (1.3–57.3) | 0.41 (0.3–0.5) |
| F≥2 | 1.33 | 0.754 (0.669–0.826) | 74.32 (62.8–83.8) | 75.00 (61.1–86.0) | 2.97 (1.8–4.9) | 0.34 (0.2–0.5) | |
| F≥3 | 1.52 | 0.799 (0.718–0.865) | 84.37 (67.2–94.7) | 69.15 (58.8–78.3) | 2.73 (2.0–3.8) | 0.23 (0.10–0.5) | |
| F=4 | 2.91 | 0.754 (0.669–0.826) | 50.00 (27.2–72.8) | 98.11 (93.4–99.8) | 26.50 (6.3–112.0) | 0.51 (0.3–0.8) |
AUC – area under the receiver operating characteristic curve; +LR – positive likelihood ratio; −LR – negative likelihood ratio.
Assessment of LF using serological markers
Results of APRI and FIB-4 indices corresponding to different Metavir stages are shown in Figures 2 and 3. APRI was 0.08~2.10 and FIB-4 was 0.33~6.31. Spearman correlation analysis revealed that both APRI and FIB-4 were positively correlated with the stage of LF (r=0.526, P<0.001; r=0.471, P<0.001, Figures 2, 3). ROC curve analysis showed that the AUC of APRI in diagnosing stages F≥1, F≥2, F≥3, and F=4 LF were 0.768, 0.773, 0.793, and 0.783, respectively (Table 2, Figure 4), while those for FIB-4 were 0.717, 0.754, 0.799, and 0.754, respectively (Table 2, Figure 4).
Figure 2.
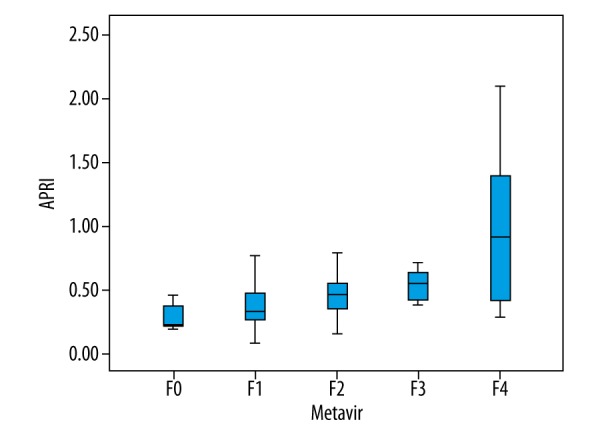
Box plots showing distribution of APRI values according to histological fibrosis stage.
Figure 3.
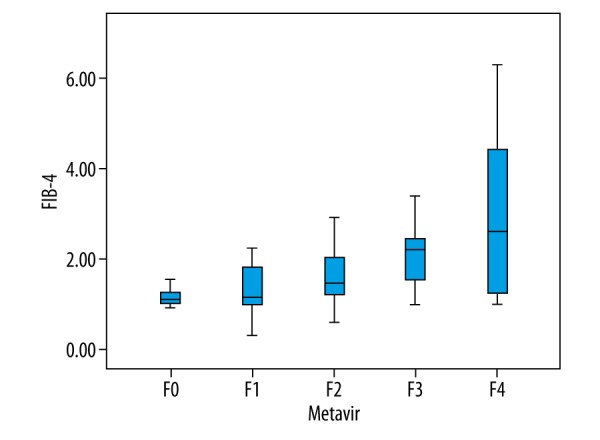
Box plots showing distribution of FIB-4 values according to histological fibrosis stage.
Figure 4.
ROC curves of ARFI, APRI and FIB-4 for liver fibrosis stage (A) F≥1, (B) F≥2, (C) F≥3 and (D) F=4.
Assessment of FPP in patients with LF using ARFI, APRI and FIB-4
FPP range of 126 hepatitis B patients was measured to be between 13~29 cmH2O. Spearman correlation analysis revealed that FPP was positively with correlated the stage of LF (r=0.664, P<0.001, Figure 5). SWV, APRI, and FIB-4 were all correlated with FPP, with Pearson correlation coefficients of 0.387, P<0.001; 0.446, P<0.001; and 0.419, P<0.001, respectively. The linear correlation between SWV by ARFI and FPP is shown in Figure 6. Meanwhile, the linear equation between ARFI and FPP was: FPP=14.919+3.764×ARFI, R=0.387, P<0.001. Combining elastography technology with serological markers and by multiple linear regression, FPP estimation equation was calculated as follows: FPP=15.144+2.331×ARFI+2.863×APRI+0.324×FIB-4, R=0.500, P<0.001.
Figure 5.
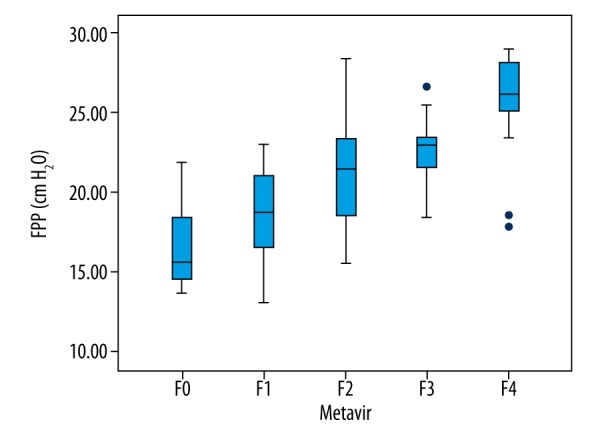
Box plots showing distribution of FPP values according to histological fibrosis stage.
Figure 6.
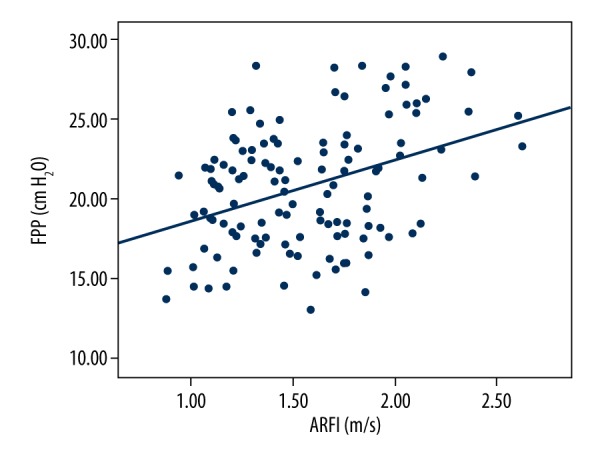
Linear regression analysis between FPP and ARFI.
Discussion
Most chronic liver diseases can cause LF and eventually progress to cirrhosis. According to a study, the incidence of liver cancer increases with increasing severity of LF in patients with viral hepatitis [15]. Liver cirrhosis is often accompanied by portal hypertension. It has been reported that 30% of cirrhotic patients develop gastrointestinal bleeding within 2 years after occurrence of esophageal varices [16], which may result in 1-year rebleeding rates of up to 70% and mortality of 33% if not treated in time. According to statistical analyses [17], China has become the country paying the highest social costs for hepatitis B, cirrhosis, and liver cancer in the world. Nearly 100 million of the world’s 350 million hepatitis B virus carriers are Chinese; and among approximately 700 000 viral hepatitis-related deaths annually worldwide, China account for nearly half. Reported cases of hepatitis B have topped all notifiable infectious diseases over the years in China, accounting for about 1/3 of the total infectious disease cases. In addition, annual new infections of hepatitis B are up to 100 000 in China. Therefore, early detection and intervention are vitally important for the control and treatment of LF, and research on changes in FPP at different LF stages is of great significance to the early prevention of portal hypertension. However, liver puncture biopsy, the criterion standard, has 3 limitations [18]: (1) invasiveness, with a mortality of 0.1–0.01%; (2) Sampling error, with the liver tissues collected accounting only for 1/50 000 of the entire liver; and (3) Difficulties in performing liver puncture biopsy in rural and remote regions. For the above reasons, non-invasive diagnosis of LF has become an important topic in the field of ultrasound [19].
ARFI technology enables localized micro-deformations within corresponding tissues by transmitting a long tone burst or pulse (hundreds of cycles) to the region of interest, relying on ultrasonic probes, and can achieve quantitative analysis of tissue stiffness by measuring SWV produced in that region [20]. ARFI technology can test the elasticity of tissues within specific regions by combining real-time 2D sonograms: the stiffer the tissue, the faster the propagation of transverse shear waves and the greater the SWV value. A number of studies have shown that the influences of sex, age, oral contraceptives, steatosis, ascites, and AST level on ARFI are negligible [21,22], thus widening the application range of ARFI technology. In the present study, this relatively new ultrasound technology was used to assess LF and FPP. When collecting patient data, factors likely to influence SWV in elastography were strictly controlled and patients with cholestatic or liver injury were excluded. Cholestasis and acute liver injury can significantly increase the liver stiffness of the liver, which thus affect the results of elastography [23,24]. The APRI and FIB-4 indices used in this study were initially used to assess LF in patients with hepatitis C. These somewhat representative indices have been gradually increasing in use for patients with hepatitis B in recent years, and have shown good diagnostic efficiencies [25].
The SWV values of 126 hepatitis B patients by ARFI was 0.88~2.72. Spearman correlation analysis showed a positive correlation between SWV and LF (r=0.777, P<0.001). AUC of ARFI in diagnosing stages F≥1, F≥2, F≥3 and F=4 LF were 0.830, 0.861, 0.941 and 0.945, respectively, which is very close to the 0.82, 0.85, 0.94, and 0.94 reported in a study by Guo et al. [26], close to the diagnostic efficiency in a study by Cassinotto [27] and higher than the diagnostic efficiency in a study by Friedrich-Rust [21]. The optimal cutoff values of ARFI in diagnosing stages F≥1, F≥2, F≥3, and F=4 LF were 1.21 m/s, 1.59 m/s, 1.74 m/s, and 1.92 m/s, respectively. This result suggests that ARFI value is influenced by the pathological stage of the liver, in which greater severity of LF is associated with higher ARFI value, greater increase in its cutoff value, and mean SWV. It can thus be inferred that more severe LF is associated with faster changes in liver elasticity and progression of disease. Early assessment and treatment of LF are vitally important for improved prognosis.
Results of APRI and FIB-4 indices corresponding to different Metavir stages are shown in Figures 2 and 3. APRI was 0.08~2.10 and FIB-4 was 0.33~6.31. Spearman correlation analysis revealed that both APRI and FIB-4 were positively correlated with the stage of LF (r=0.526, P<0.001; r=0.471, P<0.001, Figures 2, 3). ROC curve analysis showed that the AUC of APRI in diagnosing stages F≥1, F≥2, F≥3, and F=4 LF were 0.768, 0.773, 0.793, and 0.783, respectively (Table 2, Figure 4), while those for FIB-4 were 0.717, 0.754, 0.799, and 0.754, respectively (Table 2, Figure 4). We did not find a significant difference in diagnostic efficiency between APRI, FIB-4, and ARFI through pairwise comparison of ROC curves. However, the former 2 are easier to obtain clinically because only calculation of routine biochemical results and basic patients characteristics are needed. So, in areas with limited medical resources, APRI and FIB-4 have broad potential use.
Research has demonstrated that during the formation of LF, portal venous resistance gradually increases, vascular diameter gradually increases, and blood flow velocity in the portal vein gradually decreases [19]. In the present study, FPP showed a positive correlation with LF. Increased FPP is especially obvious in patients who have cirrhosis (stage F4). This result is consistent with the conclusion in the former study. Non-invasive detection of LF has been rapidly developing in recent years, particularly in the field of ultrasound elastography. On the basis of the aforementioned theory, we attempted to assess FPP in the way LF was assessed. FPP range of 126 hepatitis B patients was measured as 13~29 cmH2O. Spearman correlation analysis revealed a positive correlation between FPP and the stage of LF (r=0.664, P<0.001, Figure 5). SWV, APRI, and FIB-4 were all correlated with FPP, with Pearson correlation coefficients of 0.387, P<0.001; 0.446, P<0.001; and 0.419, P<0.001, respectively. The linear correlation between SWV by ARFI and FPP is shown in Figure 6. The linear equation used in assessing the relationship between ARFI and FPP was: FPP=14.919+3.764×ARFI, R=0.387, P<0.001. Combining elastography technology with serological markers and by multiple linear regression, the FPP estimation equation was calculated as follows: FPP=15.144+2.331×ARFI+2.863×APRI+0.324×FIB-4, R=0.500, P<0.001. We believe that with the development of elastography technology and addition of large samples, the equation can be further improved.
In the present study, all patients underwent ARFI measurements within 1 week preoperatively, and tissue specimens were collected immediately after surgery. Some scholars believe that the interval between ultrasound elastography and tissue specimen collection should be within 3 months to yield reliable results [28]. Our results were not affected by time interval. Serological results were based on blood samples collected on morning after admission for all patients, and were not affected by any treatment. Time from blood sampling to specimen obtainment did not exceed 4 weeks. We measured FPP immediately after abdominal incision, without making excessive exploration, which not only unified the standards, but also reduced the surgical influence on FPP.
Conclusions
ARFI, APRI, and FIB-4 all have a highly consistent association with the stage of LF, and can be used in assessing the severity of LF. The present study was a preliminary investigation of the feasibility of using the above indices alone or in combination in assessing FPP. ARFI, APRI, and FIB-4 can be useful in assessing LF in patients with hepatitis B while assessing the portal venous pressure.
Footnotes
Source of support: This research was supported by grants from the National Natural Science Foundation of China (81360076); the Science and Technology Program of Xinjiang Production and Construction Corps (2014AB051) and Shihezi University Youth Science and Technology Research and Development Program, Basis and Application Research Project (2014ZRKXYQ21)
References
- 1.Hytiroglou P, Snover DC, Alves V, et al. Beyond “cirrhosis” a proposal from the International Liver Pathology Study Group. Am J Clin Pathol. 2012;137:5–9. doi: 10.1309/AJCP2T2OHTAPBTMP. [DOI] [PubMed] [Google Scholar]
- 2.Hu DD, Chen Y, Bihi A, et al. A new conversation between radiology and pathology-identifying microvascular architecture in stages of cirrhosis via diffraction enhanced imaging in vitro. PLoS One. 2014;9:e87957. doi: 10.1371/journal.pone.0087957. [DOI] [PMC free article] [PubMed] [Google Scholar]
- 3.Silkauskaite V, Pranculis A, Mitraite D, et al. Hepatic venous pressure gradient measurement in patients with liver cirrhosis: A correlation with disease severity and variceal bleeding. Medicina (Kaunas) 2009;45:8–13. [PubMed] [Google Scholar]
- 4.Castera L, Pinzani M, Bosch J. Non invasive evaluation of portal hypertension using transient elastography. J Hepatol. 2012;56:696–703. doi: 10.1016/j.jhep.2011.07.005. [DOI] [PubMed] [Google Scholar]
- 5.Li X, Benjamin IS, Alexander B. The relationship between intrahepatic portal systemic shunts and microsphere induced portal hypertension in the rat liver. Gut. 1998;42:276–82. doi: 10.1136/gut.42.2.276. [DOI] [PMC free article] [PubMed] [Google Scholar]
- 6.Bruix J, Castells A, Bosch J, et al. Surgical resection of hepatocellular carcinoma in cirrhotic patients: Prognostic value of preoperative portal pressure. Gastroenterology. 1996;111:1018–22. doi: 10.1016/s0016-5085(96)70070-7. [DOI] [PubMed] [Google Scholar]
- 7.Friedman SL, Bansal MB. Reversal of hepatic fibrosis – fact or fantasy? Hepatology. 2006;43(2 Suppl 1):S82–88. doi: 10.1002/hep.20974. [DOI] [PubMed] [Google Scholar]
- 8.Ding K, Liu M, Li J, et al. A study of free portal pressure in cynomolgus monkeys with different degrees of liver fibrosis. J Environ Pathol Toxicol Oncol. 2014;33:315–21. doi: 10.1615/jenvironpatholtoxicoloncol.2014011492. [DOI] [PubMed] [Google Scholar]
- 9.Kleiner DE, Brunt EM. Nonalcoholic fatty liver disease: Pathologic patterns and biopsy evaluation in clinical research. Semin Liver Dis. 2012;32:3–13. doi: 10.1055/s-0032-1306421. [DOI] [PubMed] [Google Scholar]
- 10.Trebicka J, Schierwagen R. Statins, Rho GTPases and KLF2: New mechanistic insight into liver fibrosis and portal hypertension. Gut. 2015;64:1349–50. doi: 10.1136/gutjnl-2014-308800. [DOI] [PubMed] [Google Scholar]
- 11.Fujimoto K, Kato M, Kudo M, et al. Novel image analysis method using ultrasound elastography for noninvasive evaluation of hepatic fibrosis in patients with chronic hepatitis C. Oncology. 2013;84(Suppl 1):3–12. doi: 10.1159/000345883. [DOI] [PubMed] [Google Scholar]
- 12.Millonig G, Reimann FM, Friedrich S, et al. Extrahepatic cholestasis increases liver stiffness (FibroScan) irrespective of fibrosis. Hepatology. 2008;48:1718–23. doi: 10.1002/hep.22577. [DOI] [PubMed] [Google Scholar]
- 13.de Franchis R, Baveno VI. Faculty: Expanding consensus in portal hypertension: Report of the Baveno VI Consensus Workshop: Stratifying risk and individualizing care for portal hypertension. J Hepatol. 2015;63:743–52. doi: 10.1016/j.jhep.2015.05.022. [DOI] [PubMed] [Google Scholar]
- 14.Boleslawski E, Petrovai G, Truant S, et al. Hepatic venous pressure gradient in the assessment of portal hypertension before liver resection in patients with cirrhosis. Br J Surg. 2012;99:855–63. doi: 10.1002/bjs.8753. [DOI] [PubMed] [Google Scholar]
- 15.European Association for the Study of the Liver, European Organisation for Research and Treatment of Cancer. EASL–EORTC clinical practice guidelines: Management of hepatocellular carcinoma. J Hepatol. 2012;56:908–43. doi: 10.1016/j.jhep.2011.12.001. [DOI] [PubMed] [Google Scholar]
- 16.Lampertico P, Invernizzi F, Viganò M, et al. The long-term benefits of nucleos(t)ide analogs in compensated HBV cirrhotic patients with no or small esophageal varices: A 12-year prospective cohort study. J Hepatol. 2015;63:1118–25. doi: 10.1016/j.jhep.2015.06.006. [DOI] [PubMed] [Google Scholar]
- 17.Ott JJ, Stevens GA, Groeger J, Wiersma ST. Global epidemiology of hepatitis B virus infection: new estimates of age-specific HBsAg seroprevalence and endemicity. Vaccine. 2012;30:2212–19. doi: 10.1016/j.vaccine.2011.12.116. [DOI] [PubMed] [Google Scholar]
- 18.Bedossa P, Dargère D, Paradis V. Sampling variability of liver fibrosis in chronic hepatitis C. Hepatology. 2003;38:1449–57. doi: 10.1016/j.hep.2003.09.022. [DOI] [PubMed] [Google Scholar]
- 19.Barbero-Villares A, Mendoza Jiménez-Ridruejo J, Taxonera C, et al. Evaluation of liver fibrosis by transient elastography (Fibroscan®) in patients with inflammatory bowel disease treated with methotrexate: a multicentric trial. Scand J Gastroenterol. 2012;47:575–79. doi: 10.3109/00365521.2011.647412. [DOI] [PubMed] [Google Scholar]
- 20.Rizzo L, Calvaruso V, Cacopardo B, et al. Comparison of transient elastography and acoustic radiation force impulse for non-invasive staging of liver fibrosis in patients with chronic hepatitis C. Am J Gastroenterol. 2011;106:2112–20. doi: 10.1038/ajg.2011.341. [DOI] [PubMed] [Google Scholar]
- 21.Friedrich-Rust M, Buggisch P, de Knegt RJ, et al. Acoustic radiation force impulse imaging for non-invasive assessment of liver fibrosis in chronic hepatitis B. J Viral Hepat. 2013;20:240–47. doi: 10.1111/j.1365-2893.2012.01646.x. [DOI] [PubMed] [Google Scholar]
- 22.Bota S, Herkner H, Sporea I, et al. Meta-analysis: ARFI elastography versus transient elastography for the evaluation of liver fibrosis. Liver Int. 2013;33:1138–47. doi: 10.1111/liv.12240. [DOI] [PubMed] [Google Scholar]
- 23.Pfeifer L, Strobel D, Neurath MF, Wildner D. Liver stiffness assessed by acoustic radiation force impulse (ARFI) technology is considerably increased in patients with cholestasis. Ultraschall Med. 2014;35:364–67. doi: 10.1055/s-0034-1366057. [DOI] [PubMed] [Google Scholar]
- 24.Karlas TF, Pfrepper C, Rosendahl J, et al. Acoustic radiation force impulse (ARFI) elastography in acute liver failure: necrosis mimics cirrhosis. Z Gastroenterol. 2011;49:443–48. doi: 10.1055/s-0029-1245690. [DOI] [PubMed] [Google Scholar]
- 25.Gong HY, Hu Y, Ye XH, et al. [Diagnostic efficiency of real-time tissue elastography in evaluating liver fibrosis]. Acta Universitatis Medicinalis Nanjing (Natural Science) 2013;33:131–34. [in Chinese] [Google Scholar]
- 26.Guo Y, Parthasarathy S, Goyal P, et al. Magnetic resonance elastography and acoustic radiation force impulse for staging hepatic fibrosis: A meta-analysis. Abdom Imaging. 2014;40:818–34. doi: 10.1007/s00261-014-0137-6. [DOI] [PubMed] [Google Scholar]
- 27.Cassinotto C, Lapuyade B, Mouries A, et al. Non-invasive assessment of liver fibrosis with impulse elastography: Comparison of Supersonic Shear Imaging with ARFI and FibroScan®. J Hepatol. 2014;61:550–57. doi: 10.1016/j.jhep.2014.04.044. [DOI] [PubMed] [Google Scholar]
- 28.Tsochatzis EA, Gurusamy KS, Ntaoula S, et al. Elastography for the diagnosis of severity of fibrosis in chronic liver disease: A meta-analysis of diagnostic accuracy. J Hepatol. 2011;54:650–59. doi: 10.1016/j.jhep.2010.07.033. [DOI] [PubMed] [Google Scholar]


