Abstract
FeS-clusters are utilized by numerous proteins within several biological pathways that are essential for life. In eukaryotes, the primary FeS-cluster production pathway is the mitochondrial iron-sulfur cluster (ISC) pathway. In Saccharomyces cerevisiae, de novo FeS-cluster formation is accomplished through coordinated assembly with the substrates iron and sulfur by the scaffold assembly protein “Isu1”. Sulfur for cluster assembly is provided by cysteine desulfurase “Nfs1”, a protein that works in union with its accessory protein “Isd11”. Frataxin “Yfh1” helps direct cluster assembly by serving as a modulator of Nfs1 activity, by assisting in the delivery of sulfur and Fe(II) to Isu1, or more likely through a combination of these and other possible roles. In vitro studies on the yeast ISC machinery have been limited, however, due to the inherent instability of recombinant Isu1. Isu1 is a molecule prone to degradation and aggregation. To circumvent Isu1 instability, we have replaced yeast Isu1 with the fly ortholog to stabilize our in vitro ISC assembly system and assist us in elucidating molecular details of the yeast ISC pathway.
Our laboratory previously observed that recombinant frataxin from Drosophila melanogaster has remarkable stability compared to the yeast ortholog. Here we provide the first characterization of D. melanogaster Isu1 (fIscU) and demonstrate its ability to function within the yeast ISC machinery both in vivo and in vitro. Recombinant fIscU has similar physical properties similar to that of yeast Isu1. It functions as a stable dimer with similar Fe(II) affinity and ability to form two 2Fe-2S clusters as the yeast dimer. The fIscU and yeast ISC proteins are compatible in vitro; addition of Yfh1 to Nfs1-Isd11 increases the rate of FeS-cluster formation on fIscU to a similar extent observed with Isu1. Finally, fIscU expressed in mitochondria of a yeast strain lacking Isu1 (and its paralog Isu2) is able to completely reverse the deletion phenotypes. These results demonstrate fIscU can functionally replace yeast Isu1 and it can serve as a powerful tool for exploring molecular details within the yeast ISC pathway.
Graphical Abstract
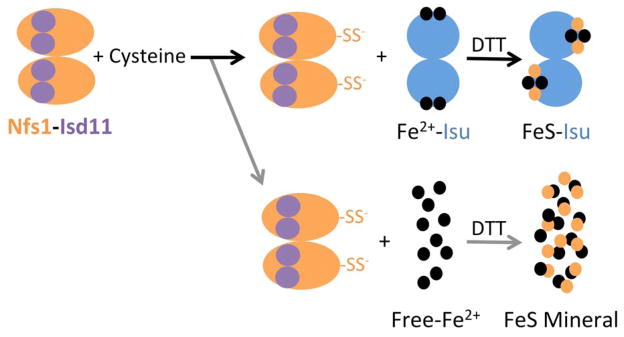
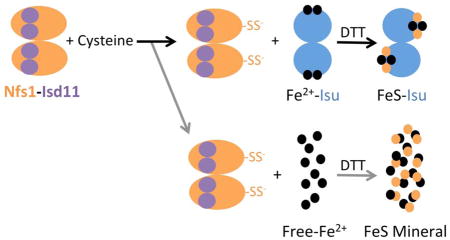
Model for mitochondrial Fe-S cluster assembly with bypass mechanisms for FeS mineral accumulation.
INTRODUCTION
FeS-cluster cofactors are ubiquitous in biology and play integral roles in nearly every biochemical pathway. In recent years, several human diseases have been linked to dysfunctional FeS-cluster metabolism, including Friedreich’s ataxia1, 2 and IscU myopathy.3, 4 Research at the molecular level into the FeS-cluster production pathway is paramount to understanding disease pathology within these and related disorders. Since both free iron and sulfur are toxic in abundance, production of FeS-clusters must occur within cells within a tightly regulated manner. In eukaryotes, the core pathway for FeS-cluster production is the iron-sulfur cluster (ISC) pathway. This pathway is primarily localized within the mitochondria,5 and it is essential for the formation of all cellular FeS-clusters.6 In vivo yeast ISC studies have provided much of the molecular and genetic insight into how this pathway functions. In Saccharomyces cerevisiae, de novo mitochondrial FeS-cluster formation occurs on the scaffold protein “Isu1”, which provides the architecture for cofactor assembly.7, 8 The cysteine desulfurase “Nfs1”, when in combination with its accessory protein partner “Isd11”, provides sulfur for cluster assembly.9, 10 The ferredoxin “Yah1” provides reducing equivalents to direct and stabilize cofactor assembly, to stabilize the sulfur for assembly and delivery and to possibly stabilize the redox state of the iron cofactor.11 Frataxin “Yfh1”, an allosteric regulator of the cysteine desulfurase12, 13 and facilitator of sulfur transfer from Nfs1 to Isu114 also helps direct Fe delivery to the scaffold, possibly by mediating iron binding or delivery to Isu115, 16 or by serving in a yet uncharacterized manner. Molecular chaperones then direct delivery of the functional FeS-cluster to recipient proteins downstream of assembly.17–19 However, during assembly, these ISC proteins work in a coordinated manner to construct functional FeS-cluster, onto Isu1. Unfortunately, many of the molecular details of this process are still poorly understood.
Investigative studies of the S. cerevisiae ISC pathway in vitro have provided insight into mitochondrial FeS-cluster assembly.6 These studies, however, have been hampered due to the instability of recombinant Isu1, which has relatively low solubility and is prone to spontaneous aggregation.11 Recently, Webert et al circumvented this limitation within their yeast characterizational studies by replacing S. cerevisiae Isu1 with the thermophilic ortholog from Chaetomium thermophilum.11 While Isu1 ortholog replacement facilitated novel experimentation in this system, there is a potential concern regarding incomplete complementation between the S. cerevisiae and C. thermophilum ISC molecular partners. A recent study demonstrating that frataxin, a central component of the ISC machinery, functions differently in the yeast and bacterial systems20 only highlights these concerns. Previous characterizational studies on the frataxin ortholog from Drosophila melanogaster, “Dfh”, found that this protein behaves highly similar to Yfh1, however it had enhanced stability.16 In this current article, we characterize an Isu1 ortholog from D. melanogaster “fIscU” and compare it to the S. cerevisiae Isu1 ortholog, “yIsu1” with regards to the protein’s biophysical properties and functionality related to cluster assembly. We demonstrate that fIscU is functionally active in mediating FeS-cluster assembly and is able to interact with yeast ISC proteins both in vitro and in vivo. Our data support the Webert results of the C. thermophilum ISC characterizational studies and provide an additional, and highly stable Isu ortholog, which can be used to further investigate the yeast ISC system. Finally, by perturbing the system by inclusion of the ortholog, we were able to provide insight towards the intermolecular interactions between protein partners within the ISC pathway that provides a better understanding of how these proteins accomplish FeS cluster assembly in cells.
EXPERIMENTAL
Protein Expression and Purification
S. cerevisiae Isu1 (yIsu1), Nfs1-Isd11, Yfh1, Yah1, Nfs1-Isd11-yIsu1-Yfh1 complex, and D. melanogaster Isu (fIscU) were expressed in E. coli and purified in the following manner. Plasmid constructs were synthesized for each respective protein as follows: fIscU and yIsu1 vectors were prepared in pET151/D-TOPO (ThermoFisher), Nfs1-Isd11 in pST3921 (Addgene), Yfh1 in pCOLAduet (Novagen), and Yah1 in pET21b (Novagen). Cells with the pET151/D-TOPO, pST39, and pET21b plasmids were grown in 100 μg/mL ampicillin; cells with pCOLAduet were grown in 50 μg/mL kanamycin. All constructs contained a 6xHis-tag on either the C- (Yfh1, yIsu1, Nfs1, Yah1) or N- (fIscU) terminus. Plasmids were transformed into competent cells via heat-shock at 42°C for 30 seconds. Optimal growth conditions were identified for each respective protein. Individual proteins (yIsu1, Yfh1, and the Nfs1-Isd11-Isu1-Yfh1 complex) were expressed in BL21-RIL competent cells22 (Agilent), Nfs1-Isd11 and fIscU was expressed in BL21-DE3 cells (Agilent), and Yah1 was expressed in C41 cells (Lucigen). Cells with yIsu1, Yfh1, Yah1, and Nfs1-Isd11-yIsu1-Yfh1 plasmids were grown to an optical density (OD) ~0.6, induced with 0.8 mM IPTG, and incubated for 3 hours at 37°C. Nfs1-Isd11 expressing cells were induced at OD ~0.4 and incubated for 18 hours at 18°C. PLP was added, to a final concentration of 10 μM, to Nfs1-Isd11 and Nfs1-Isd11-yIsu1-Yfh1 cells at the time of induction. The protein fIscU was expressed using an auto-induction protocol23 utilizing inoculation into ZYP-5052 rich media at 27°C for 24 hours. After harvesting, cells were lysed using an Emulsiflex-C3 homogenizer (AVESTIN). Lysis buffer for yIsu1, fIscU, Yfh1, Nfs1-Isd11, and Yah1 included 50 mM sodium phosphate (NaPi), 300 mM NaCl, and 20 mM imidazole. The lysis buffer for Nfs1-Isd11-yIsu1-Yfh1 complex purification was 20 mM HEPES, 150mM NaCl, and 20 mM imidazole. Lysate was centrifuged at 21 krpm for 45 minutes. The soluble fraction was decanted and filtered before being run through a Ni-NTA agarose. The Ni-NTA agarose was then washed with 5 column volumes of 50 mM imidazole buffer to remove bacterial proteins. The His-tagged target protein was eluted with 5x column volumes of 200 mM imidazole buffer. After elution from the column, the protein was concentrated to ~2 mL via a 10 kDa cutoff membrane Amicon centricon and run on a gel filtration column where buffer was switched to the final experimental buffer. The experimental buffer was 20 mM HEPES at pH 7.5 with differing amounts of salt depending on protein species. For Nfs1-Isd11-Isu1-Yfh1 this was 50 mM NaCl, for Nfs1-Isd11, Yfh1, Yah1 this was 150 mM NaCl, and for yIsu1 and fIscU this was 300 mM NaCl. The proteins fIscU, yIsu1, Yah1, and Yfh1 were run on a S75 size exclusion column, while Nfs1-Isd11-Isu1-Yfh1 and Nfs1-Isd11 were run on a S200 size exclusion column. Purified fractions were pooled and concentrated via Amicon centrifugation. Protein concentration was determined using a Direct-detect IR spectrometer24 (Millipore) and protein purity was assessed via SDS-PAGE. Typical protein purities were ~95%. Concentrated pure protein solutions were flash-frozen in liquid N2 and stored at −80°C until immediately prior to experimentation.
Secondary Structure Characterization of yIsu1 and fIscU
Circular dichroism (CD) spectroscopy was used to determine and compare the general folding parameters of both yIsu1 and fIscU. Protein secondary structures were determined using CD spectroscopy by focusing within the far UV-region (185–260 nm). Homogeneous protein samples were diluted to 10 μM and switched into a 1 mM NaPi buffer via Amicon centrifugation in order to allow far-UV transparency. Data were collected using a 1 mm pathlength CD cuvette on a Jasco J-1500 spectrometer. Spectra were analyzed using the Spectra Manager CDPro software system25 (Jasco). Simulations of the spectra were calculated using the SP37 reference set26 and CONTIN method.27 Spectra provided in Figure 2B are the average of 6 scans. This process was done in triplicate to ensure reproducibility.
Figure 2.
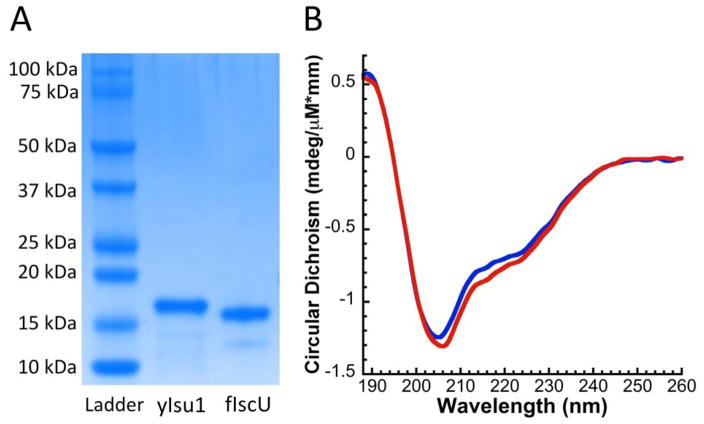
A) Representative SDS-PAGE gel comparing recombinant D. melanogaster IscU (fIscU) to S. cerevisiae Isu1 (yIsu1). B) Far UV circular dichroism of yIsu1 (blue) and fIscU (red) reveals that both proteins share a similar composition of secondary structural features.
Fe-Binding Analysis to fIscU
While the Fe-binding characteristics of yIsu1 have previously been reported,15 metal binding competition analysis was used to characterize the Fe-binding properties of fIscU. Fe-binding to fIscU was assessed using two secondary methods involving the competition of limiting amounts of iron between fIscU and each of the two Fe-binding ligands, Mag-Fura-2 and Fura-FF (Molecular Probes). Experiments were done in triplicate to confirm reproducibility and to identify uncertainty intervals from this method.
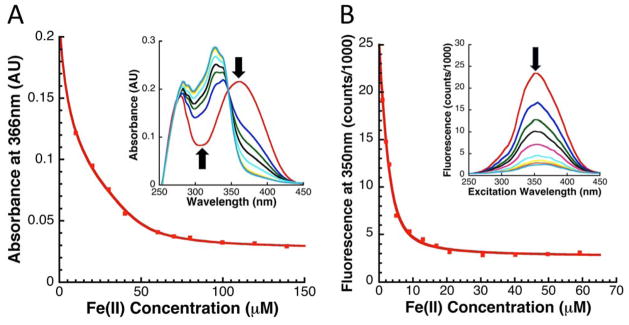
Fe-binding competition between fIscU and the Mag-Fura-2 ligand was performed using a protocol recently outlined for yIsu1.28 Under anaerobic conditions at room temperature, a 10 mM Fe(II) solution was added in 0.5 μL increments to a 1mL solution with 8 μM fIscU and 8 μM Mag-Fura-2. All samples were in 20 mM HEPES and 150 mM NaCl buffer at pH 7.5. A UV-visible absorption spectrum was collected for each Fe(II) consecutive concentration, again under anaerobic conditions, and spectral intensities at 366 nm are indicative of uncomplexed (apo) Mag-Fura-2 ligand were used for binding characterization determination.28 Controls was performed by anaerobically adding the Fe(II) solution to 8 μM Mag-Fura-2 or to 8 μM fIscU, independently.
Using an analogous method to what was described with Mag-Fura-2, competition for Fe-binding to fIscU was also tested using the Fe-binding fluorophore Fura-FF. In principle, Fe-competition between fIscU and Fura-FF is the same as competition between fIscU and Mag-Fura-2. A key difference with Fura-FF, however, is that Fura-FF is a fluorophore that complexes calcium (Ca-Fura-FF). The fluorescence of Fe-Fura-FF complex is about twenty times lower than that seen in the Ca-Fura-FF complex and, as a result, the total fluorescence decreases as more Fe(II) is added to the solution. Therefore, instead of measuring the UV-visible absorption, the fluorescence excitation spectrum between 250 nm - 450 nm is collected after each incremental titration of Fe(II) while keeping the emission wavelength at 510 nm. For binding parameter determination, excitation at only 350 nm was considered. The experimental conditions and data analysis procedure are, otherwise, identical to that described for Mag-Fura-2.
Fe-binding parameters for Mag-Fura-2 and Fura-FF were determined using best-fit simulations with the Dyna-Fit software module29 for a 1- or 2-binding site model. These simulations serve as controls for the binding affinity and stoichiometry of each chelator. Best-fit dissociation constants are identified using a fixed concentration and extinction coefficients for Mag-Fura-2/Fura-FF when added with the solution of the fIscU protein.
X-ray Absorption Spectroscopy (XAS) Studies of Fe Bound to fIscU
XAS was used to study the local coordination environment around the Fe-center in fIscU. A solution of ferrous ammonium sulfate was added directly to fIscU under sulfur free (Fe-fIscU) and sulfur available (FeS-fIscU) conditions. Both XAS samples were prepared anaerobically within a Coy glove box using protein, along with iron and sulfur solutions initially degassed on a Schlenk line before use. XAS samples were prepared in 20 mM HEPES buffer (pH 7.5), 150 mM NaCl, 5 mM β-mercaptanol (BME) and 30% glycerol. Multiple independent duplicate samples were prepared under the following conditions: A) Fe-fIscU was prepared by incubating fIscU with 0.9 equivalents of ferrous iron, and B) FeS-fIscU was prepared by following FeS-cluster assembly conditions outlined below. Samples were given 3 hours to equilibrate at 10°C before being loaded into Lucite sample cells wrapped with Kapton tape. Loaded samples were immediately flash frozen in liquid nitrogen, removed from the glove box and stored in liquid nitrogen until XAS data collection was performed.
XAS data were collected at the Stanford Synchrotron Radiation Laboratory (SSRL) on beamline 7-3. Beamline 7-3 is equipped with a rhodium-coated silicon mirror and a Si[220] double crystal set monochromator; rejection of harmonics was achieved by detuning the monochromator to 30%. Samples were maintained at 10K using an Oxford Instrument continuous-flow liquid helium cryostat. Protein fluorescence excitation spectra were collected using a 30-element Ge solid-state Canberra array detector. XAS spectra were measured using 5 eV steps in the pre-edge region (6,900 – 7,094 eV), 0.25 eV steps in the edge region (7,095–7,135 eV) and 0.05 Å−1 increments in the extended X-ray absorption fine structure (EXAFS) region (to k = 13 Å−1), integrating from 1 to 20 seconds in a k3 weighted manner for a total scan length of approximately 40 minutes. X-ray energies were calibrated by collecting an iron foil absorption spectrum simultaneously with collection of the protein data. Each fluorescence channel of each scan was examined for spectral anomalies prior to averaging and spectra were closely monitored for photoreduction. Protein data represent the average of 7–8 scans.
XAS data were processed using the Macintosh OS X version of the EXAFSPAK program suite,30 integrated with Feff version 7.2 for theoretical model generation. Data reduction and processing followed previously established protocols.15 X-ray absorption near-edge spectroscopy (XANES) analyses were performed using XAS data near the Fe K-edge (7,100–7,160 eV) for both Fe-fIscU and FeS-fIscU. The first derivative of the protein XANES spectra was compared to values obtained for aqueous Fe(II) and Fe(III) standard solutions to approximate the Fe oxidation state of metal in the all protein samples. EDG_FIT software was used to analyze the pre-edge region in all protein samples. A spline function was fit over the pre-edge region (7,109–7,117 eV) and Gaussian models were applied to accommodate features observed that deviated from the spline. Best-fit models were integrated to approximate the normalized pre-edge feature area.
EXAFS fitting analysis was performed on raw/unfiltered data following a previously established strategy.31 EXAFS data were fit using both single- and multiple-scattering theoretical model amplitude and phase functions for Fe-O/N, FeS, Fe-Fe and Fe-C interactions. During spectral simulations, metal-ligand coordination numbers were fixed at half-integer values and only the absorber-scatterer bond length (R) and Debye-Waller factor (σ2) were allowed to freely vary. Criteria for judging the best-fit simulation utilized both the lowest mean square deviation between data and fit (F′), corrected for the number of degrees of freedom, and a reasonable Debye-Waller factor.32, 33
FeS Cluster Formation Reaction
FeS-cluster loaded yIsu1 (FeS-yIsu1) and cluster loaded fIscU (FeS-fIscU) were prepared from purified apo-yIsu1 and apo-fIscU. The procedure for measuring this transformation has been modified from what has been previously reported both by our lab15 and from the original method.7 All solutions were prepared and mixed within an anaerobic glovebox (Coy). In order to achieve optimal yield of FeS-Isu, Nfs1-Isd11 or the Nfs1-Isd11-Isu1-Yfh1 complex were added in a lesser amount (10 μM) than Isu1 (50 μM). This is essential as, under stoichiometric conditions of Nfs1-Isd11 and Isu1, FeS-Isu formation is reduced or absent.34 Yfh1, when present, was added to a 10 μM concentration where stimulation was observed to be maximal. A limiting amount of Fe(II) ammonium sulfate (75 μM) was added to prevent adverse FeS-mineralization.34 L-cysteine was added in 5-fold excess to a concentration of 500 μM. The reaction buffer contained 20mM HEPES (pH 7.5), 500 mM NaCl, 5 mM BME, and 5 mM dithiothreitol (DTT). Reaction formation was monitored both by visible absorption and circular dichroism (CD). Visible spectra were collected with a Shimadzu UV-1800 spectrophotometer and CD spectra were collected with a Jasco J-1500 spectropolarimeter using a 1-cm cuvette.
Cuvettes were sealed prior to being transferred from the glovebox to prevent Fe-oxidation. The reaction volume used was 1.1 mL to accommodate the size of the cuvette. For quantifying FeS-fIscU formation, the size of the 2Fe-2S characteristic negative CD feature at 560 nm was measured every 20 seconds until reactions reached completion. Circular dichroism has several advantages over visible absorption35 signals, so this technique is currently selected as the preferred method for measuring FeS-cluster assembly. At completion of assembly, visible absorption and CD spectra were collected between 350 nm – 700 nm. Adverse FeS-mineralization was estimated as the change in light scattering that occurred during the course of the reaction. Light scattering was estimated as the change in absorption at 700 nm, a wavelength distinct from the expected 2Fe-2S chromophore measured at ~456 nm.
Complementation of Yeast ISC by fIscU
For in vivo studies, the transit peptide sequence of yeast CoxIV (cytochrome c oxidase subunit IV) was fused to the mature sequence of fIscU. The fIscU gene lacking the first 25 amino acids was amplified, including the in frame restriction sites XbaI and XhoI from the pET151/D-TOPO vector used for bacterial fIscU expression. Primers used were: XbaI-dIscU-fw 5′ ataataTCTAGAtatcatgaaaatgtcgttgag 3′; XhoI-dIscU-rv 5′ tattatCTCGAGgttggccaccttcttctgctg 3′. This fragment was inserted, using the respective restriction sites, into the engineered YCplac22 plasmid-Isu1prom-CoxIVL-XbaI-XhoI-STOP-ISU1 3′ UTR36 thereby targeting the fIscU to yeast mitochondria with the CoxIV leader sequence. Strain GAL1-ISU1/Δisu2 with the ISU2 paralog deleted and the ISU1 gene under control of the regulated GAL1 promoter was used for complementation studies. The strain was transformed with the YCplac22 plasmid containing the fIscU (see above), an identical plasmid containing the yeast Isu1 or the empty YCplac22 plasmid, selecting for Trp1 prototrophy. The chromosomal GAL1 promoter was switched off by shifting cells from galactose to glucose as the carbon source. For spotting on agar plates, serial 10-fold dilutions of the transformants were spotted onto defined medium agar plates containing CSM-Trp/glucose, thereby maintaining selection for the plasmid and repressing the GAL1 promoter at the same time. The plates were photographed 4 days later.
Cellular iron-uptake
Cellular iron uptake was measured as previously described37 with minor modifications. Briefly, cells were grown for 16 hours in CSM (complete supplemented defined glucose medium) at 30°C and diluted back to a density of 4 x 10⁶ cells/ml. Cells were washed in 50 mM citrate (pH 6.6) and 5% glucose. An aliquot of 1 x 10⁵ cells was further incubated at 30°C for 90 min with 1 μM 55Fe2+ ascorbate dissolved in 50 mM citrate (pH 6.6), 5% glucose. After washing away unincorporated iron and harvesting cells with a PHD cell harvester, cells were incubated with scintillation fluid, and 55Fe radioactivity was measured in a Beckman scintillation counter.
Aconitase FeS cofactor loading
Measurements of Fe-S cluster assembly on endogenous aconitase and newly imported ferredoxin in isolated and intact mitochondria. The assay volume was 100 μl and included mitochondria (200 μg of proteins) in HS (20 mM Hepes/KOH, pH 7.5, 0.6 M sorbitol) buffer containing 10 mM Mg(OAc)2, 40 mM KOAc, 1 mM DTT, 0.1 mg/ml bovine serum albumin, nucleotides (4 mM ATP, 1 mM GTP, 2 mM NADH), and 10 μM ferrous ascorbate. Following addition of 35S-cysteine (10 μCi), samples were incubated at 30°C for 15–45 min. Reaction mixtures were diluted 12-fold with HS buffer. Mitochondria were recovered by centrifugation, and soluble proteins from mitochondria were analyzed by native PAGE followed by autoradiography, looking for radiolabeling of aconitase (Aco1). 38 The Yah1 precursor protein in pET21b was expressed in bacteria (BL21 DE3). The protein was found to be sequestered in inclusion bodies, and it was solubilized in 20 mM Hepes/KOH, pH 7.5 containing 8 M urea for use in simultaneous import and FeS cluster assembly reactions. The import was initiated by adding 400 ng of urea-denatured ferredoxin precursor protein to mitochondria in 100 μl such that the final urea concentration was 0.16 M. The Fe-S cluster assembly assays were performed as described above. 38
RESULTS & DISCUSSION
Molecular Characteristics of Recombinant fIscU
The molecular characteristics of both fIscU and yIsu1 were compared to gain insight into the possible compatibility of these two orthologs. Alignment of the amino acid sequences indicates fIscU and yIsu1 are highly homologous (Figure 1), with 71% sequence identity and 82% sequence similarity. As with the yeast ortholog,15, 28 fIscU expresses in E. coli in sufficient abundance (~10 mg/L culture), and can be isolated at high enough purity (>95%), to allow for in vitro characterizational studies (Figure 2A). Size exclusion chromatography indicates fIscU elutes with a retention volume (61.0 mL) similar to that observed with yIsu1 under the same solution conditions (60.6 mL), with both eluting between the 44 kDa (58.2 mL) and 17 kDa (73.8 mL) molecular control standards (data not shown). The approximated molecular mass of fIscU is ~33 kDa and that of yIsu1 is ~35 kDa as assessed by gel filtration (versus the size of the monomer resolved on SDS PAGE Fig. 1A) consistent with both fIscU and yIsu1 existing as molecular dimers, in agreement with the reported characteristics of bacterial IscU.7, 39
Figure 1.
Sequence alignment between Isu1 from Saccharomyces cerevisiae (yIsu1, lower case) and Drosophila melanogaster (fIscU, upper case). fIscU has 71% sequence identity and 82% sequence similarity to yIsu1. Residues colored by the ClustalW coloring convention are as follows: acidic (blue), hydrophobic (red), basic (magenta), and hydroxyl/sulfhydryl/amine (green). Active site residues associated with FeS cluster biosynthesis are highlighted with a black background.
Biophysical Characterization of fIscU
Secondary Structure and Fe Binding Affinity
Quantitation of the secondary structure content of fIscU and yIsu1 was determined by circular dichroism (CD) spectroscopy to provide further insight into the molecular similarities between these orthologs. CD spectra, collected for fIscU and yIsu1 under identical solution conditions, show a strong degree of complementary fold (Figure 2B). The relative comparison of secondary structural content measured for fIscU and yIsu1 provides a picture of the two proteins that is highly similar, and consistent with structurally characterized orthologs. Both fIscU and yIsu1 have an α-helical content of 23% and 24%, a β-strand content of 21% and 20%, turn and loop content of 24% and 24%, and an unstructured content of 32% and 32% for fIscU and yIsu1, respectively. In comparison, the structural content from the E. coli ortholog’s crystal structure shows a 28% α-helical content, 12% β-strand content, 25% turn/loop content and a 35% unstructured content.40
The Fe binding capacity of fIscU was tested to support the role of the protein as the de novo FeS-cluster assembly scaffold. The Fe(II)-binding capacity of fIscU was measured using an iron chelation competition assay, developed to match conditions similar to circumstances observed in vivo where a variety of biomolecules compete to coordinate the metal. Two Fe-binding ligands, Mag-Fura-2 and Fura-FF, have been shown to be effective Fe-binding chromophores/fluorophores, hence these were used to measure the metal binding affinity of fIscU and yIsu1 under our competition conditions. Spectral correlations at progressive [Fe], as well as the subsequent Fe-binding curve with simulation for both ligands in the presence of fIscU, are given in Figure 3. As controls, dissociation constants for Mag-Fura-2 and Fura-FF Fe(II) binding in the absence of protein were measured as 2.0 ± 0.2 μM and 0.4 ± 0.1 μM, respectively. Best-fit simulation parameters from ligand Fe-binding profiles with fIscU are provided in Table 1. For both ligands, data indicate two Fe(II) dissociation constants: a tighter binding constant of 695 ± 242 nM and 720 ± 150 nM for Mag-Fura-2 and Fura-FF, and a weaker binding constant of 5.55 ± 2.54 μM and 2.21 ± 0.13 μM for Mag-Fura-2 and Fura-FF, respectively. Differences in binding constant values between both Fe-binding sites are below the lower limits of detection for these methods and should be considered approximately equivalent.
Figure 3.
Fe-Binding Competition Assay with MagFura (A) and Fura-FF (B) ligands upon titration of Fe(II) in the presence of 8μM fIscU. Solid line represents best-fit simulation of data. Inset demonstrates disappearance of chromaphore observed during Fe(II) titration.
Table 1.
Average simulation results including averaged values for dissociation constants (KD1 and KD2).
| Method | KD1 | KD2 |
|---|---|---|
| Competition with Mag-Fura-2 | 695 ± 242 nM | 5.55 ± 2.54 μM |
| Competition with Fura-FF | 720 ± 150 nM | 2.21 ± 0.13 μM |
X-ray Absorption Spectroscopy (XAS)
XAS was used to characterize the metal-site structure for Fe bound to fIscU unaccompanied or in the presence of sulfur. X-ray absorption near edge spectroscopy (XANES) analyses for Fe-fIscU and FeS-fIscU indicate iron is coordinated in a reduced (Fe(II) only) or semi-reduced state (Fe(II)/Fe(III) mixture), respectively (Figure 4), when compared to authentic Fe-O/N and Fe-S model compounds. The 1st inflection point energy values for Fe-fIscU and FeS-fIscU are 7123.4 and 7123.3 eV, similar to the values obtained for the Fe(II) sulfate (7123.2 eV) and Fe(II) chloride (7119.5 eV) standards (Table S1), suggesting that metal bound to both samples is in the ferrous oxidation state. A distinct pre-edge feature, attributed to a 1s-3d electronic transition, is observed in all samples at ~7,112 eV. This feature is small (<0.05 eV units) in Fe-fIscU (Figure 4, inset), consistent with 6-coordinate Fe-O/N symmetric model compounds.41 In the FeS-fIscU sample, this feature is over 4-times larger (0.22 eV units), similar to 1s-3d features observed for 4-coordinate Fe constrained within FeS-clusters.15 The large 1s-3d transition in the FeS-fIscU spectrum suggests the 4-coordinate geometry in this sample is more tetrahedral than planar, consistent with other FeS-clusters.42, 43 There are no apparent 1s-4p features in either sample, making pyramidal geometries highly unlikely.44 Comparison of the FeS-fIscU edge with that from as isolated Yah1, an authentic FeS cluster containing protein, shows distinct similarities in edge features and in 1s-3d electronic transition height. Subtle pre-edge max and edge 1st inflection point energies between these two samples may suggest Fe in Yah1 is slightly more reduced, or more likely indicate the Fe-S4 first ligand coordination sphere in Yah1 does not completely match the Fe environment found in FeS-fIscU.
Figure 4.
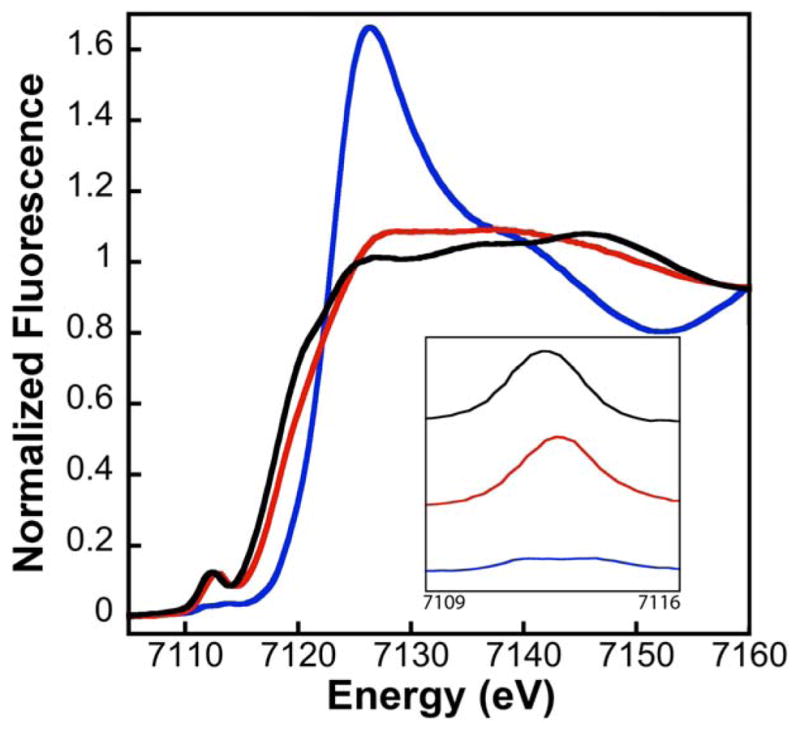
X-ray Absorption Near-Edge Spectra (XANES) for Fe-fIscU (blue), FeS-fIscU (red), and FeS-Yah1 (black). Pre-edge region (inset) demonstrates increased 1s-3d feature in FeS-fIscU, similar to that observed with FeS-Yah1.
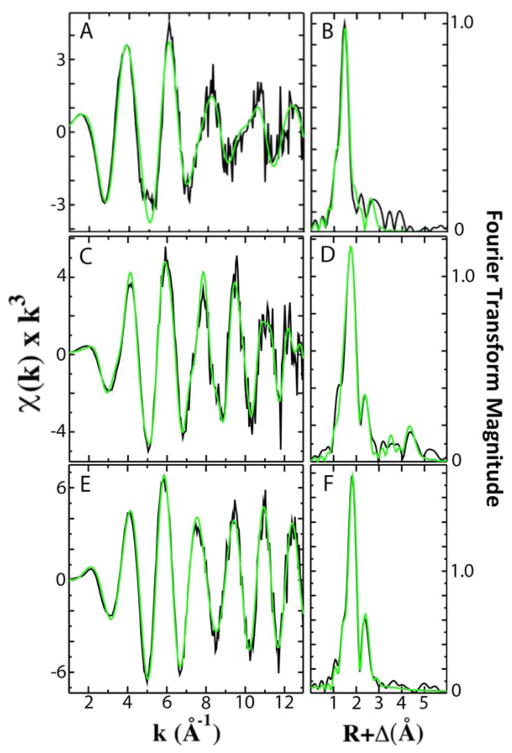
Analysis of the extended x-ray absorption fine structure (EXAFS) region of the XAS data was used to provide extremely high-resolution bond lengths, as well as ligand identity and coordination numbers, for iron bound in both Fe-fIscU and FeS-fIscU. EXAFS from Fe-fIscU and FeS-fIscU reveal a pattern consistent with the structural pictures suggested from the XANES above. Figure 5 compares the raw EXAFS data and best-fit simulations for each fIscU sample, as well as their subsequent Fourier transforms of the EXAFS data; best-fit simulation parameters for both samples are provided in Table 2. For Fe-fIscU, scattering in the nearest-neighbor ligand environment is strictly constructed from two independent environments of oxygen/nitrogen ligands at 1.99 Å and 2.15 Å; Fe-O/N ligation is independent of metal ligation to the protein’s His tag.15 For FeS-fIscU, however, in addition to Fe-O/N scattering at 2.03 Å, there is significant FeS scattering in the nearest neighbor environment at 2.28 Å, and Fe-Fe scattering features at 2.72 Å. Finally, there is long range Fe•••C scattering observed at R > 3.0 Å in both fIscU samples. We compared the EXAFS and FT data for Yah1 to that of FeS-fIscU as an authentic FeS cluster containing molecule. As a control, the Fe-S cluster coordinated to Yah1 has both distinct similarities to that in FeS-fIscU, however subtle differences highlight differences between the two protein’s coordination sites. The Fe-S and Fe•••Fe bond lengths for Yah1 are consistent with the values seen for FeS-fIscU. There are however subtle differences in the iron nearest neighbor environment’s between these two samples, specifically FeS-IscU has an additional Fe-O/N nearest neighbor ligand environment and smaller coordination numbers for both the Fe-S and Fe•••Fe environments, suggesting subtle differences in cluster coordination between the two samples.
Figure 5.
Extended X-ray Absorption Fine Structure (EXAFS) and Fourier transforms (FT) of fIscU and Yah1. EXAFS spectra are provided in panels A, C, and E and FTs are provided in panels B, D, and F. Data (black) is compared to best fit simulations (green) of Fe-fIscU (A,B), FeS-fIscU (C,D), and FeS-Yah1 (E, F).
Table 2.
Best-fit simulation Fe XAS parameters for Fe-fIscU, FeS-fIscU and Yah1. Difference in parameters suggests the Fe-binding site in Fe-fIscU is distinct from an authentic FeS-cluster coordination site.a
| Sample | Fe-Nearest Neighbor Ligandsb | Fe•••Long Range Ligandsb | F′g | ||||||
|---|---|---|---|---|---|---|---|---|---|
| Atomc | R(Å)d | C.N.e | σ2f | Atomc | R(Å)d | C.N.e | σ2 f | ||
| Fe – fIscU | O/N | 1.99 | 3.0 | 3.78 | C | 3.13 | 1.5 | 3.01 | 0.32 |
| O/N | 2.15 | 2.0 | 2.94 | ||||||
| FeS-fIscU | O/N | 2.03 | 1.5 | 4.37 | C | 4.07 | 2.0 | 2.37 | 0.46 |
| S | 2.28 | 2.0 | 5.03 | C | 4.83 | 4.0 | 0.76 | ||
| Fe | 2.72 | 0.5 | 3.84 | ||||||
| FeS-Yah1 | S | 2.29 | 4.0 | 5.58 | 0.40 | ||||
| Fe | 2.71 | 0.75 | 2.36 | ||||||
Yeast Fe-Isu1 and FeS-Isu1 values from EXAFS simulations, published recently15, include [Atom, R, CN, σ2] and (F′) values of: Fe-yIsu1 – [O/N, 2.01, 1.0, 1.91], [O/N, 2.14, 4.5, 3.25], [C, 3.01, 1.5, 1.14], (0.99); and FeS-yIsu1 – [O/N, 2.11, 2.5, 5.05], [S, 2.26, 1.0, 2.45], [Fe, 2.69, 0.5, 1.70], (0.69).
Independent metal-ligand scattering environment
Scattering atoms: O (Oxygen), N (Nitrogen), C (Carbon), S (Sulfur) and Fe (Iron)
Metal-ligand bond length
Metal-ligand coordination number
Debye-Waller factor given in Å2 × 10³
Number of degrees of freedom weighted mean square deviation between data and fit
Transformation of apo-fIscU to FeS-fIscU in vitro
Validation of FeS Cluster Formation Assay
As purified, wild-type fIscU is in the apo-state, as evident by spectrophotometric analysis of the sample and the absence of a CD signal at 560 nm, a region phenotypic of FeS clusters. Upon addition of reduced Fe and S to apo-Isu, de novo FeS-cluster formation can be observed.7 Recently, concerns have been raised regarding the traditional spectroscopic methodology used for monitoring FeS-cluster formation on Isu.7, 45 Notably, the use of DTT as a reducing agent was associated with the formation of a secondary iron containing high-molecular weight species (HMWS).34 HMWS is likely an insoluble FeS-mineral not associated to protein and distinct from a FeS-cluster in its character. In order to address these concerns, we optimized our method for monitoring conversion of apo- to the FeS-cluster loaded fIscU species in optimal yield and with minimal formation of this secondary FeS-mineral species.
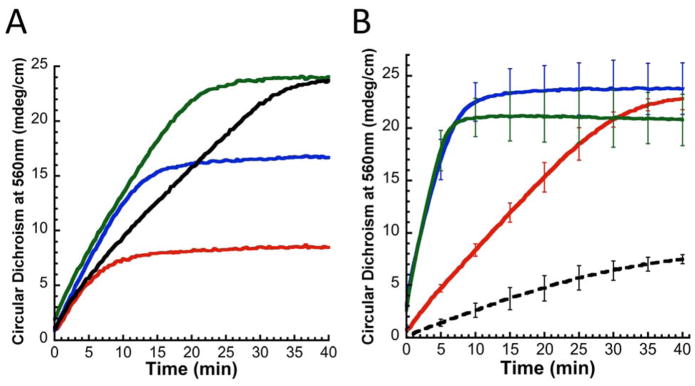
The preliminary hypothesis was that FeS-mineral formation would not affect FeS-fIscU formation, as measured by CD, because unlike with visible absorption spectroscopy, CD spectroscopy is not sensitive to the HMWS. Therefore, to assess potential formation of FeS-mineral, we monitored various FeS-Isu reaction conditions via visible absorption spectroscopy for a non-specific increase in light scattering (Figure 6). To quantify the amount of light scattering, we measured Vis absorbance at 700 nm, a wavelength sufficiently distinct from the 456 nm chromophore of a FeS-cluster. FeS-mineral formation is increased when Isu is excluded (Figure 6, solid black) and decreased when the iron-chelator EDTA is added (Figure 6, dashed black), suggesting that FeS-mineral formation is related to the presence of free Fe2+ in the reaction. In support of this hypothesis, addition of excess Fe2+ unexpectedly inhibits FeS-fIscU formation (Figure 8A and Supporting Figure 2). Keeping in mind that under these conditions, production of reduced sulfur is the rate-limiting step of FeS-Isu formation, we hypothesize that free Fe2+ can bind reduced sulfur from Nfs1-Isd11 to produce FeS-mineral. This inhibitory effect from excess Fe has been previously observed but not clarified in molecular detail.14,45 Under these conditions, there is little (<0.05 AU) increase in light scattering at this wavelength, suggesting FeS-mineralization is minimal. Interestingly, when Fe is present in excess under these conditions, the same yield of FeS-fIscU is achieved, suggesting free Fe inhibits but does not abolish FeS-cluster formation on fIscU.
Figure 6.
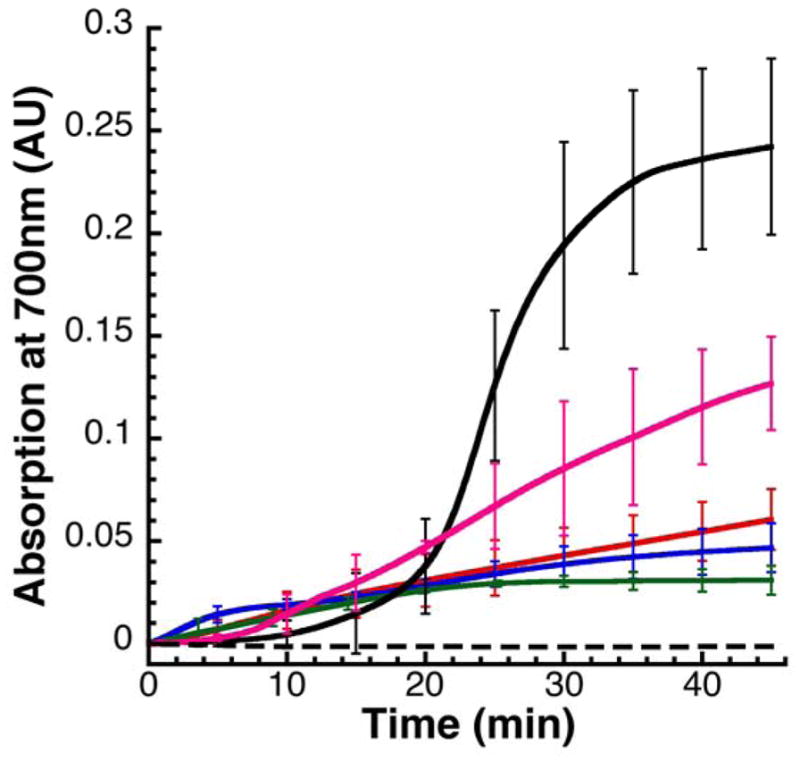
Increase in light scattering observed during FeS-Isu formation reaction, as estimated by the increase in absorbance at 700 nm under various reaction conditions: yIsu1 (red), fIscU (blue), fIscU with Yfh1 (green), No Isu (black solid), No Isu with Yfh1 (pink), No Isu with EDTA (black dashed). Note that minimal FeS-mineralization is observed under optimal reaction conditions (red, blue, green).
Figure 8.
A) Change in Circular Dichroism signal at 560 nm for 50 μM fIscU monomer and 10 μM Nfs1-Isd11 monomer under varying Fe(II) concentrations: 25 μM (red), 50 μM (blue) 75 μM (green), 100 μM (black). Maximal yield at 1.5 x Fe suggests fIscU forms two FeS clusters per dimer. Free Fe2+ inhibits FeS-fIscU formation by facilitating FeS-mineralization. B) FeS-fIscU formation via 50 μM apo-fIscU in the presence of 10 μM Nfs1-Isd11 (black), 10 μM Nfs1-Isd11 and 10 μM Yfh1 (blue), and 10 μM Nfs1-Isd11, 10μM yIsu1, and 10μM Yfh1 (green); all proteins overexpressed in E. coli. The rate of FeS-fIscU formation increases in the presence of Yfh1 (blue) to a similar extent as observed with Yfh1 and yIsu1 (green). FeS-cluster formation using 50 μM apo-yIsu1 in place of 50 μM apo-fIscU is included as a comparison (black-dashed).
Characterization of FeS-cluster formation on fIscU
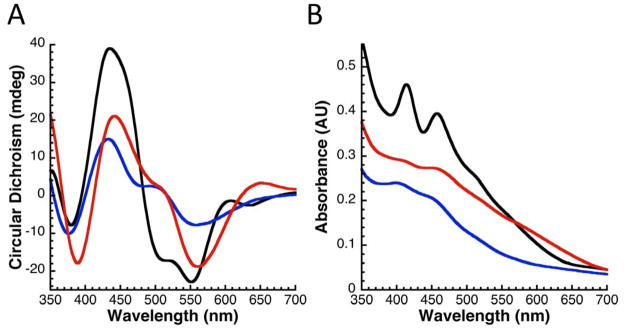
After validation of optimal solution conditions for assembly, the FeS-fIscU production pathway was characterized using UV/Vis and CD methodologies in a combined manner (Figure 7). The molar extinction coefficient determined for FeS-fIscU is 7.5 AU/mM*cm (visible) and 0.6 degrees/mM*cm (CD) at 456 nm. The CD spectrum for Yah1 (Figure 7, black), again an authentic Fe-S cluster containing protein, was used as a positive control of an FeS-cluster containing protein. Similarities in the visible absorption and CD spectra (Figure 7) suggest fIscU and yIsu1 both form a similar type of FeS-cluster as compared to that found in Yah1. Both fIscU and yIsu1 spectra have features similar to those seen in the Yah1 control (negative peaks at 390 nm and 560 nm, positive peak at 450 nm). The larger signal observed for fIscU, as compared to yIsu1, is likely representative of a higher specific activity for 2Fe-2S cluster production in the more stable fly ortholog since loading conditions between the proteins is equal.
Figure 7.
Circular dichroism (A) and visible absorption (B) spectra comparing FeS-fIscU (red) and FeS-yIsu1 (blue). Both fIscU and yIsu1 have similar CD features to an archetypical 2Fe-2S cluster from the yeast ferredoxin, Yah1 (black). All spectra represent 50 μM protein in a 1-cm path-length cuvette.
Cross-Reactivity of fIscU with yeast Nfs1-Isd11 and Yfh1
Our in vitro functional assay outlined above and tuned for optimal substrate/protein stoichiometry was used to assess the interaction of fIscU with other yeast ISC proteins. As expected, the amount of FeS-fIscU formed depends directly on the amount of Fe present (Figure 8A). Finally, maximal FeS-fIscU formation is demonstrated at 1.5 x Fe equivalents, which is less than the expected saturation at 2 x Fe equivalents for one 2Fe-2S cluster per fIscU monomer. Upon addition of Yfh1, significant stimulation (~ 3-fold) is observed for FeS-fIscU formation (Figure 8B, green). This stimulation is very similar to what was observed with yIsu1 (Figure 8B, blue), suggesting Yfh1 also stimulates cluster assembly in the presence of fIscU. Under physiologic salt concentrations (150 mM), Yfh1’s effect on FeS-cluster assembly is concentration dependent (Figure S1). Maximum Yfh1-mediated stimulation occurs at a Yfh1 concentration ~1/15th the Fe(II) concentration, but approximately equal to the Nfs1-Isd11 concentration. At higher Yfh1 concentrations, equimolar with fIscU under our reaction conditions, frataxin inhibits FeS-fIscU formation. This effect has also been observed with the D. melanogaster frataxin (unpublished data), however the extent is minimized under high-salt buffer conditions (500 mM NaCl). Therefore, in the FeS-fIscU formation assay, we used a sub-stoichiometric amount of Yfh1 (10 μM, matching Nfs1-Isd11 concentrations) to reach reaction conditions where frataxin stimulation is maximal. Finally, FeS-cluster formation can also be observed using yIsu1 (Figure 8B, black dashed), however, the yield is significantly lower possibly due to the instability of recombinant yIsu1.
In vivo replacement of yIsu1 with fIscU
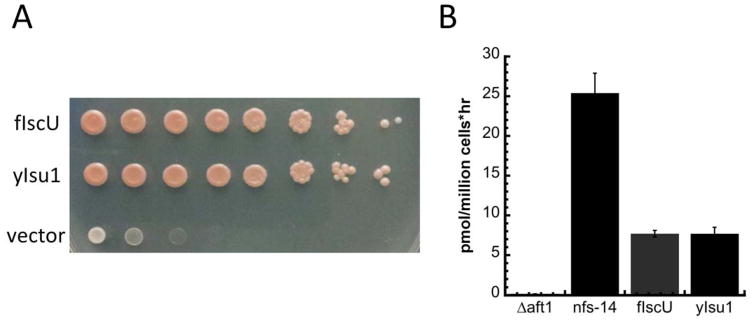
To test the physiological consequences of replacement of yIsu1 with fIscU in vivo, we engineered a yeast strain where native yIsu1 and yIsu2 were replaced by fIscU. To perform this experiment, the paralogous yeast Isu2 was deleted and the chromosomal yIsu1 was placed under control of the GAL1 promoter. The resulting Gal-Isu1 ΔyIsu2 strain can grow in raffinose/galactose, inducing for Gal-yIsu1 but not in glucose, repressing for Gal-yIsu1. The strain was transformed with empty plasmid YCplac22, with fIscU targeted to mitochondria or with yIsu1, and expression of Gal-yIsu1 was shut down by shifting the cells to glucose as the carbon source. As shown in Figure 9A, fIscU conferred normal growth similar to yIsu1, whereas empty plasmid conferred minimal growth consistent with the essentiality of Isu1 or Isu2.
Figure 9.
In vivo rescue of strain lacking yIsu1 by expression of fIscU. A) Growth of GAL-Isu1/Δisu2 strain transformed with either the empty YCplac22 plasmid or YCplac22 carrying the mitochondrial targeted fIscU gene or the yeast Isu1 gene. Transformants were compared by spotting serial 10-fold dilutions of 106 cells on CSM-TRP/Glucose plates and photographing four days later. yIsu1 and fIscU show equivalent complementing activity. B) Cellular iron uptake for fIscU and yIsu1 complemented GAL-Isu1/Δisu2 strain. The strain with the empty plasmid did not grow and so iron uptake could not be assessed. Iron uptake was measured for 1 hour in sodium citrate buffer. Other mutants served as controls for high uptake activity (nfs1-14) and low uptake activity (Δaft1).
Iron uptake at the cellular level correlates strongly with mitochondrial FeS-cluster assembly activity,46 and therefore we analyzed the high affinity cellular iron uptake of both strains using 55Fe (Figure 9B). Controls were provided by a nfs1-14 mutant with a missense NFS1 allele (I191S)47 showing increased iron uptake activity, and the Δaft1 deletion strain with low iron uptake activity. These data show that the fIscU and yIsu1 complemented strains have equivalent cellular iron uptake activities, suggesting that they might have similar Fe-S cluster assembly activities.
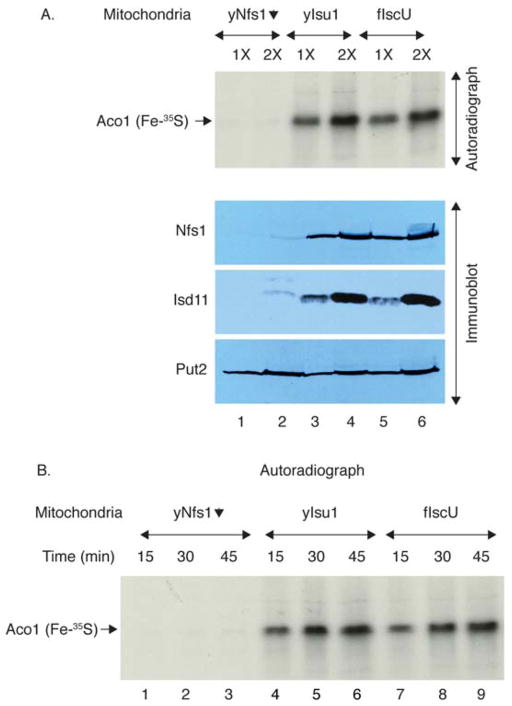
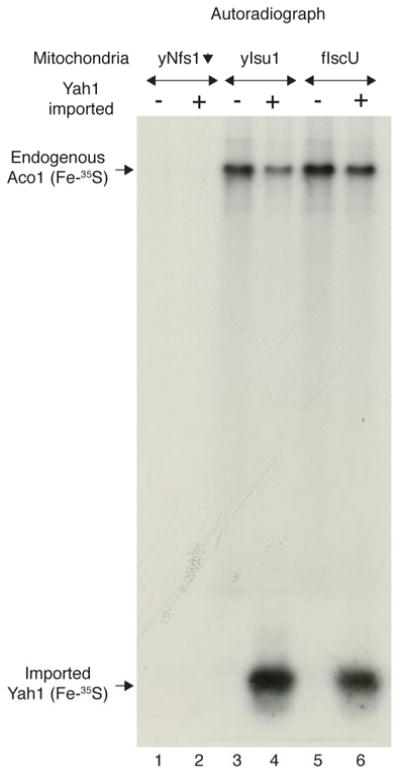
Mitochondria from the yeast strains expressing exclusively yIsu1 or fIscU were then isolated and directly compared in terms of Fe-S cluster assembly activities (Figure 10). A small population of apo-aconitase is present in mitochondria. When supplemented with 35S-cysteine, the endogenous apo-aconitase can be efficiently loaded via the mitochondrial Fe-S cluster biosynthesis machinery creating Aco1 (Fe-35S) that can be detected by native gel and autoradiography. 38 Thus, isolated and intact mitochondria containing either yIsu1 or fIscU were incubated with 35S-cysteine, allowing formation of radiolabeled Fe-35S clusters on aconitase. The newly formed and radiolabeled Fe-35S clusters on aconitase were virtually equivalent in yIsu1 or fIscU expressing mitochondria, showing equal dependence on the amount of mitochondria (Figure 10A, top panel, autoradiograph), and the time allowed for Fe-S cluster formation (Figure 10B, autoradiograph). The Gal-Nfs1 repressed mitochondria, lacking Nfs1 protein (Figure 10A, bottom panel, immunoblot, lanes 1 and 2), served as a negative control since in the setting of diminished Nfs1 protein, Fe-S cluster loading was practically undetectable (Figure 10A, top panel, autoradiograph, lanes 1 and 2). Two broad categories of Fe-S cluster proteins are 4Fe4S clusters such as aconitase and 2Fe2S clusters such as ferredoxin, and these may use different assembly routes. 48 Therefore, the activities of yIsu1 and fIscU expressing mitochondria were also compared in terms of formation of 2Fe-2S clusters. Apo-ferredoxin (Yah1) imported into isolated yIsu1 or fIscU mitochondria in the presence of 35S-cysteine showed strong signals for newly radiolabeled 2Fe-2S cluster formation in both cases (Figure 11). In summary, yIsu1 and fIscU mitochondria exhibit strong and virtually equivalent Fe-S cluster loading capabilities for both 4Fe4S proteins (aconitase) and 2Fe2S proteins (ferredoxin).
Figure 10.
A) Fe-S cluster assembly on endogenous aconitase (Aco1); dependence on Nfs1 activity and mitochondrial amounts. Top panel: Mitochondria isolated from Gal-Nfs1 repressed cells (lanes 1 and 2), or Gal-Isu1/Δisu2 repressed cells expressing exclusively yIsu1 (lanes 3 and 4) or fIscU (lanes 5 and 6) were tested for FeS cluster-forming activity. Mitochondria (1X = 100 μg of proteins) were incubated with 35S-cysteine for 45 min, recovered, and then the soluble proteins of mitochondria were separated by native gel and viewed by autoradiography. The signal represents holo-aconitase [Aco1 (Fe-35S)]. Bottom panel: Immunoblots showing protein levels of Nfs1, Isd11, and Put2 (loading control) from these mitochondria. B) Kinetics of 4Fe4S cluster assembly on endogenous aconitase. As in (A) above, mitochondria were analyzed for time dependence of Fe-35S labeled aconitase formation at 15, 30 and 45 min.
Figure 11.
Simultaneous 2Fe2S and 4Fe4S cluster assembly. Isolated mitochondria were incubated without (lanes 1, 3 and 5) or with (lanes 2, 4 and 6) urea-denatured Yah1 (ferredoxin) precursor protein. All reaction mixtures contained 35S-cysteine. The radiolabeled 4Fe4S clusters on endogenous Aco1 (lanes 3–6) and radiolabeled 2Fe-235S clusters on newly imported Yah1 (lanes 4 and 6) were detected by native gel and autoradiography. Note both yIsu1 and fIscU expressing mitochondria efficiently formed new 2Fe2S and 4Fe4S clusters.
CONCLUSIONS
It is not surprising that the yeast and fly scaffold proteins are so similar in their molecular details. The transition from an anaerobic to aerobic environment 3 billion years ago necessitated evolution of molecules within pathways that would continue to remain functional, while at the same time protect the solubility and redox activity of iron to continue to promote assembly of FeS-clusters; at this point in the evolutionary scale FeS-clusters were already ancient and highly utilized in life. Given the close similarity between fly and yeast Isu orthologs, based on their sequence homology, similar structure, and activity towards FeS-cluster assembly, what is surprising is the difference in stability between the actual fIscU and yIsu1 proteins. The high stability of fIscU makes this protein an excellent candidate for utilization when studying molecular details of the ISC pathway.
Metal binding properties of fIscU, as compared to yIsu1, are consistent with the presumed role of both proteins as the scaffold for de novo 2Fe-2S cluster synthesis. Consistent results from two independent Fe-binding methods provide confidence that the binding interaction between Fe(II) and fIscU is within the micromolar to nanomolar range. Fe-binding parameters for fIscU, obtained from our chelation assay, match very closely to the value we reported with our chelation assay for yIsu1.28 Binding constants from the competition assay are close but slightly tighter to values obtained from our initial isothermal titration calorimetric values published previously,15 indicating that competition provides a better evaluation for how these proteins likely bind metal in vivo. Interestingly, the structural characterization of iron bound to fIscU by XAS confirmed that the fly protein binds Fe(II) initially at a site devoid of sulfur ligation; a similar initial iron binding site was observed for the yIsu128 as well as the human and bacterial orthologs (manuscript in preparation). These data indicate IscU orthologs bind iron initially at a site independent of the protein’s cysteine rich active site. Identification of specific residues at this initial site is currently under investigation. However, once both iron and sulfur are provided to the scaffold, as is the case for FeS-fIscU, these data are consistent with the majority of the iron coordinated as a FeS-cluster.24,25 This results suggest a model where Fe translocates from an initial Fe-binding site to the FeS-cluster assembly site after or concurrent with accepting persulfide sulfur from Nfs1. The pattern of Fe-N, Fe-S, and Fe-Fe scattering in the FeS-fIscU EXAFS is consistent with the expected FeS-cluster coordination at the active site of fIscU, which contains three cysteines and one histidine, although the high coordination number for the Fe-O/N environment could suggest a portion of the metal still exists at the initial metal-binding site. This is in contrast to our cluster containing control protein Yah1, which has a 4 cysteine coordination environment ligating its tightly bound FeS cluster.49 Finally, iron-ligand bond lengths we observe are similar to those reported for Fe(II)-binding proteins from other biological systems50, 51 and to bond lengths we previously reported for yIsu1.15
With regards to FeS-cluster biosynthesis, our data show maximal FeS-fIscU formation is observed at 1.5 x Fe equivalents per Isu molecule, a value less than the expected saturation value of 2 x Fe equivalents for a single 2Fe-2S cluster per fIscU monomer. Incomplete homogeneity of our isolated recombinant fIscU is likely the cause of nonstoichiometric assembly. Considering our SDS-PAGE gel characteristics (Figure 2A), fIscU is likely ~95% pure, and from our activity measurements ~80% active as isolated which, taken together, would likely account for FeS-fIscU saturation at 1.5 x Fe equivalents. Strategies to increase the fraction of active protein in fIscU >80% have been unsuccessful. Considering the incomplete activity of recombinant fIscU, Figure 8A suggests that a single 2Fe-2S cluster forms per fIscU monomer, in agreement with findings for the bacterial and human Isu1 orthologs.7, 34 Under Fe-limiting conditions, there is only a slight (<0.05 AU) increase in non-specific light scattering, suggesting that adverse FeS chemistry was minimal in our activity assay (Figure 6).
As noted by several labs, clarification of FeS-cluster assembly kinetics and the molecular involvement of proteins within the ISC pathway have been hindered by heterogeneity in the FeS-Isu product formation, which has been shown to vary under different reaction conditions. Specifically with regards to substrate concentrations, production of a high molecular weight species consisting of both iron and sulfur can divert substrate from intended product.34,35 Our results confirm that limiting the amount of free Fe(II) available in solution dramatically reduces the extent of FeS-mineralization. Regarding the stoichiometry of the ISC protein partners, our results indicate that limiting Yfh1 levels to be stoichiometric with Nfs1-Isd11 causes the maximal frataxin induced stimulation in FeS-cluster assembly activity, consistent with previously published reports on the mammalian system.14 Under elevated stoichiometric abundance, excess frataxin has a negative impact on cluster assembly. These data are consistent with observations that show overexpression of Yfh1 in vivo causes a reduction in FeS-cluster synthesis52 and that frataxin can contribute to diverting activated sulfur towards persulfuration of thiols.14 Finally, using excess Isu and limiting Nfs1-Isd11 are important for driving FeS-Isu formation, indicating Isu in complex with Nfs1/Isd11 likely can transfer cluster to the excess unbound Isu under in vitro assembly conditions, as previously suggested.34
Combined, our results suggest a model where optimal in vitro FeS-Isu formation conditions (i.e., low Nfs1-Isd11 concentrations, high concentration of Isu, limiting concentrations of Fe) enable a high yield of FeS-fIscU formation with minimal side reactions (Figure 12). In this model, free Fe is able to bind reduced sulfur, preventing sulfur transfer to Fe-Isu, and thus inhibiting FeS-Isu formation. This model agrees with the presumed in vivo environment, where substrate concentration must be tightly regulated to help control cluster assembly, as both Fe and S substrates are toxic in excess. In addition, the stability of the formed cluster is likely enhanced by the distribution of cluster chaperone proteins that accept and deliver the synthesized FeS-clusters to recipient proteins downstream to assembly. Further regulation within the ISC pathway is provided by control at the genetic level where expression of the ISC genes occurs at levels that optimize activity. Establishing these optimal relative stoichiometries in vitro therefore provides direct insight into conditions of maximal efficiency that likely exist in vivo.
Figure 12.
Model for competing FeS-Isu (black arrows) and FeS mineralization (gray arrows) pathways. The persulfide from Nfs1-Isd11 does not have a strong preference for Fe2+-Isu over free Fe2+, resulting in competition between these two reactions when free Fe2+is present.
Finally, the physiological consequence of using fIscU in combination with/in replacement of the yeast proteins in vitro has been tested in vivo for validation that there are no species specific effects that would dissuade using fly Isu in combination with the yeast proteins within our yeast activity assay. In vivo studies show fIscU completely complements yeast lacking Isu1 and Isu2. In vitro, the behavior of fIscU is superior to yIsu1, likely as a result of the high stability of the fly protein. Our biophysical characterization studies showed the similarity in many physical properties between the yeast and fIscU proteins, however the stability and functional activity of the fly ortholog are far superior to those for the yeast protein. Given our finding that excess Isu is necessary to drive multiple Nfs1 turnovers within the yeast reaction system and since fIscU can easily function as recipients for clusters, fIscU appears to be a better recipient of the cluster to help characterize the molecular interactions with the pathway. The in vitro data coupled with our in vivo findings therefore validates the use of the fly protein to help us elucidate the molecular details of the ISC pathway in yeast.
Supplementary Material
Acknowledgments
This work was supported by funds for S.P.D. from the American Heart Association and the Friedreich’s Ataxia Research Alliance (14PRE18830036), and funds from the National Institutes of Health for S.P.D (F30 DK101230), D.P. (GM107542), A.D. (DK53953) and T.L.S. (DK068139). Portions of this research were carried out at the Stanford Synchrotron Radiation Lightsource (SSRL). SSRL is a national user facility operated by Stanford University on behalf of the U.S. Department of Energy, Office of Basic Energy Sciences. The SSRL Structural Molecular Biology Program is supported by the Department of Energy, Office of Biological and Environmental Research, and by the NIH, National Center for Research Resources, Biomedical Technology Program. We thank Alok Pandey for help with figures.
ABBREVIATIONS
- XAS
x-ray absorption spectroscopy
- XANES
x-ray absorption near edge spectroscopy
- EXAFS
extended x-ray absorption fine structure
- ITC
isothermal titration calorimetry
- CD
circular dichroism
- NFU
normalized fluorescence units
Footnotes
Author Contributions
The manuscript was written through contributions of all authors. All authors have given approval to the final version of the manuscript.
References
- 1.Campuzano V, Montermini L, Molto MD, Pianese L, Cossee M, Cavalcanti F, Monros E, Rodius F, Duclos F, Monticelli A, Zara F, Canizares J, Koutnikova H, Bidichandani SI, Gellera C, Brice A, Trouillas P, De Michele G, Filla A, De Frutos R, Palau F, Patel PI, Di Donato S, Mandel JL, Cocozza S, Koenig M, Pandolfo M. Science. 1996;271:1423–1427. doi: 10.1126/science.271.5254.1423. [DOI] [PubMed] [Google Scholar]
- 2.Lodi R, Tonon C, Calabrese V, Schapira AH. Antioxid Redox Signal. 2006;8:438–443. doi: 10.1089/ars.2006.8.438. [DOI] [PubMed] [Google Scholar]
- 3.Mochel F, Haller RG. Myopathy with Deficiency of ISCU. In: Pagon RA, Adam MP, Ardinger HH, Wallace SE, Amemiya A, Bean LJH, Bird TD, Dolan CR, Fong CT, Smith RJH, Stephens K, editors. Gene Reviews(R) Seattle (WA): 1993. [Google Scholar]
- 4.Mochel F, Knight MA, Tong WH, Hernandez D, Ayyad K, Taivassalo T, Andersen PM, Singleton A, Rouault TA, Fischbeck KH, Haller RG. Am J Hum Genet. 2008;82:652–660. doi: 10.1016/j.ajhg.2007.12.012. [DOI] [PMC free article] [PubMed] [Google Scholar]
- 5.Lill R, Srinivasan V, Muhlenhoff U. Curr Opin Microbiol. 2014;22:111–119. doi: 10.1016/j.mib.2014.09.015. [DOI] [PubMed] [Google Scholar]
- 6.Lill R. Nature. 2009;460:831–838. doi: 10.1038/nature08301. [DOI] [PubMed] [Google Scholar]
- 7.Agar JN, Krebs C, Frazzon J, Huynh BH, Dean DR, Johnson MK. Biochemistry. 2000;39:7856–7862. doi: 10.1021/bi000931n. [DOI] [PubMed] [Google Scholar]
- 8.Gerber J, Neumann K, Prohl C, Muhlenhoff U, Lill R. Mol Cell Biol. 2004;24:4848–4857. doi: 10.1128/MCB.24.11.4848-4857.2004. [DOI] [PMC free article] [PubMed] [Google Scholar]
- 9.Urbina HD, Silberg JJ, Hoff KG, Vickery LE. J Biol Chem. 2001;276:44521–44526. doi: 10.1074/jbc.M106907200. [DOI] [PubMed] [Google Scholar]
- 10.Wiedemann N, Urzica E, Guiard B, Muller H, Lohaus C, Meyer HE, Ryan MT, Meisinger C, Muhlenhoff U, Lill R, Pfanner N. EMBO J. 2006;25:184–195. doi: 10.1038/sj.emboj.7600906. [DOI] [PMC free article] [PubMed] [Google Scholar]
- 11.Webert H, Freibert SA, Gallo A, Heidenreich T, Linne U, Amlacher S, Hurt E, Muhlenhoff U, Banci L, Lill R. Nat Commun. 2014;5:5013. doi: 10.1038/ncomms6013. [DOI] [PubMed] [Google Scholar]
- 12.Bridwell-Rabb J, Fox NG, Tsai CL, Winn AM, Barondeau DP. Biochemistry. 2014;53:4904–4913. doi: 10.1021/bi500532e. [DOI] [PMC free article] [PubMed] [Google Scholar]
- 13.Pandey A, Gordon DM, Pain J, Stemmler TL, Dancis A, Pain D. J Biol Chem. 2013;288:36773–36786. doi: 10.1074/jbc.M113.525857. [DOI] [PMC free article] [PubMed] [Google Scholar]
- 14.Parent A, Elduque X, Cornu D, Belot L, LeCaer J-P, Grandas A, Toledano MB, D’Autreaus B. Nature Communications. 2015;6:5686. doi: 10.1038/ncomms6686. [DOI] [PubMed] [Google Scholar]
- 15.Cook JD, Kondapalli KC, Rawat S, Childs WC, Murugesan Y, Dancis A, Stemmler TL. Biochemistry. 2010;49:8756–8765. doi: 10.1021/bi1008613. [DOI] [PMC free article] [PubMed] [Google Scholar]
- 16.Kondapalli KC, Kok NM, Dancis A, Stemmler TL. Biochemistry. 2008;47:6917–6927. doi: 10.1021/bi800366d. [DOI] [PMC free article] [PubMed] [Google Scholar]
- 17.Delewski W, Paterkiewicz B, Manicki M, Schilke B, Tomiczek B, Ciesielski SJ, Nierzwicki L, Czub J, Dutkiewicz R, Craig EA, Marszalek J. Mol Biol Evol. 2016;33:643–656. doi: 10.1093/molbev/msv254. [DOI] [PMC free article] [PubMed] [Google Scholar]
- 18.Shakamuri P, Zhang B, Johnson MK. J Am Chem Soc. 2012;134:15213–15216. doi: 10.1021/ja306061x. [DOI] [PMC free article] [PubMed] [Google Scholar]
- 19.Mapolelo DT, Zhang B, Randeniya S, Albetel AN, Li H, Couturier J, Outten CE, Rouhier N, Johnson MK. Dalton Trans. 2013;42:3107–3115. doi: 10.1039/c2dt32263c. [DOI] [PMC free article] [PubMed] [Google Scholar]
- 20.Bridwell-Rabb J, Iannuzzi C, Pastore A, Barondeau DP. Biochemistry. 2012;51:2506–2514. doi: 10.1021/bi201628j. [DOI] [PMC free article] [PubMed] [Google Scholar]
- 21.Tan S. Protein Expr Purif. 2001;21:224–234. doi: 10.1006/prep.2000.1363. [DOI] [PubMed] [Google Scholar]
- 22.Kleber-Janke T, Becker WM. Protein Expr Purif. 2000;19:419–424. doi: 10.1006/prep.2000.1265. [DOI] [PubMed] [Google Scholar]
- 23.Studier FW. Protein Expr Purif. 2005;41:207–234. doi: 10.1016/j.pep.2005.01.016. [DOI] [PubMed] [Google Scholar]
- 24.Strug I, Utzat C, Cappione A, 3rd, Gutierrez S, Amara R, Lento J, Capito F, Skudas R, Chernokalskaya E, Nadler T. J Anal Methods Chem. 2014;2014:657079. doi: 10.1155/2014/657079. [DOI] [PMC free article] [PubMed] [Google Scholar]
- 25.Sreerama N, Woody RW. Anal Biochem. 2000;287:252–260. doi: 10.1006/abio.2000.4880. [DOI] [PubMed] [Google Scholar]
- 26.Johnson WC. Proteins. 1999;35:307–312. [PubMed] [Google Scholar]
- 27.Provencher SW, Glockner J. Biochemistry. 1981;20:33–37. doi: 10.1021/bi00504a006. [DOI] [PubMed] [Google Scholar]
- 28.Rodrigues AV, Kandegedara A, Rotondo JA, Dancis A, Stemmler TL. Biometals. 2015;28:567–576. doi: 10.1007/s10534-015-9846-8. [DOI] [PMC free article] [PubMed] [Google Scholar]
- 29.Kuzmic P. Methods Enzymol. 2009;467:247–280. doi: 10.1016/S0076-6879(09)67010-5. [DOI] [PubMed] [Google Scholar]
- 30.George GN, George SJ, Pickering IJ. EXAFSPAK. Menlo Park, CA: 2001. http://www-ssrl.slac.stanford.edu/~george/exafspak/exafs.htm. [Google Scholar]
- 31.Cook JD, Bencze KZ, Jankovic AD, Crater AK, Busch CN, Bradley PB, Stemmler AJ, Spaller MR, Stemmler TL. Biochemistry. 2006;45:7767–7777. doi: 10.1021/bi060424r. [DOI] [PMC free article] [PubMed] [Google Scholar]
- 32.George GN, Hedman B, Hodgson KO. Nat Struct Biol. 1998;5(Suppl):645–647. doi: 10.1038/1336. [DOI] [PubMed] [Google Scholar]
- 33.Cotelesage JJ, Pushie MJ, Grochulski P, Pickering IJ, George GN. J Inorg Biochem. 2012;115:127–137. doi: 10.1016/j.jinorgbio.2012.06.019. [DOI] [PubMed] [Google Scholar]
- 34.Fox NG, Chakrabarti M, McCormick SP, Lindahl PA, Barondeau DP. Biochemistry. 2015;54:3871–3879. doi: 10.1021/bi5014485. [DOI] [PMC free article] [PubMed] [Google Scholar]
- 35.Stephens PJ, Thomson AJ, Dunn JB, Keiderling TA, Rawlings J, Rao KK, Hall DO. Biochemistry. 1978;17:4770–4778. doi: 10.1021/bi00615a026. [DOI] [PubMed] [Google Scholar]
- 36.Yoon H, Knight SA, Pandey A, Pain J, Turkarslan S, Pain D, Dancis A. PLoS Genet. 2015;11:e1005135. doi: 10.1371/journal.pgen.1005135. [DOI] [PMC free article] [PubMed] [Google Scholar]
- 37.Seguin A, Santos R, Pain D, Dancis A, Camadro JM, Lesuisse E. J Biol Chem. 2011;286:6071–6079. doi: 10.1074/jbc.M110.163253. [DOI] [PMC free article] [PubMed] [Google Scholar]
- 38.Amutha B, Gordon DM, Dancis A, Pain D. Methods Enzymol. 2009;456:247–266. doi: 10.1016/S0076-6879(08)04414-5. [DOI] [PubMed] [Google Scholar]
- 39.Shimomura Y, Kamikubo H, Nishi Y, Masako T, Kataoka M, Kobayashi Y, Fukuyama K, Takahashi Y. J Biochem. 2007;142:577–586. doi: 10.1093/jb/mvm163. [DOI] [PubMed] [Google Scholar]
- 40.Kim JH, Tonelli M, Kim T, Markley JL. Biochemistry. 2012;51:5557–5563. doi: 10.1021/bi300579p. [DOI] [PMC free article] [PubMed] [Google Scholar]
- 41.Randall CR, Zang Y, True AE, Que L, Jr, Charnock JM, Garner CD, Fujishima Y, Schofield CJ, Baldwin JE. Biochemistry. 1993;32:6664–6673. doi: 10.1021/bi00077a020. [DOI] [PubMed] [Google Scholar]
- 42.Chen CJ, Lin YH, Huang YC, Liu MY. Biochem Biophys Res Commun. 2006;349:79–90. doi: 10.1016/j.bbrc.2006.07.205. [DOI] [PubMed] [Google Scholar]
- 43.Mena NP, Bulteau AL, Salazar J, Hirsch EC, Nunez MT. Biochem Biophys Res Commun. 2011;409:241–246. doi: 10.1016/j.bbrc.2011.04.137. [DOI] [PubMed] [Google Scholar]
- 44.Colpas GJ, Maroney MJ, Bagyinka C, Kumar M, Willis WS, Suib SL, Baidya N, Mascharak PK. Inorg Chem. 1991;30:920–928. [Google Scholar]
- 45.Dutkiewicz R, Marszalek J, Schilke B, Craig EA, Lill R, Muhlenhoff U. J Biol Chem. 2006;281:7801–7808. doi: 10.1074/jbc.M513301200. [DOI] [PubMed] [Google Scholar]
- 46.Muhlenhoff U, Hoffmann B, Richter N, Rietzschel N, Spantgar F, Stehling O, Uzarska MA, Lill R. Eur J Cell Biol. 2015;94:292–308. doi: 10.1016/j.ejcb.2015.05.003. [DOI] [PubMed] [Google Scholar]
- 47.Li J, Kogan M, Knight SA, Pain D, Dancis A. J Biol Chem. 1999;274:33025–33034. doi: 10.1074/jbc.274.46.33025. [DOI] [PubMed] [Google Scholar]
- 48.Sheftel AD, Wilbrecht C, Stehling O, Niggemeyer B, Elsasser HP, Muhlenhoff U, Lill R. Mol Biol Cell. 2012;23:1157–1166. doi: 10.1091/mbc.E11-09-0772. [DOI] [PMC free article] [PubMed] [Google Scholar]
- 49.Qi W, Cowan JA. Coord Chem Rev. 2011;255:688–699. doi: 10.1016/j.ccr.2010.10.016. [DOI] [PMC free article] [PubMed] [Google Scholar]
- 50.Sazinsky MH, LeMoine B, Orofino M, Davydov R, Bencze KZ, Stemmler TL, Hoffman BM, Arguello JM, Rosenzweig AC. J Biol Chem. 2007;282:25950–25959. doi: 10.1074/jbc.M703311200. [DOI] [PMC free article] [PubMed] [Google Scholar]
- 51.Traverso ME, Subramanian P, Davydov R, Hoffman BM, Stemmler TL, Rosenzweig AC. Biochemistry. 2010;49:7060–7068. doi: 10.1021/bi100866b. [DOI] [PMC free article] [PubMed] [Google Scholar]
- 52.Seguin A, Bayot A, Dancis A, Rogowska-Wrzesinska A, Auchere F, Camadro JM, Bulteau AL, Lesuisse E. Mitochondrion. 2009;9:130–138. doi: 10.1016/j.mito.2009.01.007. [DOI] [PubMed] [Google Scholar]
Associated Data
This section collects any data citations, data availability statements, or supplementary materials included in this article.


