

Abstract
Background
Industrial discharges of perfluorooctanoic acid (PFOA) to the Ohio River, contaminating water systems near Parkersburg, WV, were previously associated with nearby residents’ serum PFOA concentrations above US general population medians. Ohio River PFOA concentrations downstream are elevated, suggesting Mid-Ohio River Valley residents are exposed through drinking water.
Objectives
Quantify PFOA and 10 other per- and polyfluoroalkyl substances (PFAS) in Mid-Ohio River Valley resident sera collected between 1991 and 2013 and determine whether the Ohio River and Ohio River Aquifer are exposure sources.
Methods
We measured eleven PFAS in 1608 sera from 931 participants. Serum PFOA concentration and water source associations were assessed using linear mixed-effects models. We estimated between-sample serum PFOA using one-compartment pharmacokinetics for participants with multiple samples.
Results
In serum samples collected as early as 1991, PFOA (median=7.6ng/mL) was detected in 99.9% of sera; 47% had concentrations greater than US population 95th percentiles. Five other PFAS were detected in greater than 82% of samples; median other PFAS concentrations were similar to the US general population. Serum PFOA was significantly associated with water source, sampling year, age at sampling, tap water consumption, pregnancy, gravidity and breastfeeding. Serum PFOA was 40–60% lower with granular activated carbon (GAC) use. Repeated measurements and pharmacokinetics suggest serum PFOA peaked 2000–2006 for participants using water without GAC treatment; where GAC was used, serum PFOA concentrations decreased from 1991 to 2012.
Conclusions
Mid-Ohio River Valley residents appear to have PFOA, but not other PFAS, serum concentrations above US population levels. Drinking water from the Ohio River and Ohio River Aquifer, primarily contaminated by industrial discharges 209–666 kilometers upstream, is likely the primary exposure source. GAC treatment of drinking water mitigates, but does not eliminate, PFOA exposure.
Keywords: Biomonitoring, Drinking water contaminants, Granular activated carbon (GAC), Per- and polyfluoroalkyl substances (PFAS), Pharmacokinetic modeling
Introduction
Perfluoroalkyl and polyfluoroalkyl substances (PFAS) are industrial chemicals used for stain, stick- and water-resistant coatings, food contact papers, firefighting foams, metal plating, semiconductors and photographics/photolithographics (Buck et al., 2011; Lau et al., 2007). Perfluorooctanoic acid (PFOA) and perfluorooctanesulfonic acid (PFOS) are the most widely studied PFAS. 2,610–21,400 tons of carboxyl PFAS were emitted to the environment 1951–2015; up to 6420 more will be emitted by 2030 (Wang et al., 2014). US PFAS manufacturers reduced PFOA emissions 91–100% by 2014 (United States Environmental Protection Agency, 2015a), but production continues internationally.
Since 1999–2000, US population serum PFAS concentrations, measured by the National Health and Nutrition Examination Survey (NHANES), have steadily decreased; median 2011–2012 concentrations were 2.08 ng/mL (PFOA) and 6.53 ng/mL (PFOS) (CDC, 2015). Food, drinking water and house dust are major exposure sources (D’Hollander et al., 2010). Children are also exposed during pregnancy and through breastfeeding (Liu et al., 2011). Industrial PFAS discharges can contaminate municipal source waters (Holzer et al., 2008), and contaminated water may be the most important environmental PFAS exposure source (Ericson et al., 2008).
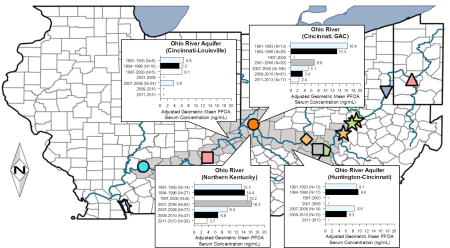
Mid-Ohio River Valley (Huntington, WV to Louisville, KY, Figure 1) residents may be exposed to PFAS, especially PFOA, through contaminated drinking water from the Ohio River or Ohio River Aquifer. Serum PFOA concentrations above NHANES medians were reported in the C-8 Health Project cohort in Parkersburg, WV (Emmett et al., 2006), and two Cincinnati cohorts, the Breast Cancer and the Environment Research Project (BCERP) Puberty Study (Pinney et al., 2014), and the Health Outcomes and Measures of the Environment (HOME) study (Kato et al., 2014; Braun et al., 2016). Serum PFOA concentrations were significantly associated with water utility (Pinney et al., 2014) or Ohio River Aquifer use (Emmett et al., 2006). The Ohio River Aquifer in the C-8 study area was contaminated by industrial PFOA discharges to the Ohio River (Paustenbach et al., 2007). September 2009 downstream Ohio River PFOA concentrations were 9.2–19.1ng/L; historical PFOA concentrations were higher (Paustenbach et al., 2007). PFAS exposure may be reduced by granular activated carbon filtration (GAC). Some Ohio River Valley utilities use GAC, and GAC has reduced PFOA concentrations in other municipal water systems (Rahman et al., 2014). GAC use was associated with lower resident serum PFOA concentrations, although some were still above US general population medians (Pinney et al., 2014; Bartell et al., 2010).
Figure 1. The Ohio River Valley.

To assess exposure to PFAS in Mid-Ohio River Valley residents, we measured the concentrations of 11 different PFAS in sera collected between 1991 and 2013. PFOA concentrations between serum measurements were estimated for participants with multiple serum samples using pharmacokinetic models. We evaluated PFOA and water source associations using mixed-effects statistical models to determine whether the Ohio River and Ohio River Aquifer are significant PFOA exposure sources for residents of the Mid-Ohio River Valley.
Materials and Methods
Study Population
This analysis included participants from the Fernald Community Cohort (FCC), Ohio River Valley (ORV) Study and BCERP Puberty Study Cincinnati site cohort. FCC adult participants were recruited from residents living <8km from a uranium plant 32 km northwest of Cincinnati, primarily between 1990–1994; follow-up continued through 2008. Eligibility, design and participant characteristics were described previously (Wones et al., 2009; FCC website). Cohort members were eligible for inclusion in this study if they lived in zip codes bordering the Ohio River from Gallipolis, OH to Southeast Indiana sometime between 1980 and 2008 (Figure 1). An additional 20 members of the remaining FCC cohort were included because they had nuclear family members living between Parkersburg, WV and Cincinnati, OH during those years. A total of 450 FCC cohort members were contacted in 2011–2014 for additional residential history and beverage consumption data collection.
We recruited ORV participants between 2009 and 2012 from medical practices in Huntington, Portsmouth, OH, and Cincinnati suburbs; some family members of BCERP participants were included. Participants were eligible if they had lived in the area for 2 or more years and were aged 2–85 years. ORV participants were not followed-up. BCERP participants were recruited as girls aged 6–8 years from Greater Cincinnati schools and Breast Cancer Registry of Greater Cincinnati participant families between 2004 and 2007. Follow-up continued until 2015. Study design and participant characteristics were previously described (Biro et al., 2010). Institutional review boards (IRB) at the University of Cincinnati and Cincinnati Children’s Hospital Medical Center approved study protocols. Participant/parent consent and child assent were obtained. The Centers for Disease Control and Prevention (CDC) IRB approved the analysis of serum specimens with no personal identifiers for BCERP. For FCC and ORV, CDC laboratory involvement did not constitute engagement in human subjects research because samples were completely de-identified.
Serum Samples and Analysis
We obtained serum at baseline, second and/or final medical exam from FCC participants (1991–2008), at recruitment for ORV participants (2009–2012), and annually for BCERP participants (2005–2013) using protocols and materials provided by CDC. Sera were stored at −80°C unti l analysis. All available samples for FCC and ORV participants were analyzed. All BCERP participants with blood samples had baseline samples measured. Subsequent samples from BCERP participants were analyzed if available.
CDC staff measured serum PFAS concentrations at various times between 2005 and 2014 using published methods (Kato et al., 2011; Kuklenyik et al., 2005). CDC measured 2-(N-ethyl-perfluorooctane sulfonamido) acetic acid (Et-PFOSA-AcOH or EtFOSAA), 2-(N-methyl perfluorooctane sulfonamido) acetic acid (Me-PFOSA-AcOH or MeFOSAA), perfluorohexane sulfonic acid (PFHxS) and perfluorononanoic acid (PFNA) in all samples. CDC measured total PFOA and total PFOS in ORV, FCC and baseline BCERP samples. Linear (n-PFOA) and non-linear (branched) PFOA and linear (n-PFOS), methyl (Σm-PFOS) and dimethyl (Σm2-PFOS) PFOS isomer concentrations were reported separately for non-baseline BCERP samples (collected 2006–2013); we calculated total PFOA and PFOS concentrations as the sums of their respective linear and branched isomers. Perfluorodecanoic acid (PFDeA) was not measured in the first 82 BCERP samples. Perfluorobutane sulfonic acid (PFBuS), perfluorododecanoic acid (PFDoA), perfluoroundecanoic acid (PFUA) and perfluorooctane sulfonamide (PFOSA or FOSAA) were not measured in all samples because more than 80% of results were below limits of detection (LOD) in initial analyses.
Covariates
Questionnaires, including demographics, beverage consumption, residential, medical and reproductive histories, were administered annually to adult participants and parents of minors (BCERP and FCC), or at recruitment (ORV). FCC participants answered additional residential history and beverage consumption questions when recontacted. Participants used glassware or life-size illustrations to estimate beverage consumption. FCC participants received medical exams every two (1997–2008) or three years (1990–1996). We collected anthropometrics at recruitment for ORV participants. Physical exams were administered semi-annually to BCERP participants until 2010, then annually. Calibrated stadiometers and scales were used for anthropometrics. We obtained participants’ residential histories from 1980 (those born before 1980) or birth (those born after) by interview (BCERC, ORV) or mailed questionnaire (FCC). We identified water utilities, sources, service areas, service dates and GAC use from 1980 to 2012 through utility and public record searches, resulting in 221 water source-time zones, served by 114 utilities, utilizing 23 water sources (Pinney et al., 2014). Water sources, durations and GAC treatment were identified for each residential address of each participant.
Statistical Analysis
Statistical analyses were conducted with SAS v9.2 (SAS Institute, Cary NC). PFAS concentrations were non-normal (skewness: 2.29–9.44) and log-transformed for analyses; LOD/√2 was imputed for values below LOD (Hornung and Reed, 1990). We calculated sample-weighted Pearson correlations and descriptive statistics for PFAS and water sources, and then estimated serum PFOA-covariate associations using two linear mixed-effects models with random subject effects (PROC MIXED).
Model 1 categorized participants’ water source at sample collection in eight groups: Ohio River in Huntington, Ashland/Ironton/Portsmouth, Northern Kentucky and Cincinnati, Ohio River Aquifer between Huntington-Cincinnati and Cincinnati-Louisville, the Great Miami Aquifer and all other water sources. Model 2 used participants’ cumulative years the Ohio River, with and without GAC, and Ohio River Aquifer were municipal water sources. Sample collection year, sex, age at sample collection, daily tap water consumption, bottled water use, water filter use, pregnancy status, reproductive history and breastfeeding were covariates. Race/ethnicity was not included in analyses because 93% of non-Caucasians used the same water utility. Water source was always included in regression models; other covariates were retained if significant or caused a 15% or greater change in water source effect estimates (backwards/stepwise elimination). Linear regression analyses for other PFAS with 80% or more results above the LOD were conducted using significant terms from PFOA models as covariates, similar to Pinney et al. (2014). We approximated model r2 as variance change between full/final and intercept-only models; intercept model random variance was constrained to that in full/final models.
Pharmacokinetics
Serum PFOA concentrations between samples were estimated using a one-compartment (serum) pharmacokinetic model for 508 participants from the FCC and BCERP cohorts with multiple samples (Thompson et al., 2010). Using this model, we examined two exposure scenarios. In Scenario 1, we assumed Ohio River PFOA concentrations from 1991 to 2013 were the same as those measured in September 2009 (Emery et al., 2010). In Scenario 2, we estimated annual PFOA Ohio River concentrations for 1991 to 2013 by linearly-interpolating between reported concentrations, assuming constant ratios between regions (Table S1). For both scenarios, we assumed aquifer-exchange or GAC treatment reduced PFOA concentrations by 50% and other source waters were uncontaminated. We used participant-reported tap water consumption for daily intake, and we assumed body weight changed linearly between measurements, to estimate PFOA dose from water utility PFOA concentration estimates. For both scenarios, non-water PFOA dose was estimated from NHANES median PFOA serum concentrations (CDC, 2015), assuming steady state. Because reported half-life estimates for PFOA vary widely, we conducted a sensitivity analysis; we calculated PFOA elimination constants using half-life estimates from 1.7 to 3.8 years, which cover estimates from the literature (Fu et al., 2016; Bartell et al., 2010; Brede et al., 2010; Olsen et al., 2007). We estimated model fit using Wilcoxon rank-sum tests on median difference, weighted kappa (κ) for PFOA quartile and interclass-correlations (ICCs), comparing predicted to subsequent measured serum PFOA concentration. Model fit statistics were calculated for all estimates, and separately by starting PFOA concentration (above/below the mean), and by cohort (FCC vs BCERP).
Results
Descriptive characteristics
931/1201 participants provided data (Table 1). 1608 separate serum samples were analyzed. Serum was collected in Huntington 2009–2010, Portsmouth 2009–2011, and Greater Cincinnati, and regions between Portsmouth and Louisville, 1991–2013. Participants were 15% African-American, 2% Hispanic, 1% Asian and 82% Caucasian. FCC participants were exclusively Caucasian; ORV participants were 96% Caucasian. FCC and ORV cohorts had similar ages at sample collection, tap water consumption, proportions of women ever pregnant and breastfeeding, mean gravidity and children breastfed per mother. ORV children were breastfed longer than BCERP participants. We identified water sources for 95% of participants’ addresses. 72.5% of participants used the Ohio River and 13.5% used the Ohio River Aquifer. Of those using the Ohio River, 37.2% always had GAC filtration, 44.7% never did, and 18.1% had GAC for some of the time their municipal utility used the Ohio River as a water source. Mean Ohio River water use was 7.5 years (range 0–32 years); mean Ohio River Aquifer water use was 1.2 years (range 0–32 years).
Table 1.
Participant Descriptive Characteristics
| Study Characteristic | FCC | ORV | BCERC | All three studies | |
|---|---|---|---|---|---|
| Participants with samples | 210 (22.6%) | 366 (39.3%) | 355 (38.1%) | 931 (100.0%) | |
| Serum samples | 517 (32.2%) | 366 (22.8%) | 725 (45.1%) | 1608 (100.0%) | |
| Mean sample interval (years) | 7.5±4.7 | - | 2.1 ±0.5 | 4.5±4.2 | |
| Sample collection year | |||||
| 1991–1993 | 139 (26.9%) | 0 (0.0%) | 0 (0.0%) | 139 (8.6%) | |
| 1994–1996 | 189 (36.6%) | 0 (0.0%) | 0 (0.0%) | 189 (11.8%) | |
| 1997–2000 | 40 (7.7%) | 0 (0.0%) | 0 (0.0%) | 40 (2.5%) | |
| 2001–2006 | 3 (0.6%) | 0 (0.0%) | 229 (31.6%) | 232 (14.4%) | |
| 2007–2008 | 146 (28.2%) | 0 (0.0%) | 320 (44.1%) | 466 (29.0%) | |
| 2009–2010 | 0 (0.0%) | 256 (69.9%) | 153 (21.1%) | 409 (25.4%) | |
| 2011–2013 | 0 (0.0%) | 110 (30.1%) | 23 (3.2%) | 133 (8.3%) | |
| Water source | |||||
| Mean Ohio River water years (without GAC) | 0.49±1.67 | 5.48±9.32 | 4.02±4.19 | 3.17±5.72 | |
| Mean Ohio River water years (with GAC) | 2.70±5.03 | 1.76±3.52 | 1.76±3.52 | 4.30±7.82 | |
| Mean Ohio River Aquifer Years | 2.68±5.62 | 0.04±0.35 | 0.04±0.35 | 1.24±4.28 | |
| Age at sample (Years) | 46.8±14.7 | 41.2±16.2 | 9.0±1.5 | 28.5±21.1 | |
| Sex | |||||
| Female | 322 (62.3%) | 263 (71.9%) | 725 (100.0%) | 1310 (81.5%) | |
| Male | 195 (37.7%) | 103 (28.1%) | 0 (0.0%) | 298 (18.5%) | |
| Drank tap water | 467 (90.3%) | 338 (92.3%) | 639 (88.1%) | 1444 (89.8%) | |
| Mean tap water consumption (L/day) | 2.6±1.7 | 2.6±2.5 | 0.7±0.6 | 1.24±4.28 | |
| Drank bottled water | 199 (38.5%) | 308 (84.2%) | 470 (64.8%) | 977 (60.8%) | |
| Used a water filter | 114 (22.1%) | 155 (42.3%) | 331 (45.7%) | 600 (37.3%) | |
| Ever pregnanta | 264 (82.0%) | 206 (78.3%) | 0 (0.0%) | 470 (35.9%) | |
| Pregnant at serum collectiona | 4 (1.2%) | 15 (5.7%) | 0 (0.0%) | 19 (1.5%) | |
| Mean graviditya | 3.1 ±1.8 | 2.6±1.7 | - | 2.8±1.8 | |
| Ever breastfed a childa | 133 (41.3%) | 103 (39.2%) | 0 (0.0%) | 236 (18.0%) | |
| Mean children breastfeda | 1.1 ±1.3 | 0.9±1.1 | - | 1.0±1.2 | |
| Breastfed as a childb | 0 (0.0%) | 13 (61.9%) | 474 (65.4%) | 478 (64.8%) | |
| Mean breastfeeding duration (months)b | - | 5.4±6.8 | 3.7±5.8 | 3.8±5.8 | |
Notes:
Adult females only
Children only
Serum PFAS concentrations
Unless indicated, serum PFOS and serum PFOA refer to total concentrations. PFHxS, PFOA, PFOS and PFNA were detected in greater than 99% of samples; Me-PFOSA-AcOH and PFDeA were detected in more than 82% (Table S2; Figure 2). PFBuS and PFDoA were never detected. PFOA and PFOS isomers were measured in 350/1608 serum samples; n-PFOA was detected in 99.7% and branched PFOA in 44.6%. Mean serum PFOA was 97% linear, 3% branched. Mean serum PFOS was 71% n-PFOS, 28% Σm-PFOS, and 1% Σm2-PFOS.
Figure 2. Median Serum PFAS Concentrations.

Notes:
Only PFAS with >40% above LOD across all three cohorts shown
Total sample median used for NHANES data (CDC, 2015)
Serum PFOA was highest in samples collected 1991–1993 (median=13.8 ng/mL), and decreased for each sample year group to 2011–2013 (median=4.3 ng/mL). Similar decreases were observed for n-PFOA (median=5.6 ng/mL in 2007–2008; median=2.6 ng/mL in 2011–2013). Median serum PFOS was highest 1994–1996 (32.2 ng/mL), decreasing to 6.3 ng/mL in 2011–2013; n-PFOS, Σm-PFOS and Σm2-PFOS concentrations decreased proportionately. For participants with multiple samples, median serum concentrations for measured PFAS decreased between samples (Table S3); median between-sample total PFOA decrease was 2.3ng/mL (29%) and median total PFOS decrease was 4.9ng/mL (37%) over a mean between-sample interval of 4.5 years.
Weighted PFOA-PFAS Pearson correlations (Table S4) were significant (p>0.05) for all but PFOA-PFHxS and PFOA-PFUA. These correlations were moderate (PFOS) or weak (Et-PFOSA-AcOH, Me-PFOSA-AcOH, PFOSA, PFHxS, PFNA, PFDeA, PFUA); all were less than 0.5. Total and n-PFOA, total and n-PFOS, total and Σm-PFOS, and n-PFOS and Σm-PFOS were strongly correlated. Total PFOA-branched PFOA and n-PFOA-branched PFOA concentrations were weakly correlated.
Serum PFOA determinants
Water source was statistically significant in both PFOA regression models (Table 2). Final models explained 44–47% of serum PFOA variation (r2: 0.44–0.47). In Model 1, covariate-adjusted geometric mean (GM) serum PFOA was significantly higher for participants using Ohio River water in Huntington (8.9 ng/mL), Ashland, KY to Portsmouth (12.7 ng/mL), and Northern Kentucky Cincinnati suburbs (10.4 ng/mL), but not Cincinnati itself (6.0 ng/mL), than non-Ohio River water sources (5.6 ng/mL). Serum PFOA was also significantly elevated for participants using the Ohio River Aquifer between Huntington and Cincinnati (GM=8.0 ng/mL), but not between Cincinnati and Louisville (GM=4.4 ng/mL). In Model 2, serum PFOA concentration significantly increased with each year the Ohio River or Ohio River aquifer was the municipal water source.
Table 2.
Serum PFOA regression models
| Model 1: Water Source at Sample | Model 2: Cumulative Water Years | ||||||||
|---|---|---|---|---|---|---|---|---|---|
| Full Model | Final Model | Full Model | Final Model | ||||||
|
| |||||||||
| Total Samples | 1608 | 1608 | 1608 | 1608 | |||||
|
| |||||||||
| Samples in Analysis | 1472 | 1491 | 1431 | 1450 | |||||
|
| |||||||||
| r2 | 0.47 | 0.45 | 0.45 | 0.44 | |||||
|
| |||||||||
| Model Parameters | β estimate | p-value | β estimate | p-value | β estimate | p-value | β estimate | p-value | |
|
|
|
|
|||||||
| Water Source | |||||||||
|
| |||||||||
| Ohio River (Huntington, GAC) | 0.450 | <.0001 | 0.456 | <.0001 | |||||
|
| |||||||||
| Ohio River (Ashland/Ironton/Portsmouth) | 0.830 | <.0001 | 0.816 | <.0001 | |||||
|
| |||||||||
| Ohio River Aquifer (Huntington-Cincinnati) | 0.351 | 0.0001 | 0.356 | <.0001 | |||||
|
| |||||||||
| Ohio River (Northern Kentucky) | 0.632 | <.0001 | 0.610 | <.0001 | |||||
|
| |||||||||
| Ohio River (Cincinnati, GAC) | 0.075 | 0.2163 | 0.061 | 0.313 | |||||
|
| |||||||||
| Ohio River Aquifer (Cincinnati-Louisville) | −0.236 | 0.0081 | −0.251 | 0.005 | |||||
|
| |||||||||
| Great Miami Aquifer | −0.041 | 0.5076 | −0.052 | 0.400 | |||||
|
| |||||||||
| All Other Water Sources | 0.000 | - | 0.000 | - | |||||
|
| |||||||||
| Cumulative Ohio River Water Years (without GAC) | 0.041 | <.0001 | 0.043 | <.0001 | |||||
|
| |||||||||
| Cumulative Ohio River Water Years (with GAC) | 0.015 | <.0001 | 0.016 | <.0001 | |||||
|
| |||||||||
| Cumulative Ohio River Aquifer Years | 0.015 | 0.001 | 0.017 | 0.000 | |||||
|
| |||||||||
| Sample Year | |||||||||
|
| |||||||||
| 1991–1993 | 1.277 | <.0001 | 1.254 | <.0001 | 1.439 | <.0001 | 1.436 | <.0001 | |
|
| |||||||||
| 1994–1996 | 1.156 | <.0001 | 1.148 | <.0001 | 1.320 | <.0001 | 1.327 | <.0001 | |
|
| |||||||||
| 1997–2000 | 1.069 | <.0001 | 1.057 | <.0001 | 1.260 | <.0001 | 1.258 | <.0001 | |
|
| |||||||||
| 2001–2006 | 1.041 | <.0001 | 1.037 | <.0001 | 1.165 | <.0001 | 1.158 | <.0001 | |
|
| |||||||||
| 2007–2008 | 0.648 | <.0001 | 0.641 | <.0001 | 0.717 | <.0001 | 0.707 | <.0001 | |
|
| |||||||||
| 2009–2010 | 0.338 | <.0001 | 0.336 | <.0001 | 0.415 | <.0001 | 0.412 | <.0001 | |
|
| |||||||||
| 2011–2013 | 0.000 | - | 0.000 | - | 0.000 | - | 0.000 | - | |
|
| |||||||||
| Age at Sample (Years) | 0.009 | <.0001 | 0.009 | <.0001 | 0.006 | <.0001 | 0.006 | <.0001 | |
|
| |||||||||
| Sex | |||||||||
|
| |||||||||
| Female | −0.042 | 0.509 | −0.081 | 0.215 | |||||
|
| |||||||||
| Male | 0.000 | - | 0.000 | - | |||||
|
| |||||||||
| Tap Water Consumption (L/day) | 0.021 | 0.055 | 0.024 | 0.024 | 0.020 | 0.076 | 0.022 | 0.040 | |
|
| |||||||||
| Drank Bottled Water | |||||||||
|
| |||||||||
| Yes | 0.061 | 0.077 | 0.064 | 0.074 | |||||
|
| |||||||||
| No | 0.000 | - | 0.000 | - | |||||
|
| |||||||||
| Used a Water Filter | |||||||||
|
| |||||||||
| Yes | 0.040 | 0.238 | 0.029 | 0.406 | |||||
|
| |||||||||
| No | 0.000 | - | 0.000 | - | |||||
|
| |||||||||
| Pregnant at serum collection | |||||||||
|
| |||||||||
| Yes | −0.632 | 0.000 | −0.493 | 0.001 | −0.473 | 0.005 | −0.395 | 0.008 | |
|
| |||||||||
| No | 0.000 | - | 0.000 | . | 0.000 | - | 0.000 | - | |
|
| |||||||||
| Gravidity | −0.028 | 0.112 | −0.037 | 0.021 | −0.026 | 0.157 | −0.041 | 0.011 | |
|
| |||||||||
| Number of Children Breastfed | −0.078 | 0.007 | −0.071 | 0.014 | −0.081 | 0.006 | −0.074 | 0.012 | |
Serum PFOA declined with sample year (linear trend p<0.0001) in both models. Covariate-adjusted GM serum PFOA was highest in samples drawn 1991–1993 (11.6/12.8 ng/mL) and lowest 2011–2013 (3.3/3.0 ng/mL) for Models 1 and 2, respectively. Water source and sample year interactions in Model 1 (p<0.0001) revealed different temporal trends by region (Figure 3). Serum PFOA was highest for participants using Cincinnati Ohio River water 1991–1993 (GM=16.4 ng/mL) and declined subsequently; serum PFOA increased in participants using Northern Kentucky Ohio River water from 1991–1993 (GM=13.5 ng/mL) to 2001–2006 (GM=16.2 ng/mL) before declining. Serum PFOA in participants using the Ohio River Aquifer was constant 1991–2006 before declining 2007–2010. Serum PFOA for participants using the Great Miami Aquifer or other water sources was highest in 1991–1993 and declined throughout.
Figure 3. Adjusted GM serum PFOA concentrations by water source and sample year.

Notes:
Adjusted for water source, sample year, age at sample, tap water consumption, pregnancy status, gravidity and number of children breastfed.
*<5 participants used this water source during these years.
Pregnancy, breastfeeding and gravidity were significantly inversely associated with serum PFOA in both models. Serum PFOA significantly increased with age and tap water consumption. Serum PFOA was significantly greater in males than females in univariate models (p<0.0001), but not multivariate analyses. Bottled water consumption and water filter use were non-significantly associated with serum PFOA.
We conducted linear regression analyses of other PFAS with more than 80% above LOD using both models. Water source was significantly associated with Me-PFOSA-AcOH, PFHxS, total PFOS and PFNA, but not PFDeA (Table S5). Adjusted serum concentrations of Me-PFOSA-AcOH, PFHxS, PFNA and PFDeA did not differ widely across regions (maximum difference 0.7ng/mL) (Table S7). Total PFOS varied between Huntington, WV and other regions (maximum difference 4.3ng/mL), but other adjusted between-region total PFOS differences were small. In Model 2 (Table S6), cumulative Ohio River water years without GAC was significantly associated with increasing total serum PFOS and PFNA, but not Me-PFOSA-AcOH, PFHxS, or PFDeA. Cumulative Ohio River water years with GAC was associated with significantly decreasing serum PFHxS and total PFOS. Effect estimates for cumulative Ohio River water years with GAC were lower than those for cumulative Ohio River water years without GAC.
Pharmacokinetics
We estimated serum PFOA between measured concentrations for 508 FCC and BCERP study participants with multiple samples (Figure S1). Overall, Scenario 2 and elimination constants based on a 3.8-year half-life best replicated measured serum concentrations (Table S8). When we stratified model fit by starting serum PFOA concentration (>12.9 ng/mL vs ≤12.9 ng/mL), Scenario 2 and a 3.8-year was the best fit for higher starting PFOA concentrations, while Scenario 1 and a 3.8-yr half-life was a better fit for lower starting PFOA concentrations (Table S9). Similar fit differences were present when stratified by cohort; Scenario 2 and a 3.8-year half-life better fit FCC participants, while Scenario 1 and a 3.8-yr half-life better fit BCERP participants’ measured serum concentrations (Table S10). Model fit improved as estimated half-lives increased from 1.7 years to 3.8 years under both scenarios, and across all strata. Under Scenario 1, predicted serum PFOA was highest in 1991 and decreased throughout the study period. Under Scenario 2, predicted GM serum PFOA increased through the 1990s, peaking in 2000/2001 (Figure S1).
Discussion
To our knowledge, this is the first study to report on serum concentrations of PFOA in samples obtained as early as 1991, with water supply source information for each study participant. However, earlier publications noted the presence of organic fluorinated compounds in human plasma. Organic fluorinated compounds were noted in human plasma in blood bank samples collected from 106 persons living in five different US cities in a 1976 publication, with speculation that they originated from an environmental source. The organic fluorine concentrations in plasma (1.35 µM or 0.025 ppm) were not related to the amount of fluoride in the water supply (Guy et al., 1976). The dominant peak in silica acid column chromatography showed a “nmr pattern consistent with a derivative of perfluoroinated octanoic acid” (Taves et al., 1976). In 1981, Belisle (1981) reported on finding trace amounts of organic fluorine in 8 samples of human blood obtained from donors in a Chinese rural commune, very unlikely to have exposure to industrial sources of fluorochemicals, but lower than the amounts found in persons living in more urban areas. They also noted that the analytic method may have introduced the organic compounds.
Median serum PFOS (12.4 ng/mL), PFDeA (0.2 ng/mL), PFHxS (2.8 ng/mL), PFNA (1.0 ng/mL) and Me-PFOSA-AcOH (0.5 ng/mL) concentrations in our participants were comparable to median NHANES concentrations. Median serum PFOA concentration (7.6 ng/mL) was greater than NHANES, and individual serum PFOA concentrations were greater than corresponding NHANES 95th percentiles for 47% of participants. Residents’ PFOA serum concentrations were lower than in participants of the C-8 study in 2005–2006 (28.8 ng/mL) (Frisbee et al., 2009), comparable to those in the baseline (2005–2007) BCERP Cincinnati-site participant subset of this cohort we previously reported (6.4 ng/mL) (Pinney et al., 2014), and greater than HOME participants 2003–2006 (3.4–5.5 ng/mL) (Kato et al., 2014; Braun et al., 2016). These findings suggest Mid-Ohio River Valley residents were exposed to PFOA, but not the other PFAS we measured, above background levels. However, additional PFAS continue to be identified, and these may become more environmentally relevant as PFOA and PFOS are phased out and decrease in human serum (Newton et al., 2017); exposure to these PFAS is unknown in our participants.
While overall serum PFOA levels decreased with time in our population, we identified distinct temporal trends across regions; these may be explained by sourcewater and drinking water treatment technology differences. Residents using the Great Miami Aquifer and other water sources show a gradual decrease in PFOA similar to that identified in NHANES surveys (CDC, 2015). This suggests that PFOA contamination in these waters was minimal, and that their PFOA exposures decreased as PFOA levels in other sources, most likely food and house dusts, decreased. Both regions served by the Ohio River Aquifer show a relatively flat trend in serum PFOA in the 1990s, before decreasing in the mid-to-late 2000s. This suggests that the natural filtration of the aquifer reduced drinking water concentrations enough that residents reached steady-state serum concentrations, but that overall exposures were higher than the US general population, and that an aquifer’s natural filtration is less effective at removing PFOA than other treatment technologies. The most striking difference in temporal trend is between Greater Cincinnati and Northern Kentucky. Because both utilities use the Ohio River as a water source at the same point along the river, though Northern Kentucky also draws on the Licking River, we believe drinking water treatment explains this difference. Cincinnati began using GAC in 1992 (Westerhoff et al., 2009), while Northern Kentucky did not until June 2012, after all samples from Northern Kentucky residents were collected. GAC treatment may explain why Cincinnati participants’ serum PFOA concentration decreased during the 1990s, while those in Northern Kentucky residents rose. GAC use may also explain the differences in serum PFOA between Huntington, WV and Portsmouth, OH; Huntington, WV began using GAC in 1981 (Culp et al., 1981), while Portsmouth, OH does not.
Overall, GAC filtration or aquifer recharge decreased adjusted mean serum PFOA concentration 4 ng/mL (Model 1), while serum PFOA increases per year were 0.19–0.21 ng/mL lower than they would have been absent GAC (Model 2). These reductions were 40–60% of estimated serum PFOA concentrations. C-8 Project participants had similar reductions in their serum PFOA concentrations after GAC installation (Bartell et al., 2010). We also saw reductions in serum concentrations of other PFAS with GAC treatment; however, only PFOS saw a reduction in serum concentrations from GAC use (0.16 ng/mL) comparable to those observed with PFOA. This may be a result of lower sourcewater concentrations of other PFAS and not less efficacy for GAC. While GAC filtration did not reduce PFOA exposure to background level, it did mitigate PFOA exposure through drinking water.
Pharmacokinetic analyses under model criteria with the best fit for the entire population (Scenario 2 and PFOA elimination coefficients based on a 3.8yr half-life) indicate that GM serum PFOA concentrations in participants with multiple serum samples increased from 1991 to 2001, then declined to 2013. Under conditions where estimated drinking water PFOA concentrations were increasing, we saw very little variation in GM serum PFOA across all the half-lives we investigated. For both low initial PFOA exposure and the BCERP cohort, Scenario 1 (constant PFOA water concentrations) was a better fit than time-varying PFOA water concentrations (Scenario 2). Both the BCERP cohort and participants with lower starting PFOA had samples collected later than those in the FCC cohort or higher initial PFOA; therefore, Scenario 1 being a better fit may indicate that PFOA concentrations decreased rapidly between 2005 and 2009, or did not decrease as rapidly as we estimated after 2009. A 3.8-year half-life being the best fit in our pharmacokinetic analyses appears to contradict recent studies, which found the PFOA half-life to be 1.5–2.1 years shorter (Fu et al, 2016; Bartell et al. 2010). However, half-life studies where participants are still exposed to PFOA may result in a higher apparent half-life if all sources of PFOA are not properly accounted for (Russell et al., 2015). Because we did not have individual estimates of PFOA exposure through non-water sources, and used present drinking water consumption for past intake where necessary, the longer half-life may be accounting for errors in dose estimation.
Serum PFOA was significantly associated with water source, year sample collected, age at sample collection, tap water consumption, pregnancy, gravidity and breastfeeding in regression models. Although males have higher median serum PFOA concentrations than females in the general population (2.3ng/mL vs. 1.8 ng/mL in 2011–2012) (CDC, 2015) and sex was highly significant in our univariate models, sex dropped out when models included pregnancy, reproductive history and breastfeeding. Maternal PFOA decreases associated with pregnancy, gravidity and breastfeeding may explain some of the observed sex differences (Liu et al., 2011). While not assessed in our study, menstruation may account for some of the remaining difference in serum PFOA concentrations between males and females (Lorber et al., 2015).
Significant associations between serum PFOA and tap water consumption, the Ohio River and Ohio River Aquifer strongly suggest drinking water is a predominant PFOA exposure source in these study populations. After covariate-adjustment, each additional liter of tap water consumed daily increased serum PFOA 0.17 ng/mL. Each additional year drinking Ohio River water treated with GAC increased serum PFOA 0.13 ng/mL, while each additional year drinking Ohio River water without GAC increased serum PFOA 0.34 ng/mL; one additional year drinking Ohio River Aquifer water increased serum PFOA 0.15 ng/mL. These associations point to drinking water as a major exposure source for our study participants.
Inter-PFAS correlations also suggest that drinking water is a major PFOA exposure source. Such correlations are strong in the general population (e.g., NHANES; PFOA-PFOS ρ=0.66) (Calafat et al., 2007), and where the primary PFAS source is food (PFOA-PFOS ρ=0.54) (Ji et al., 2012). Conversely, correlations are weaker for populations exposed to PFOA through drinking water: PFOA-PFOS ρ=0.30 in C-8 study participants (Frisbee et al., 2009), and 0.11–0.32 in Arnsberg, Germany (Holzer et al., 2008). Inter- PFAS correlations in our study population, especially PFOA-PFOS (ρ=0.41), were lower than those previously reported for BCERP participants in Greater Cincinnati (ρ=0.62) or the San Francisco Bay Area (ρ=0.60), but comparable to BCERP participants living in Northern Kentucky (ρ=0.38) (Pinney et al., 2014). Inter-PFAS correlations are also comparable to those measured in the C-8 project community (Frisbee et al., 2009). While PFAS have multiple environmental sources, these weaker correlations suggest different PFOA exposure source(s) predominate in our population than the US general population.
Isomer profiles can suggest exposure sources (De Silva and Mabury, 2006). PFAS were predominantly produced using electrochemical fluorination (ECF) in the US until 2002, when 3M ceased production. Telomerization was used by the largest remaining US PFAS manufacturer, DuPont (Prevedouros et al. 2006). ECF produces 70%-80% linear and 20–30% branched PFOS and PFOA; telomerization produces linear products from linear feedstocks (Buck et al., 2011). Human PFOA isomer pharmacokinetics are unknown, but rodents eliminate branched PFOA faster than n-PFOA (De Silva et al., 2009). Taken together, these findings suggest our participants were predominantly exposed to telomerization-produced PFOA (De Silva and Mabury, 2006). However we cannot rule out participant exposure to ECF-produced PFOA; mean 97% n-PFOA might have resulted, at least in part, from preferential branched PFOA isomer excretion, and n-PFOA retention, before sera collection.
The trends in study participants’ measured and predicted serum PFOA mirror measured Ohio River water PFOA concentrations. PFAS concentrations were measured throughout the Ohio River Valley in September 2009 (Emery et al., 2010). Additional Ohio River PFOA measurements were conducted near Parkersburg, WV in 2003 (GIST, 2003) and average Ohio River PFOA concentrations were estimated for 1951–2003 (Paustenbach et al., 2007). Ohio River water PFBuS, PFHxS, PFOS, PFNA and PFDeA concentrations in 2009 were <6 ng/L between Huntington, WV and Louisville, KY. Reported Cincinnati Ohio River water PFOA concentrations were 100 ng/L in 2005, 21 ng/L in 2006, and 13.1 ng/L in 2009 (Personal communication with Greater Cincinnati Water Works; Emery et al. 2010). 2009 Ohio River water PFOA concentrations at Huntington were 19.1 ng/L and 3.4–5.3 ng/L at points above Parkersburg, WV, 209 km upstream of Huntington; 2009 water PFOA concentrations were also low (1.48–6.22 ng/L) in Ohio River tributaries in our study area. Measured Ohio River PFOA concentrations at Parkersburg were 35 ng/L in 2009 (Emery et al., 2010) and 295 ng/L in 2003 (GIST, 2003); average estimated annual PFOA concentration was 690 ng/L in 1999 (Paustenbach et al., 2007). Measured PFOA concentrations in Ohio River Aquifer water 2002–2005 near Parkersburg were 58–4800 ng/L. The Ohio River Aquifer is partially recharged by the Ohio River, contaminating it with PFOA (Paustenbach et al., 2007).
Three known industrial sources discharge PFOA into the Ohio River: DuPont’s Fort Washington Works and on-site landfill, Dry Run Landfill in Washington, WV, and Letart Landfill in Letart, WV. DuPont reported industrial discharges of approximately 150,000 lbs. of PFOA (as ammonium perfluorooctanoate) to the Ohio River in the 1980s, 350,000 lbs. in the 1990s and 75,000 lbs. 2000–2003 (Paustenbach et al., 2007). The 2004 annual releases were 6,000 lbs./yr., decreasing to 705 lbs./yr. in 2011 (United States Environmental Protection Agency, 2015b). These discharges contaminated municipal drinking water (Emmett et al., 2006; Paustenbach et al., 2007) and private wells (Hoffman et al., 2011) in the C-8 project area. Industrial discharges to Letart and Dry Run are unknown, but surface water PFOA concentrations were 107–40,290 ng/L for Dry Run and 154–1,960 ng/L for Letart (GIST, 2003). Other industrial facilities discharging PFOA into the Ohio River are unknown. Wastewater treatment plants (WWTPs) (Huset et al., 2008; Muller et al., 2011a) or non-point sources (Muller et al., 2011b) are possible PFOA sources. Ohio River water PFOA concentrations in 2009 increased 1–3 ng/L at WWTP outfalls, compared to measurements immediately upstream (Emery et al., 2010). However, water PFOA concentrations are much lower (1.4–7.4 ng/L) in rivers solely contaminated by WWTPs (Huset et al., 2008; Muller et al., 2011a), while industrial PFAS discharges predominate over WWTPs in waters contaminated by both (Castiglioni et al., 2015; Valsecchi et al., 2015; Zhu et al., 2015). Because PFOA contamination in other waters is reported to persist hundreds of kilometers downstream of PFAS manufacturers (Valsecchi et al., 2015; Zhu et al., 2015), PFOA discharged into the Ohio River 209–666km upstream of our study area could have contaminated our participants’ drinking water.
Strengths/Limitations
All three study populations represented voluntary convenience samples, and therefore were not necessarily representative of the general population. Although the mean and median values of PFCs reported here do not necessarily represent general population values, our data certainly indicate that there was widespread exposure to PFOA among participants. We could not assess all exposure sources, including food, house dust or whether adult participants were breastfed as children. Complete occupational histories were unavailable, though no participants worked at PFAS–production facilities. Because we based Model 2 on residential addresses, not including occupational histories could result in overestimating water source exposure, especially in large urban areas with multiple water providers or water sources. This is mitigated for children, where residences and schools are more closely located. However, our regression models explained 44–47% of study participants’ serum PFOA variation without including these other exposure sources or locations. Because other PFAS concentrations in our study population were similar to NHANES, it is unlikely that high PFOA serum concentrations in our study are mainly due to food and dust exposures. Participants may have improperly estimated average water intake; this was mitigated by using visual aids for serving sizes (Chambers et al., 2000). We assumed constant reported water consumption in analyses; this could overestimate water consumption when participants were children (Kant and Graubard, 2010), and underestimate consumption when participants were younger adults (Kant et al., 2009). One-compartment pharmacokinetic models may not properly estimate serum PFOA concentrations, though trends matched regression analyses. Rigorous collection and processing protocols strengthen this study. Serum was specifically collected, processed, and stored for biospecimen analysis using research protocols developed by CDC. Anthropometrics were collected using similar protocols for all studies, data were collected prior to PFAS measurements, and questionnaires were repeatedly administered to BCERP and FCC cohorts, allowing for missing data collection and response validation.
Conclusions
Mid-Ohio River Valley residents (Huntington, WV to Louisville, KY) were likely exposed to PFOA, but not other PFAS, above US population background levels; serum PFOA concentrations were highest in the 1990s, declining in the 2000s. Serum PFOA concentrations are significantly associated with use of Ohio River and Ohio River Aquifer water. While using GAC for water treatment resulted in lower serum PFOA, it did not reduce concentrations to background. Municipal drinking water, probably contaminated by industrial PFOA discharges 209–666km upstream of our participants, appears to be the primary PFOA exposure source.
Supplementary Material
Highlights.
Mid-Ohio River Valley (Huntington, WV to Louisville, KY) residents have median serum PFOA concentrations greater than the general US population; resident serum concentrations for other PFAAs are similar to background.
Pharmacokinetic modeling and repeat serum measurements indicate PFOA concentrations were highest in the 1990s and decreased after 2000.
Using granular activated carbon in a drinking water treatment system reduces serum PFOA concentrations.
Municipal drinking water utilities with the Ohio River and Ohio River Aquifer as sourcewaters are major PFOA exposure sources for residents of the Mid-Ohio River Valley.
PFOA discharges to the Ohio River 209–666 kilometers upstream of the study area are the most likely source of PFOA in the Ohio River and Ohio River Aquifer.
Acknowledgments
Dr. Renee Jeffreys-Heil, Valeriya Petrenko, Emily Jones and Kathy Kreitel assisted with interviews. Victoria Straughn, Rhoshonda Jones and Sandy Rota performed blood collection, storage and processing. Kayoko Kato, Charles Dodson, Zsuzsanna Kuklenyik, Xavier Bryant, Amal Wanigatunga, Brian Basden, Carmen Dunbar, Ayesha Patel, Jun Ma, Tao Jia and Jack Reidy at CDC conducted PFAS measurements. West Virginia, Ohio, Kentucky and Indiana utilities, regulatory and mapping agencies helped identify water sources. The late Dr. Paul Succop assisted with statistical analyses. Dr. Carol Rice provided editorial review.
Funding Sources: This publication was made possible by the Breast Cancer and the Environment Research Program awards U01ES012770, U01ES019453 and U01ES019457 from the National Institute of Environmental Health Sciences (NIEHS) and the National Cancer Institute (NCI); P30ES006096, R21ES017176 and T32ES10957 from NIEHS; R834788 from the United States Environmental Protection Agency, and UL1RR026314 from the National Center for Research Resources. Funding sources had no involvement in study design beyond the initial suggestion that we measure serum biomarkers of PFC exposure, and no involvement in collection, analysis and interpretation of data, writing of the article and the decision to submit the article for publication. Its contents are solely the responsibility of the authors and do not necessarily represent the official views of the NIEHS, NCI, the National Institutes of Health or the Centers for Disease Control and Prevention.
Footnotes
Publisher's Disclaimer: This is a PDF file of an unedited manuscript that has been accepted for publication. As a service to our customers we are providing this early version of the manuscript. The manuscript will undergo copyediting, typesetting, and review of the resulting proof before it is published in its final citable form. Please note that during the production process errors may be discovered which could affect the content, and all legal disclaimers that apply to the journal pertain.
Competing financial interests: None
References
- Bartell SM, Calafat AM, Lyu C, Kato K, Ryan PB, Steenland K. Rate of decline in serum PFOA concentrations after granular activated carbon filtration at two public water systems in Ohio and West Virginia. Environ. Health Perspect. 2010;118:222–228. doi: 10.1289/ehp.0901252. [DOI] [PMC free article] [PubMed] [Google Scholar]
- Beesoon S, Webster GM, Shoeib M, Harner T, Benskin JP, Martin JW. Isomer profiles of perfluorochemicals in matched maternal, cord, and house dust samples: manufacturing sources and transplacental transfer. Environ. Health Perspect. 2011;119:1659–1664. doi: 10.1289/ehp.1003265. [DOI] [PMC free article] [PubMed] [Google Scholar]
- Belisle J. Organic fluorine in human serum: natural versus industrial sources. Science. 1981;212:1509–1510. doi: 10.1126/science.7233235. [DOI] [PubMed] [Google Scholar]
- Biro FM, Galvez MP, Greenspan LC, Succop PA, Vangeepuram N, Pinney SM, Teitelbaum S, Windham GC, Kushi LH, Wolff MS. Pubertal assessment method and baseline characteristics in a mixed longitudinal study of girls. Pediatrics. 2010;126:e583–90. doi: 10.1542/peds.2009-3079. [DOI] [PMC free article] [PubMed] [Google Scholar]
- Braun JM, Chen A, Romano ME, Calafat AM, Webster GM, Yolton K, Lanphear BP. Prenatal perfluoroalkyl substance exposure and child adiposity at 8 years of age: The HOME study. Obesity (Silver Spring) 2016;24:231–237. doi: 10.1002/oby.21258. [DOI] [PMC free article] [PubMed] [Google Scholar]
- Brede E, Wilhelm M, Goen T, Muller J, Rauchfuss K, Kraft M, Holzer J. Two-year follow-up biomonitoring pilot study of residents’ and controls’ PFC plasma levels after PFOA reduction in public water system in Arnsberg, Germany. Int. J. Hyg. Environ. Health. 2010;213:217–223. doi: 10.1016/j.ijheh.2010.03.007. [DOI] [PubMed] [Google Scholar]
- Buck RC, Franklin J, Berger U, Conder JM, Cousins IT, de Voogt P, Jensen AA, Kannan K, Mabury SA, van Leeuwen SP. Perfluoroalkyl and polyfluoroalkyl substances in the environment: terminology, classification, and origins. Integr. Environ. Assess. Manag. 2011;7:513–541. doi: 10.1002/ieam.258. [DOI] [PMC free article] [PubMed] [Google Scholar]
- Calafat AM, Kuklenyik Z, Reidy JA, Caudill SP, Tully JS, Needham LL. Serum concentrations of 11 polyfluoroalkyl compounds in the u.s. population: data from the national health and nutrition examination survey (NHANES) Environ. Sci. Technol. 2007;41:2237–2242. doi: 10.1021/es062686m. [DOI] [PubMed] [Google Scholar]
- Castiglioni S, Valsecchi S, Polesello S, Rusconi M, Melis M, Palmiotto M, Manenti A, Davoli E, Zuccato E. Sources and fate of perfluorinated compounds in the aqueous environment and in drinking water of a highly urbanized and industrialized area in Italy. J. Hazard. Mater. 2015;282:51–60. doi: 10.1016/j.jhazmat.2014.06.007. [DOI] [PubMed] [Google Scholar]
- Centers for Disease Control and Prevention. Fourth Report on Human Exposure to Environmental Chemicals, Updated Tables, (February, 2015) Centers for Disease Control and Prevention; Atlanta, GA: 2015. [Google Scholar]
- Chambers E, 4th, Godwin SL, Vecchio FA. Cognitive strategies for reporting portion sizes using dietary recall procedures. J. Am. Diet. Assoc. 2000;100:891–897. doi: 10.1016/s0002-8223(00)00259-5. [DOI] [PubMed] [Google Scholar]
- Culp RL, Faisst JA, Smith CE. Granular Activated Carbon Installations. United States Environmental Protection Agency, Office of Research and Development, Municipal Environmental Research Laboratory; Cincinnati, OH: 1981. [Google Scholar]
- De Silva AO, Benskin JP, Martin LJ, Arsenault G, McCrindle R, Riddell N, Martin JW, Mabury SA. Disposition of perfluorinated acid isomers in Sprague-Dawley rats; part 2: subchronic dose. Environ. Toxicol. Chem. 2009;28:555–567. doi: 10.1897/08-254.1. [DOI] [PubMed] [Google Scholar]
- De Silva AO, Mabury SA. Isomer distribution of perfluorocarboxylates in human blood: potential correlation to source. Environ. Sci. Technol. 2006;40:2903–2909. doi: 10.1021/es0600330. [DOI] [PubMed] [Google Scholar]
- D’Hollander W, de Voogt P, De Coen W, Bervoets L. Perfluorinated substances in human food and other sources of human exposure. Rev. Environ. Contam. Toxicol. 2010;208:179–215. doi: 10.1007/978-1-4419-6880-7_4. [DOI] [PubMed] [Google Scholar]
- Emery E, Spaeth J, Mills M, Nakayama S, Frommel J. A Screening Study Investigating the Presence of Emerging Contaminants within the Ohio River Basin. The Ohio River Valley Water Sanitation Commission (ORSANCO) and United States Environmental Protection Agency, Office of Research and Development, National Risk Management Research Laboratory; Cincinnati, OH: 2010. [Google Scholar]
- Emmett EA, Shofer FS, Zhang H, Freeman D, Desai C, Shaw LM. Community exposure to perfluorooctanoate: relationships between serum concentrations and exposure sources. J. Occup. Environ. Med. 2006;48:759–770. doi: 10.1097/01.jom.0000232486.07658.74. [DOI] [PMC free article] [PubMed] [Google Scholar]
- Ericson I, Nadal M, van Bavel B, Lindstrom G, Domingo JL. Levels of perfluorochemicals in water samples from Catalonia, Spain: is drinking water a significant contribution to human exposure? Environ. Sci. Pollut. Res. Int. 2008;15:614–619. doi: 10.1007/s11356-008-0040-1. [DOI] [PubMed] [Google Scholar]
- Fernald Community Cohort (FCC) website. [Last accessed April 4, 2017]; http://med.uc.edu/eh/research/projects/fcc.
- Frisbee SJ, Brooks AP, Jr, Maher A, Flensborg P, Arnold S, Fletcher T, Steenland K, Shankar A, Knox SS, Pollard C, Halverson JA, Vieira VM, Jin C, Leyden KM, Ducatman AM. The C8 health project: design, methods, and participants. Environ. Health Perspect. 2009;117:1873–1882. doi: 10.1289/ehp.0800379. [DOI] [PMC free article] [PubMed] [Google Scholar]
- Fu J, Gao Y, Cui L, Wang T, Liang Y, Qu G, Yuan B, Wang Y, Zhang A, Jiang G. Occurrence, temporal trends, and half-lives of perfluoroalkyl acids (PFAAs) in occupational workers in China. Sci. Rep. 2016;6:38039. doi: 10.1038/srep38039. [DOI] [PMC free article] [PubMed] [Google Scholar]
- Groundwater Investigation Steering Team (GIST) Ammonium Perfluorooctanoate (C-8) Groundwater Investigation Steering Team Report. Groundwater Program, Division of Water and Waste Management; Charleston, WV: 2003. [Google Scholar]
- Guy WS, Taves DR, Brey JRWS. Organic Fluorocompounds in Human Plasma: Prevalence and Characterization. ACS Symposium Series. 1976;28 [Google Scholar]
- Hoffman K, Webster TF, Bartell SM, Weisskopf MG, Fletcher T, Vieira VM. Private drinking water wells as a source of exposure to perfluorooctanoic acid (PFOA) in communities surrounding a fluoropolymer production facility. Environ. Health Perspect. 2011;119:92–97. doi: 10.1289/ehp.1002503. [DOI] [PMC free article] [PubMed] [Google Scholar]
- Holzer J, Midasch O, Rauchfuss K, Kraft M, Reupert R, Angerer J, Kleeschulte P, Marschall N, Wilhelm M. Biomonitoring of perfluorinated compounds in children and adults exposed to perfluorooctanoate-contaminated drinking water. Environ. Health Perspect. 2008;116:651–657. doi: 10.1289/ehp.11064. [DOI] [PMC free article] [PubMed] [Google Scholar]
- Hornung RW, Reed LD. Estimation of average concentration in the presence of nondetectable values. Appl Occup Environ Hyg. 1990;5:46–51. [Google Scholar]
- Huset CA, Chiaia AC, Barofsky DF, Jonkers N, Kohler HP, Ort C, Giger DW, Field JA. Occurrence and mass flows of fluorochemicals in the Glatt Valley watershed, Switzerland. Environ. Sci. Technol. 2008;42:6369–6377. doi: 10.1021/es703062f. [DOI] [PMC free article] [PubMed] [Google Scholar]
- Ji K, Kim S, Kho Y, Paek D, Sakong J, Ha J, Kim S, Choi K. Serum concentrations of major perfluorinated compounds among the general population in Korea: dietary sources and potential impact on thyroid hormones. Environ. Int. 2012;45:78–85. doi: 10.1016/j.envint.2012.03.007. [DOI] [PubMed] [Google Scholar]
- Kant AK, Graubard BI. Contributors of water intake in US children and adolescents: associations with dietary and meal characteristics--National Health and Nutrition Examination Survey 2005–2006. Am. J. Clin. Nutr. 2010;92:887–896. doi: 10.3945/ajcn.2010.29708. [DOI] [PMC free article] [PubMed] [Google Scholar]
- Kant AK, Graubard BI, Atchison EA. Intakes of plain water, moisture in foods and beverages, and total water in the adult US population--nutritional, meal pattern, and body weight correlates: National Health and Nutrition Examination Surveys 1999–2006. Am. J. Clin. Nutr. 2009;90:655–663. doi: 10.3945/ajcn.2009.27749. [DOI] [PMC free article] [PubMed] [Google Scholar]
- Kato K, Wong LY, Chen A, Dunbar C, Webster GM, Lanphear BP, Calafat AM. Changes in serum concentrations of maternal poly- and perfluoroalkyl substances over the course of pregnancy and predictors of exposure in a multiethnic cohort of Cincinnati, Ohio pregnant women during 2003–2006. Environ. Sci. Technol. 2014;48:9600–9608. doi: 10.1021/es501811k. [DOI] [PMC free article] [PubMed] [Google Scholar]
- Kato K, Basden BJ, Needham LL, Calafat AM. Improved selectivity for the analysis of maternal serum and cord serum for polyfluoroalkyl chemicals. J. Chromatogr. A. 2011;1218:2133–2137. doi: 10.1016/j.chroma.2010.10.051. [DOI] [PubMed] [Google Scholar]
- Kuklenyik Z, Needham LL, Calafat AM. Measurement of 18 perfluorinated organic acids and amides in human serum using on-line solid-phase extraction. Anal. Chem. 2005;77:6085–6091. doi: 10.1021/ac050671l. [DOI] [PubMed] [Google Scholar]
- Lau C, Anitole K, Hodes C, Lai D, Pfahles-Hutchens A, Seed J. Perfluoroalkyl acids: a review of monitoring and toxicological findings. Toxicol. Sci. 2007;99:366–394. doi: 10.1093/toxsci/kfm128. [DOI] [PubMed] [Google Scholar]
- Liu J, Li J, Liu Y, Chan HM, Zhao Y, Cai Z, Wu Y. Comparison on gestation and lactation exposure of perfluorinated compounds for newborns. Environ. Int. 2011;37:1206–1212. doi: 10.1016/j.envint.2011.05.001. [DOI] [PubMed] [Google Scholar]
- Lorber M, Eaglesham GE, Hobson P, Toms LM, Mueller JF, Thompson JS. The effect of ongoing blood loss on human serum concentrations of perfluorinated acids. Chemosphere. 2015;118:170–177. doi: 10.1016/j.chemosphere.2014.07.093. [DOI] [PubMed] [Google Scholar]
- Muller CE, Gerecke AC, Alder AC, Scheringer M, Hungerbuhler K. Identification of perfluoroalkyl acid sources in Swiss surface waters with the help of the artificial sweetener acesulfame. Environ. Pollut. 2011a;159:1419–1426. doi: 10.1016/j.envpol.2010.12.035. [DOI] [PubMed] [Google Scholar]
- Muller CE, Spiess N, Gerecke AC, Scheringer M, Hungerbuhler K. Quantifying diffuse and point inputs of perfluoroalkyl acids in a nonindustrial river catchment. Environ. Sci. Technol. 2011b;45:9901–9909. doi: 10.1021/es202140e. [DOI] [PubMed] [Google Scholar]
- Newton S, McMahen R, Stoeckel JA, Chislock M, Lindstrom A, Strynar M. Novel Polyfluorinated Compounds Identified Using High Resolution Mass Spectrometry Downstream of Manufacturing Facilities near Decatur, Alabama. Environ. Sci. Technol. 2017;51:1544–1552. doi: 10.1021/acs.est.6b05330. [DOI] [PMC free article] [PubMed] [Google Scholar]
- Olsen GW, Burris JM, Ehresman DJ, Froehlich JW, Seacat AM, Butenhoff JL, Zobel LR. Half-life of serum elimination of perfluorooctanesulfonate, perfluorohexanesulfonate, and perfluorooctanoate in retired fluorochemical production workers. Environ. Health Perspect. 2007;115:1298–1305. doi: 10.1289/ehp.10009. [DOI] [PMC free article] [PubMed] [Google Scholar]
- Paustenbach DJ, Panko JM, Scott PK, Unice KM. A methodology for estimating human exposure to perfluorooctanoic acid (PFOA): a retrospective exposure assessment of a community (1951–2003) J. Toxicol. Environ. Health A. 2007;70:28–57. doi: 10.1080/15287390600748815. [DOI] [PubMed] [Google Scholar]
- Pinney SM, Biro FM, Windham GC, Herrick RL, Yaghjyan L, Calafat AM, Succop P, Sucharew H, Ball KM, Kato K, Kushi LH, Bornschein R. Serum biomarkers of polyfluoroalkyl compound exposure in young girls in Greater Cincinnati and the San Francisco Bay Area, USA. Environ. Pollut. 2014;184:327–334. doi: 10.1016/j.envpol.2013.09.008. [DOI] [PMC free article] [PubMed] [Google Scholar]
- Rahman MF, Peldszus S, Anderson WB. Behaviour and fate of perfluoroalkyl and polyfluoroalkyl substances (PFASs) in drinking water treatment: a review. Water Res. 2014;50:318–340. doi: 10.1016/j.watres.2013.10.045. [DOI] [PubMed] [Google Scholar]
- Russell MH, Waterland RL, Wong F. Calculation of chemical elimination half-life from blood with an ongoing exposure source: the example of perfluorooctanoic acid (PFOA) Chemosphere. 2015;129:210–216. doi: 10.1016/j.chemosphere.2014.07.061. [DOI] [PubMed] [Google Scholar]
- Taves DR, Grey WS, Brey WS., Jr Organic fluoride in human plasma: its distribution and partial identification. Toxicology and Applied Pharmocology. 1976;37:120. [Google Scholar]
- Thompson J, Lorber M, Toms LM, Kato K, Calafat AM, Mueller JF. Use of simple pharmacokinetic modeling to characterize exposure of Australians to perfluorooctanoic acid and perfluorooctane sulfonic acid. Environ. Int. 2010;36:390–397. doi: 10.1016/j.envint.2010.02.008. [DOI] [PubMed] [Google Scholar]
- United States Environmental Protection Agency. 2010/2015 PFOA Stewardship Program. 2015a 2015. [Google Scholar]
- United States Environmental Protection Agency. ICIS Detailed Reports: WASHINGTON WORKS, NPDES WV0001279. 2015b 2015. [Google Scholar]
- Valsecchi S, Rusconi M, Mazzoni M, Viviano G, Pagnotta R, Zaghi C, Serrini G, Polesello S. Occurrence and sources of perfluoroalkyl acids in Italian river basins. Chemosphere. 2015;129:126–134. doi: 10.1016/j.chemosphere.2014.07.044. [DOI] [PubMed] [Google Scholar]
- Wang Z, Cousins IT, Scheringer M, Buck RC, Hungerbuhler K. Global emission inventories for C4-C14 perfluoroalkyl carboxylic acid (PFCA) homologues from 1951 to 2030, Part I: production and emissions from quantifiable sources. Environ. Int. 2014;70:62–75. doi: 10.1016/j.envint.2014.04.013. [DOI] [PubMed] [Google Scholar]
- Westerhoff G, Atha K, Pohlman R. The Cincinnati GAC experience: Improving water quality and public trust in Ohio. Government Engineering March-April. 2009:30–32. [Google Scholar]
- Wones R, Pinney S, Buckholz J, Deck-Tebbe C, Freyberg R, Pesce A. Medical monitoring: A beneficial remedy for residents living near an environmental hazard site. Journal of Occupational and Environmental Medicine. 2009;51 doi: 10.1097/JOM.0b013e3181c558f1. 1374-1374-1383. [DOI] [PMC free article] [PubMed] [Google Scholar]
- Zhu Z, Wang T, Meng J, Wang P, Li Q, Lu Y. Perfluoroalkyl substances in the Daling River with concentrated fluorine industries in China: seasonal variation, mass flow, and risk assessment. Environ. Sci. Pollut. Res. Int. 2015;22:10009–10018. doi: 10.1007/s11356-015-4189-0. [DOI] [PubMed] [Google Scholar]
Associated Data
This section collects any data citations, data availability statements, or supplementary materials included in this article.