

Abstract
Objective
We assessed the contribution of increasing adiposity to the rising prevalence of diabetes in the United States over the period 1988–2014.
Research Design and Methods
Data from NHANES III (1988–1994) and continuous waves (1999–2014) were pooled for the current study. Diabetes status was assessed using data on Hemoglobin A1c. We estimated a multivariable logistic regression model that predicted the odds of having diabetes as a function of age, sex, racial/ethnic group, educational attainment, and period of observation. At a second stage, we introduced measures of general and abdominal adiposity into the model. Changes in coefficients pertaining to period of observation between the first and second models were interpreted as indicating the extent to which adiposity can account for trends in the prevalence of diabetes. Sensitivity analyses were conducted to investigate how alternative definitions of adiposity and diabetes status would affect results.
Results
The predicted prevalence of diabetes rose by 2.59% per year between 1988 and 2014 after adjusting for changes in population composition. Increasing adiposity explained 72% of the rise in diabetes. Results were consistent for men and women.
Conclusions
Rising levels of adiposity explained the large majority of the rise in diabetes prevalence between 1988 and 2014.
The prevalence of diabetes has risen rapidly in the United States over the last several decades. The age-standardized proportion of US adults with diabetes more than doubled between 1990 and 2008, increasing from 3.5% to 7.9% over this interval.(1) The upward trend in diabetes persists regardless of whether trends are measured using self-reported data or a clinical marker of diabetes status, such as fasting plasma glucose (FPG) or hemoglobin A1c (HbA1c).(1–3) Using these two clinical markers, the prevalence of diabetes among US adults reached 12.3% in 2011–12.(4)
A prominent explanation for the rise in diabetes prevalence is the increase in the proportion of the population that is overweight or obese.(5–7) Research on physiological mechanisms has identified a variety of potential pathways linking adiposity to diabetes, including activation by adipose tissue of free fatty acids and inflammatory cytokines.(8) Evidence from observational studies shows strong associations between general adiposity, measured using body mass index (BMI) and diabetes.(9) Waist circumference, a measure of abdominal adiposity, also shows an independent association with diabetes which rivals or exceeds in explanatory power the association between BMI and diabetes.(10–13)
Additional evidence comes from randomized trials, which have identified significant reductions in diabetes that were coincident with significant weight loss. One randomized trial found that patients assigned to bariatric surgery had significantly greater reductions in BMI, in HbA1c, and in fasting plasma glucose (FPG) than those assigned to medical therapy.(14) An earlier study of bariatric surgery found similar results with respect to weight loss and FPG when the comparison group included not only medical components but also caloric reduction.(15) Another study found that the relative risk of diabetes remission was 5.5 times greater among patients randomly assigned to bariatric surgery compared to those receiving conventional therapy.(16)
A rising level of adiposity is not the only factor that has been proposed to account for the growing prevalence of diabetes. Related explanations focus specifically on declining levels of physical activity (17) or increases in per capita sugar consumption.(18,19) Increased environmental exposure to Bisphenol A as a result of greater use of plastics in food preservation has also been cited as a possible cause.(20) Demographic changes may have also contributed. Hispanics and the elderly represent growing fractions of the US population and both groups have an above-average prevalence of diabetes.(21,22)
Increased awareness of the disease and adoption of lower clinical thresholds for diagnosing diabetes may also have produced a rise in the frequency with which diabetes is diagnosed given a particular set of clinical conditions.(22) However, increased awareness of the disease could not account for changes in prevalence identified by a specific biomarker applied uniformly to a national sample. The prevalence of diabetes may have also increased because people with diabetes are living longer relative to people without diabetes. Even if the incidence of diabetes were not increasing, its prevalence would rise if relative survivorship improved.(23)
Several other factors may be operating in the opposite direction. Cigarette smoking is a risk factor for developing diabetes (24) and smoking is declining. Those with higher educational attainment have a lower prevalence of diabetes (25) and educational attainments are increasing.
In this study, we assess the strength of the relationship between adiposity and diabetes at the population level using nationally representative data from the United States. In particular, we investigate whether the magnitude of the increase in adiposity can account for the magnitude of the rise in diabetes, in light of the individual-level relationship between adiposity and diabetes. We incorporate data on abdominal as well as general adiposity into the analysis given evidence that adnominal obesity may independently predict diabetes risk.(10–13) We also integrate data on weight history in addition to current weight status to capture potential cumulative effects of prior weight status and to account for any measurement error related to illness-induced weight loss.(26,27)
Research Design and Methods
The National Health and Nutrition Examination Survey (NHANES) is a nationally representative survey of the US population and includes a questionnaire as well as clinical and laboratory components. We combined data from the NHANES III (1988–1994) with data from the NHANES continuous waves collected in two-year cycles between 1999 and 2014. (28,29) We restricted the sample to adults aged 35–79 with non-missing data on adiposity measures, HbA1c and educational attainment. We excluded individuals who were pregnant at the time of the exam and those with extreme values of adiposity. These restrictions resulted in a final analytic sample of 38,106 individuals.
We used the HbA1c criterion to define diabetes. HbA1c better reflects average glycemia and exhibits greater stability and lower variation within individuals compared to other diagnostic markers such as FPG.(2,30) Furthermore, because HbA1c does not require fasting, failure to fast prior to the test is not a source of measurement error. Finally, compared to FPG, which is only available for a subset of NHANES participants, HbA1c was collected on the full examined sample, increasing the precision of estimates. We used the American Diabetes Association (ADA) guidelines (30) to classify individuals with diabetes as having an HbA1c greater than 6.5%. We further classified as diabetic persons whose HbA1c values were below 6.5% but who reported use of an oral hypoglycemic agent or insulin. In a sensitivity analysis, we repeated our basic analysis using self-reported diagnosis of diabetes. We also examined trends when the population at high risk of diabetes (HbA1c > 6.1%) was included with the diabetic population.
We incorporated data on both general and abdominal adiposity into the analysis. For the latter, we used data on waist circumference (measured in cm) which was collected by trained health technicians in the examination component of the NHANES. For general adiposity, we considered four separate measures, including current BMI, maximum lifetime BMI (max BMI), BMI at age 25 and BMI 10 years prior to survey. Current BMI was calculated using weight and height measured at the NHANES examination. The weight history measures were constructed using information on recalled weight combined with measured height at survey. The weight history measures were introduced because they are less susceptible to reverse causation (26,27) and because studies have shown that adiposity measures at earlier stages of life are significant predictors of the incidence of diabetes, controlling later life values of adiposity.(31–33)
We estimated a multivariable logistic regression model, Model 1, that predicted the odds of having diabetes as a function of age (continuous), sex, racial/ethnic group (Non-Hispanic White, Non-Hispanic Black, Hispanic, and Other), educational attainment (less than high school graduate, high school graduate, more than high school), and period of observation. We used two measures of period of observation: a continuous variable representing the midpoint year of the NHANES survey; and a set of dummy variables that distinguished between observations in NHANES III (1988–1994), chosen as the reference category, and those in NHANES continuous waves 1999–2002; 2003–2006; 2007–2010; and 2011–2014.
In the second stage, we estimated Model 2 by introducing adiposity measures into Model 1. We first introduced waist circumference into the model to capture abdominal obesity. We then introduced each of the four general adiposity measures into the model one variable at a time and evaluated model performance using the Akaike Information Criterion (AIC).(34) We limited selection to one variable from the four measures of general adiposity because the variables are highly collinear (see Supplemental Table 1). Changes in coefficients pertaining to period of observation between the first and second models indicated the extent to which adiposity can account for trends in the prevalence of diabetes.
In a preliminary analysis, we implemented a rescaling correction in the continuous time model to account for the fact that in nested logistic regression models, changes in coefficients may result both from mediation as well as from shifts in the scale of the model resulting from the introduction of a new variable.(35) As the estimates were not sensitive to the correction, we did not use it for our primary analyses. In an additional set of sensitivity analyses we examined (1) the effect of using self-reported data on diabetes status; (2) expanding the definition of diabetes to include those at high risk (HbA1c≥6.1); (3) using BMI at survey alone as the measure of adiposity; (4) stratifying analyses by sex; (5) including adjustment for smoking status (current, former, never) in the model.
Sample weights were incorporated to adjust for unequal probabilities of selection and non-response. Analyses were performed using STATA 13 (StataCorp, Texas, USA). We used the SVY routine, which uses Taylor series linearization, to estimate variances.
Results
Table 1 shows the distribution of variables considered in this analysis during the five time periods that we distinguish. Mean waist circumference increased from 95.2 cm. in 1988–94 to 101.2 in 2011–14. Each of the four variables referring to BMI also increased steadily over this period. The proportion Hispanic increased from 7.6% to 12.5%, while the proportion of the population who attended college grew from 41.1% to 63.6%.
Table 1.
Descriptive Statistics of the Sample by Survey Period
| NHANES Survey Period | |||||
|---|---|---|---|---|---|
| 1988–1994 | 1999–2002 | 2003–2006 | 2007–2010 | 2011–2014 | |
| N | 8,494 | 5,278 | 5,167 | 6,857 | 6,354 |
| Age, years | 52.9 | 52.5 | 53.0 | 53.3 | 54.0 |
| Sex, male | 47.9 | 48.8 | 48.4 | 49.0 | 48.5 |
| Race/ethnicity | |||||
| Non-Hispanic white | 80.4 | 75.6 | 76.2 | 73.2 | 69.9 |
| Non-Hispanic black | 9.2 | 9.6 | 10.1 | 10.0 | 10.3 |
| Hispanic | 7.6 | 11.5 | 9.0 | 10.8 | 12.5 |
| Other | 2.8 | 3.4 | 4.7 | 6.0 | 7.3 |
| Education | |||||
| Less than high school | 25.2 | 20.9 | 16.1 | 18.3 | 15.6 |
| High school | 33.7 | 25.1 | 26.7 | 24.1 | 20.8 |
| More than high school | 41.1 | 54.1 | 57.2 | 57.7 | 63.6 |
| Smoking Status | |||||
| Never | 41.1 | 46.6 | 47.2 | 51.7 | 52.7 |
| Former | 33.6 | 30.9 | 29.5 | 28.5 | 27.8 |
| Current | 25.3 | 22.5 | 23.3 | 19.8 | 19.5 |
| Abdominal Adiposity | |||||
| Weight Circumference, cm | 95.2 | 97.9 | 99.5 | 100.2 | 101.2 |
| General Adiposity | |||||
| Current BMI, kg/m2 | 27.3 | 28.4 | 28.9 | 29.1 | 29.3 |
| BMI 10 Years Prior, kg/m2 | 25.5 | 26.1 | 26.7 | 27.0 | 27.7 |
| BMI at Age 25, kg/m2 | 23.1 | 23.4 | 23.7 | 23.9 | 24.3 |
| Maximum BMI, kg/m2 | 29.3 | 30.5 | 31.2 | 31.3 | 31.9 |
BMI: Body mass index. Never smokers are defined as individuals who reported smoking less than 100 cigarettes during their lifetime. BMI and waist circumference were measured in the examination component of the NHANES. BMI was calculated using data on height and weight. BMI 10 years prior, at age 25 and at maximum were calculated using recalled data on weight combined with height measured at the time of the survey. Estimates are adjusted for sample weights.
Figure 1 presents the time trend in diabetes prevalence adjusted for changes in population composition. It is based on Model 1, a logistic regression predicting the odds of having diabetes as a function of age, sex, ethnicity, educational attainment, and period. The coefficients of Model 1 are presented in Supplemental Table 2. The predicted prevalence of diabetes in any particular period in Figure 1is based on the assumption that the distribution of variables, apart from period, is fixed at their mean values in 2011–14 while the coefficient pertaining to a particular period is unique to that period. The adjusted prevalence of diabetes rose from 7.4% in 1988–94 to 12.3% in 2011–14. We investigated whether time trends in diabetes prevalence were different for men and women by testing the significance of an interaction term between time (continuous) and sex. The sex difference in trend was not significant. As a result, the sexes were combined in the remainder of our analysis. A sensitivity analysis shows the consequences of treating the sexes separately.
Figure 1. Adjusted Diabetes Prevalence for US Adults Aged 35–79 across NHANES Survey Periods.
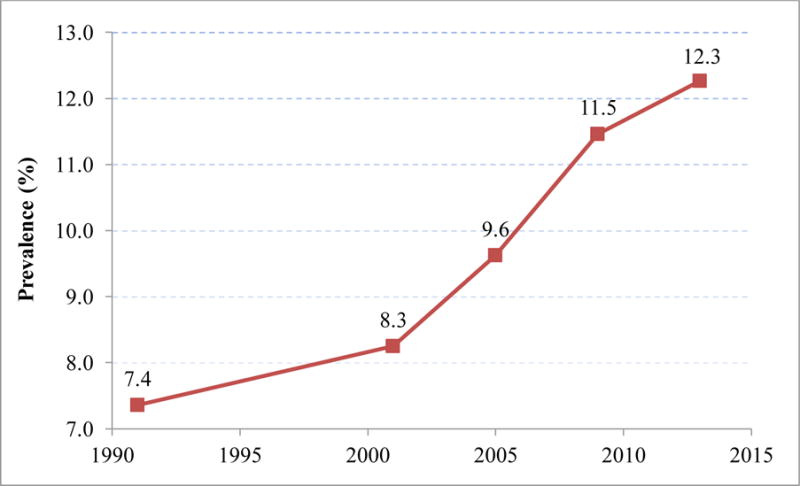
Diabetes prevalence in each survey period was standardized to the mean covariate values in 2011–2014. Estimates were generated using predicted probabilities from a logit regression model. The survey periods were 1988–1994, 1999–2002, 2003–2006, 2007–2010 and 201–2014.
Supplemental Figure 1 presents A1C values for models that include various combinations of adiposity variables. The addition of waist circumference to Model 1 produced the greatest improvement in (i.e., reduction of) AIC. Once waist circumference was in the model, the addition of BMI 10 years before baseline was associated with the largest improvement in model performance among the four BMI measures examined. So Model 2, the coefficients of which are also presented in Supplemental Table 2, includes both waist circumference and BMI 10 years before survey.
Table 2 shows that the coefficient of “year of observation” in Model 1 is 1.0259; the odds of being diabetic increased by about 2.59% per year over the period from 1988 to 2014. The increase is statistically significant at p<.001. The increase was not strictly linear. Table 2 also presents the coefficients of categorical variables representing different periods, relative to odds ratios in 1988–94. Across the three decades, the prevalence of diabetes rose by 76%. The prevalence rose most rapidly between 2003–06 and 2007–10. However, the increase is monotonic and linearity remains a reasonable approximation over the entire period.
Table 2.
Odds Ratios Associated with Survey Period in Continuous and Discrete Time Models
| Model 1 – Unadjusted | Model 2 – Adjusted | % Explained | |
|---|---|---|---|
| Continuous Time | 1.0259 | 1.0074 | 71.6 |
| Discrete Time | |||
| 1988–1994 | 1.00 | 1.00 | – |
| 1999–2002 | 1.13 | 0.95 | 140.1 |
| 2003–2006 | 1.34 | 1.03 | 91.6 |
| 2007–2010 | 1.63 | 1.19 | 70.3 |
| 2011–2014 | 1.76 | 1.18 | 76.3 |
Odds ratios from Model 1 include no control for adiposity measures; those from Model 2 control for waist circumference and BMI 10 years prior to survey. For the continuous time models, observations are assigned to the midpoint of the survey wave. For the categorical models, survey periods are modeled using a series of indicator variables.
Table 2 also presents the time trends after the two adiposity variables have been controlled. The decline in the coefficient of “year of observation” across the two models implies that 71.6% of the trend has been removed by controlling adiposity. When 1988–94 is used as the baseline, the Table shows that between 70% and 140% of the trend ending in different periods has been eliminated. Trends in the coefficients before and after adiposity is accounted for are shown graphically in Figure 2.
Figure 2. Odds Ratios Associated with Survey Period in Models Adjusted and Unadjusted for Adiposity Measures.
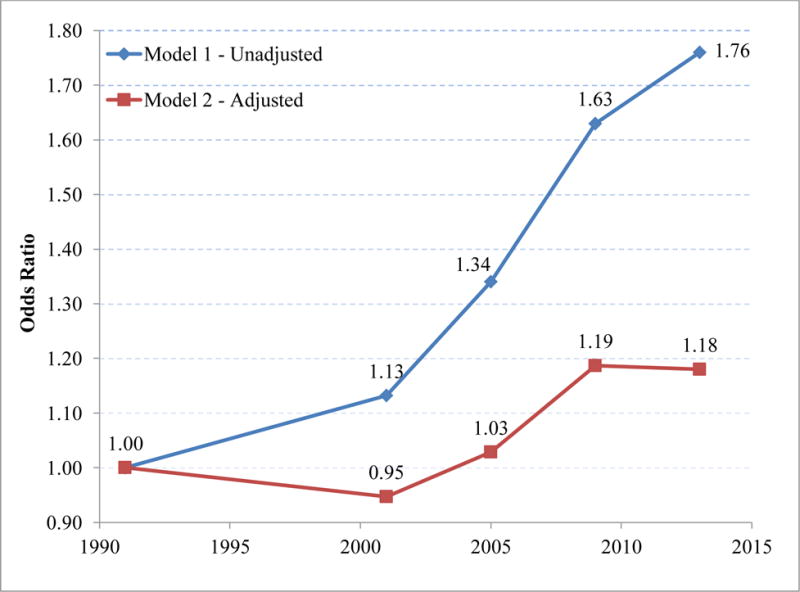
Odds ratios from the unadjusted model include no control for adiposity measures; those from the adjusted model control for waist circumference and BMI 10 years prior to survey.
Sensitivity Analyses
1) Using Self-Reported Diagnosis of Diabetes
Some combination of increased awareness of diabetes and changing criteria for diagnosing it has reduced the proportion of cases with clinical diabetes that are undiagnosed. (3,22) Accordingly, we anticipated that diabetes prevalence would be rising faster when self-reports are used to identify it than when HbA1c is used. Table 3 shows that the annual increase in prevalence was slightly faster when self-reports are used (2.78%/yr) than when HbA1c is used (2.59%/yr). A somewhat smaller percentage of the increase was explained by adiposity when self-reports are used.
Table 3.
Analyses of Sensitivity of Results to Changes in Model Specifications
| Sensitivity Analysis | Coef (Cts Time Variable) | % Explained | |
|---|---|---|---|
| Model 1 | Model 2 | ||
| Baseline Model | 1.0259 | 1.0074 | 71.6 |
| 1. Using self-reported diagnosis of diabetes | 1.0278 | 1.0102 | 63.3 |
| 2. Pre-diabetes & diabetes | 1.0309 | 1.0144 | 53.4 |
| 3. Use of baseline BMI only | 1.0259 | 1.0134 | 48.1 |
| 4. Analyses stratifying by gender | |||
| A. Men | 1.0240 | 1.0064 | 73.3 |
| B. Women | 1.0283 | 1.0092 | 67.7 |
| 5. Adjustment for smoking status | 1.0262 | 1.0077 | 70.7 |
Sensitivity analyses: 1: Self-reported data were ascertained at interview by asking respondents if they ever received a diagnosis of diabetes from a physician. 2: Individuals with diabetes (6.5%) or high risk for diabetes (6.1%) or below this threshold but currently on treatment for diabetes were included in the numerator. 3: Measured height and weight at survey were used to evaluate BMI. 4: Models were implemented with stratification on gender; 5: adjustment for smoking status was carried out using the categories never, former and current smoker.
2) Using a measure that includes those at high risk of diabetes as well as those with diabetes
We investigated whether rising adiposity could also account for the rapid growth of individuals in the range of HbA1c values above 6.1%. Table 3 shows that the growth of population in this category is much faster at 3.09%/yr. than when the population is limited to those with diabetes itself, 2.59%/yr. And rising adiposity accounts for only 53% of the rapid growth in the prevalence of this combined category.
3) Using Only BMI at baseline
The most common indicator of adiposity used in studies of its health effects is BMI at survey. (26,27) We re-estimated Model 2 using only this indicator. Results shown in Table 3 indicate that changes in the distribution of BMI at baseline account for a much smaller percentage of the increase in diabetes, 48%, than when our two preferred adiposity measures are used (72%).
4) Analyzing men and women separately
We did not find a significant sex interaction in the trend in diabetes prevalence. But sex differences are sufficiently interesting that we have re-estimated Models 1 and 2 separately for men and women. Results in Table 3 show that the time trend in HbA1c prevalence is similar for men and women, with men’s prevalence rising by 2.40%/yr. and women’s by 2.83%/yr. Furthermore, a similar percentage of the trend for men and women is explained by adiposity: 73% for men and 68% for women.
5) Adding smoking to the model
Smoking is a potential confounder of the relation between adiposity and diabetes (14. 39). We introduce smoking (current, former, never) into Models 1 and 2 with results shown in Table 3. The introduction of smoking as an additional control in Model 1leaves the annual upward trend in diabetes virtually unchanged at 2.62% (vs. 2.59%).The percentage of the upward trend in diabetes explained by adiposity is also nearly unchanged at 70.7% (vs. 71.6%).
Discussion
Using HbA1c as the basic indicator of diabetes, we find that the prevalence of diabetes (i.e., the odds of having diabetes) has risen by about 2.59% per year between 1988–94 and 2011–14. This growth rate is based on prevalence values that are adjusted for changes in the composition of the population with respect to age, sex, ethnicity, and educational attainment. When increases in adiposity over this time interval are accounted for, the prevalence of diabetes would have grown by only about 0.74% per year. So we conclude that rising adiposity accounts for about 72% of the rise in diabetes over this period. The estimated value of 72% is approximately the same for men and women and is robust to the inclusion of smoking in the basic model.
Our results for men and women differ from those of a previous analysis, which found that rising obesity accounted for all of the rise in diabetes for women but a little less than half of the rise for men over the period 1976–80 to 2007–10.(21) That analysis used a less precise measure of diabetes (a combination of self-reports and fasting plasma glucose) and a measure of adiposity that is more susceptible to reverse causation (BMI at survey). (26,27) Our sensitivity analyses demonstrated that use of self-reported diabetes and of BMI at survey produced a smaller assignment of responsibility to adiposity in diabetes trends than the measures used in this analysis. These differences may help account for the smaller contribution of obesity to diabetes trends for men that was found in the previous study. There is no obvious explanation of the difference in explanatory power for women, but one contributing factor may be that the increase in diabetes for women in this earlier study was less than half of that for men, whereas our results show that women had a somewhat faster increase than men (Table 3).
Strengths of this analysis include its use of data drawn from national probability samples that cover a period of 26 years, a period that saw very rapid increases in the prevalence of diabetes. We were able to examine this trend controlling for changes in the composition of the population with respect to age, sex, race/ethnicity, and educational attainment. We also used a validated indicator of diabetes that was measured consistently over the period. Another strength is that systematic model selection criteria were employed to choose among four general adiposity measures rather than assuming a priori that one measure was superior. Our measures include an indicator of central adiposity and elements of an individual’s weight history, features that earlier research had shown to be predictive of diabetes incidence. We find that waist circumference and BMI 10 years earlier outperform BMI at survey with respect to both predicting the prevalence of diabetes at an individual level and accounting for national trends in diabetes prevalence.
The analysis also had several limitations. First, we were unable to differentiate between changes in the incidence of diabetes and changes in the relative survival of individuals with diabetes. Longitudinal data are required in order to make this distinction but there are no national data using biomarkers for diabetes that permit such an analysis. Second, because the BMI history measures were calculated using data on self-reported past weight status combined with measured height at exam, measurement error may be introduced as a result of both systematic underreporting of prior weight status as well as any age-related loss of height. Because these two sources of error are offsetting, the net direction of bias is difficult to predict. Our use of a continuous rather than categorical measure of BMI is likely to mitigate some of this bias.(36) Third, the measure of abdominal obesity used in this analysis, waist circumference, may be subject to reverse causation, a reduction in adiposity that is produced by illness, including diabetes itself.(27) If reverse causality is present, estimates of the impact of adiposity on diabetes would be biased downwards. One study found that there was no significant increase in diabetes incidence associated with loss of waist circumference, in contrast to a large increase associated with weight loss.(12) This result suggests that reverse causation may be a smaller source of bias for analyses using waist circumference than for analyses using body mass index. Finally, we did not estimate the contribution of adiposity net of dietary behaviors and physical inactivity and thus our results may partially reflect the contributions by these factors. Future studies focused on the independent contributions of these upstream determinants would be of interest.
Conclusion
We conclude that rising adiposity is the major factor in the increase in diabetes prevalence in the United States over the period from 1988 to 2014. While other influences were doubtless at work, we can account for the large majority of the rise in diabetes prevalence over this period through adiposity alone. This demonstration adds urgency to the search for ways to arrest and reverse the growing prevalence of obesity in the United States.
Supplementary Material
Acknowledgments
This project was supported by the National Institute on Aging [R01AG040212] and the National Center for Health Statistics [R03SH000037]. The study sponsors had no role in the design or implementation of this research.
Footnotes
Conflict of Interest Statement
AS has received research funding from Johnson & Johnson, Inc.
Author Contributions
AS and SP take full responsibility for the contents of the article. Both authors contributed to study design, analyses and manuscript preparation.
References
- 1.Geiss LS, Wang J, Cheng YJ, Thompson TJ, Barker L, Li Y, et al. Prevalence and Incidence Trends for Diagnosed Diabetes Among Adults Aged 20 to 79 Years, United States, 1980–2012. JAMA. 2014;312(12):1218–26. doi: 10.1001/jama.2014.11494. [DOI] [PubMed] [Google Scholar]
- 2.Cowie CC, Rust K, Byrd-Holt DD, Gregg EW, Ford ES, Geiss LS, et al. Prevalence of Diabetes and High Risk for Diabetes Using A1C Criteria in the US Population in 1988 – 2006. Diabetes Care. 2010;33(3) doi: 10.2337/dc09-1524. [DOI] [PMC free article] [PubMed] [Google Scholar]
- 3.Selvin E, Parinnello C. Trends in Prevalence and Control of Diabetes in the United States. Ann Intern Med. 2014;12(5):1988–94. doi: 10.7326/M13-2411. [DOI] [PMC free article] [PubMed] [Google Scholar]
- 4.Menke A, Casagrande S, Geiss L, Cowie CC. Prevalence of and Trends in Diabetes Among Adults in the United States, 1988–2012. JAMA. 2015;314(10):1021. doi: 10.1001/jama.2015.10029. [DOI] [PubMed] [Google Scholar]
- 5.Geiss LS, Pan L, Cadwell B, Gregg EW, Benjamin SM, Engelgau MM. Changes in Incidence of Diabetes in U.S. Adults, 1997–2003. Am J Prev Med. 2006;30(5):371–7. doi: 10.1016/j.amepre.2005.12.009. [DOI] [PubMed] [Google Scholar]
- 6.Yaturu S. Obesity and type 2 diabetes. J Diabetes Mellit. 2011;1(4):79–95. [Google Scholar]
- 7.Fishman EI, Stokes A, Preston SH. The dynamics of diabetes among birth cohorts in the U.S. Diabetes Care. 2014 Apr;37(4):1052–9. doi: 10.2337/dc13-1982. [DOI] [PMC free article] [PubMed] [Google Scholar]
- 8.Hussain A, Hydrie MZI. Review Article : Type 2 Diabetes and obesity : A review strongly implicated in the development of insulin. J Diabetol. 2010;2(1):1–7. [Google Scholar]
- 9.Nguyen NT, Nguyen X-MT, Lane J, Wang P. Relationship between obesity and diabetes in a US adult population: findings from the National Health and Nutrition Examination Survey, 1999–2006. Obes Surg. 2011;21(3):351–5. doi: 10.1007/s11695-010-0335-4. [DOI] [PMC free article] [PubMed] [Google Scholar]
- 10.Janiszewski P, Janssen I, Ross R. Commonly Evaluated Cardiometabolic Risk. Diabetes Care. 2007;30(12):3105–9. doi: 10.2337/dc07-0945. [DOI] [PubMed] [Google Scholar]
- 11.Qiao Q, Nyamdorj R. Is the association of type II diabetes with waist circumference or waist-to-hip ratio stronger than that with body mass index? Eur J Clin Nutr Nature Publishing Group. 2010;64(1):30–4. doi: 10.1038/ejcn.2009.93. [DOI] [PubMed] [Google Scholar]
- 12.Berentzen TL, Jakobsen MU, Halkjaer J, Tjønneland A, Sørensen TIA, Overvad K. Changes in Waist Circumference and the incidence of diabetes in middle-aged men and women. PLoS One. 2011;6(8):1–9. doi: 10.1371/journal.pone.0023104. [DOI] [PMC free article] [PubMed] [Google Scholar]
- 13.Biggs ML, Mukamal KJ, Luchsinger JA, Ix JH, Carnethon MR, Newman AB, et al. Association between adiposity in midlife and older age and risk of diabetes in older adults. JAMA. 2010;303(24):2504–12. doi: 10.1001/jama.2010.843. 2010/06/24. [DOI] [PMC free article] [PubMed] [Google Scholar]
- 14.Schauer PR, Bhatt DL, Kirwan JP, Wolski K, Brethauer SA, Navaneethan SD, et al. Bariatric surgery versus intensive medical therapy for diabetes–3-year outcomes. N Engl J Med. 2014 May 22;370(21):2002–13. doi: 10.1056/NEJMoa1401329. [DOI] [PMC free article] [PubMed] [Google Scholar]
- 15.O’Brien PE, Dixon JB, Laurie C, Skinner S, Proietto J, Mcneil J, et al. Treatment of Mild to Moderate Obesity with Laparoscopic Adjustable Gastric Banding or an Intensive Medical Program. Ann Intern Med. 2006:625–34. doi: 10.7326/0003-4819-144-9-200605020-00005. [DOI] [PubMed] [Google Scholar]
- 16.Dixon JB, Brien PE, Playfair J, Chapman L, Schachter LM, Skinner S, et al. Adjustable Gastric Banding and Conventional Therapy for Type 2 Diabetes: A Randomized Controlled Trial. JAMA. 2008;299(3):316–23. doi: 10.1001/jama.299.3.316. [DOI] [PubMed] [Google Scholar]
- 17.Hawley JA, Zierath JR, editors. Human Kinetics. 2008. Physical Activity and Type 2 Diabetes: Therapeutics Effects and Mechanisms of Action. [Google Scholar]
- 18.Basu S, Yoffe P, Hills N, Lustig RH. The Relationship of Sugar to Population-Level Diabetes Prevalence: An Econometric Analysis of Repeated Cross-Sectional Data. PLoS One. 2013;8(2) doi: 10.1371/journal.pone.0057873. [DOI] [PMC free article] [PubMed] [Google Scholar]
- 19.Lustig RH, Schmidt LA, Brindis CD. Public health: The toxic truth about sugar. Nature. 2012;482(7383):27–9. doi: 10.1038/482027a. [DOI] [PubMed] [Google Scholar]
- 20.Huo L, Lyons J, Magliano DJ. Infectious and Environmental Influences on the Obesity Epidemic. Curr Obes Rep. 2016;5(3):375–82. doi: 10.1007/s13679-016-0224-9. [DOI] [PubMed] [Google Scholar]
- 21.Menke A, Rust KF, Fradkin J, Cheng YJ, Cowie CC. Associations between trends in race/ethnicity, aging, and body mass index with diabetes prevalence in the United States: A series of cross-sectional studies. Ann Intern Med. 2014;161(5):328–35. doi: 10.7326/M14-0286. [DOI] [PubMed] [Google Scholar]
- 22.Gregg EW, Cadwell BL, Cheng YJ, Cowie CC, Williams DE, Geiss L, et al. Trends in the prevalence and ratio of diagnosed to undiagnosed diabetes according to obesity levels in the U.S. Diabetes Care. 2004;27(12):2806–12. doi: 10.2337/diacare.27.12.2806. [DOI] [PubMed] [Google Scholar]
- 23.Gregg EW, Sattar N, Ali MK. The changing face of diabetes complications. lancet Diabetes Endocrinol Elsevier Ltd. 2016;4(6):537–47. doi: 10.1016/S2213-8587(16)30010-9. [DOI] [PubMed] [Google Scholar]
- 24.Willi C, Bodenmann P, Ghali WA, Faris PD, Cornuz J. Active Smoking and the Risk of Type 2 Diabetes: A Systematic Review and Meta-analysis. JAMA. 2007;298(22):2654–64. doi: 10.1001/jama.298.22.2654. [DOI] [PubMed] [Google Scholar]
- 25.Borrell LN, Dallo FJ, White K. Education and diabetes in a racially and ethnically diverse population. Am J Public Health. 2006;96(9):1637–42. doi: 10.2105/AJPH.2005.072884. [DOI] [PMC free article] [PubMed] [Google Scholar]
- 26.Stokes A. Using maximum weight to redefine body mass index categories in studies of the mortality risks of obesity. Popul Health Metr Population Health Metrics. 2014 Jan;12(1):6. doi: 10.1186/1478-7954-12-6. [DOI] [PMC free article] [PubMed] [Google Scholar]
- 27.Stokes A, Preston SH. Revealing the burden of obesity using weight histories. Proc Natl Acad Sci U S A. 2016;113(3):572–7. doi: 10.1073/pnas.1515472113. [DOI] [PMC free article] [PubMed] [Google Scholar]
- 28.National Center for Health Statistics. Plan and operation of the third National Health and Nutrition Examination Survey 1988–94. Vital Heal Stat. 1994;1(32) [PubMed] [Google Scholar]
- 29.National Center for Health Statistics. National Health and Nutrition Examination Survey : Plan and Operations, 1999 – 2010. Vital Heal Stat. 2010;1(56):1999–2010. [PubMed] [Google Scholar]
- 30.American Diabetes Association. Diagnosis and classification of diabetes mellitus. Diabetes Care. 2010 Jan;33(Suppl 1):S62–9. doi: 10.2337/dc10-S062. [DOI] [PMC free article] [PubMed] [Google Scholar]
- 31.Reis JP, Hankinson AL, Loria CM, Lewis CE, Powell-Wiley T, Wei GS, et al. Duration of abdominal obesity beginning in young adulthood and incident diabetes through middle age: the CARDIA study. Diabetes Care. 2013;36(8):1241–7. doi: 10.2337/dc12-1714. [DOI] [PMC free article] [PubMed] [Google Scholar]
- 32.Hu Y, Bhupathiraju SN, De Koning L, Hu FB. Duration of obesity and overweight and risk of type 2 diabetes among US women. Obesity. 2014;22(10):2267–73. doi: 10.1002/oby.20851. [DOI] [PMC free article] [PubMed] [Google Scholar]
- 33.Wei GS, Coady SA, Reis JP, Carnethon MR, Coresh J, D’agostino RB, et al. Duration and degree of weight gain and incident diabetes in younger versus middle-Aged black and white Adults: ARIC, CARDIA, and the framingham heart study. Diabetes Care. 2015;38(11):2042–9. doi: 10.2337/dc14-2770. [DOI] [PMC free article] [PubMed] [Google Scholar]
- 34.Akaike H. A new look at the statistical model identification. IEE Trans Autom Control. 1974;19:716–23. [Google Scholar]
- 35.Karlson KB, Holm A, Breen R. Comparing Regression Coefficients Between Models using Logit and Probit: A New Method. Sociol Methodol. 2012;42:286–313. [Google Scholar]
- 36.Preston SH, Fishman E, Stokes A. Effects of categorization and self-report bias on estimates of the association between obesity and mortality. Ann Epidemiol. 2015;25(12):907–11. doi: 10.1016/j.annepidem.2015.07.012. [DOI] [PMC free article] [PubMed] [Google Scholar]
Associated Data
This section collects any data citations, data availability statements, or supplementary materials included in this article.