

Abstract
A surface-confined aqueous reversible addition-fragmentation chain transfer (SCARAFT) polymerization method was developed to coat capillaries for use in capillary zone electrophoresis (CZE). SCARAFT polymerization primarily takes place on the inner surface of the capillary instead of in solution, which greatly improves the homogeneity of the coating. Capillaries treated with this coating produced an electroosmotic mobility of 2.8 ± 0.2 × 10⁻⁶ cm2·V−1·s−1 (N=3), which is roughly an order of magnitude lower than that of commercial linear polyacrylamide (LPA) coated capillaries. Coated capillaries were evaluated for bottom-up proteomic analysis using CZE. The very low electroosmotic mobility results in a 200-minute separation and improved single-shot analysis. An average of 977 protein groups and 5,605 unique peptides were identified from 50 ng of an E. coli digest and 2,158 protein groups and 10,005 peptides were identified from 25 ng of a HeLa digest using single-shot analysis with a SCARAFT-acrylamide capillary coupled to a Q Exactive HF mass spectrometer. The coating is stable. A single capillary was used for over 200 hours (8.4 days) of continuous operation. RSD in migration time was between 2 and 3% for selected ion electropherograms (SIEs) generated for six ions; median theoretical plate counts ranged from 240,000 to 600,000 for these SIEs. Various types of coatings could be prepared by simply changing the functional vinyl monomers in the polymerization mixture. Positively charged coatings using direct attachment and formation of a block-copolymer were prepared and demonstrated for the separation of mixtures of intact proteins.
Graphical abstract
Introduction
Capillary zone electrophoresis (CZE) is attracting increased attention for mass spectrometry-based proteomic analysis due to its outstanding mass detection limits, orthogonality to reversed-phase chromatography, and low cost.1–6 While separation is based on the charge-to-size ratio of analyte in CZE, the characteristics of the capillary play important roles in the electrophoretic performance. Non-specific adsorption of analyte to silanol groups on the inner surface of the capillary leads to sample loss, peak tailing, and poor reproducibility. High electroosmotic flow (EOF) produced by the silanol groups results in a relatively short separation window, which limits the number of tandem mass spectra that can be generated during proteomic analysis, which limits the number of peptide identifications per run.
Various capillary coatings have been developed to overcome these problems,. Currently, the most widely used coating method is based on free radical polymerization reactions.7, 8 In this method, the inner wall of the fused capillary is pretreated by using a compound that contains two functional groups. A methoxy group reacts specifically with the silanol groups on the inner wall of the capillary and a vinyl group enters in the polymerization reaction, such as γ-methacryloxypropyltrimethoxysilane. Then, the pretreated capillary is filled with a de-aerated polymerization mixture, typically composed of the acrylamide, N,N,N’,N’-tetramethylethylenediamine, and potassium persulphate. This procedure forms a layer of noncrosslinked polyacrylamide, usually referred to as linear polyacrylamide (LPA).
There are several disadvantages to this method. Free radical scavengers can be present at trace levels, leading to irreproducible coating characteristics. In addition, the acrylamide monomer not only reacts with the functional group on the inner wall of the capillary but also reacts with other acrylamide monomers in the solution, and the polymer formed in solution can clog the capillary, leading to the failure of the coating process.
To overcome these problems, Huang and colleagues developed a surface-confined atom transfer radical polymerization (SCATRP) method to covalently bond both linear and cross-linked polymer films to silica.9 Infrared spectroscopy showed that the film growth is controllable, and atomic force microscopy revealed that smooth films were prepared. CZE of strongly basic proteins using SCATRP-coated capillaries provided the high efficiency expected for polyacrylamide. However, ATRP is governed by a transition-metal-catalyzed activation and deactivation equilibrium, and traditional ATRP systems require high catalyst concentration to maintain activity throughout the polymerization.10 It is difficult to remove the transition-metal ions after the polymerization reaction; the presence of residual amounts of the metal catalyst in polymers often raises concerns in biomedical applications,11 and bipyridine adsorption during ATRP would resulted in anodic EOF during CZE at low pH.12
In contrast, reversible addition-fragmentation chain transfer (RAFT) polymerization avoids use of metal catalysts, and is tolerant of a wide variety of reaction conditions and functionalities.13–16 Ali and Cheong reported a method for the immobilization of N-phenylacrylamide-styrene copolymer on the inner surface of capillaries with RAFT polymerization for applications in electrochromatograpy.17–19 A ligand with a terminal halogen (4-chloromethylphenyl isocyanate), or 4-(trifluoromethoxy) phenyl isocyanate was bound to the inner surface of a pretreated silica capillary in the presence of dibutyltin dichloride as a catalyst through an isocyanate-hydroxyl reaction.17–18 Attachment of initiator (sodium diethyl dithiocarbamate) to the bound ligand was carried out and followed by in situ polymerization. The resulting capillary showed good separation performance for derivatized saccharide isomers and tryptic digest of cytochrome C in capillary electrochromatography with UV detection. The structure of the prepared block copolymer is not clear because all the monomers were added to the polymerization mixture before the RAFT polymerization reaction. In addition, the living characteristic of the resulted polymer was not demonstrated. Moreover, the reaction was carried out in organic solvents (toluene or p-xylene), which are not environment-friendly. Finally, the RAFT-polymerized coated column was not evaluated for proteomics applications in CZE.
In this paper, we describe an environmentally friendly coating method based on surface-confined aqueous reversible addition-fragmentation chain transfer (SCARAFT) polymerization reaction for covalently bonding polymers to capillary inner surfaces. The capillary wall is first treated with a bifunctional chain transfer reagent. A monomer and initiator are added to form a coating. Various monomers can be used to produce neutral and charged coatings. The living characteristic of the coating prepared by the SCARAFT method was confirmed by preparing a block copolymer coating, wherein a neutral coating and a positively charged coating were prepared sequentially. The coated capillaries were evaluated by measuring the EOF and by analyzing tryptic digests and a protein mixture with CZE.
EXPERIMENTAL SECTION
Reagents and Chemicals
Formic acid (FA), acetic acid (HAc), acrylamide, [2-(methacryloyloxy)ethyl]trimethylammonium chloride solution (80 wt.% in H2O), 4,4 -azobis(4-cyanovaleric acid), cyanomethyl [3-(trimethoxysilyl)propyl] trithiocarbonate, ammonium acetate, bovine pancreas TPCK-treated trypsin, benzyl alcohol, dithiothreitol (DTT), and iodoacetamide (IAA) were purchased from Sigma-Aldrich (St. Louis, USA). Pierce™ HeLa Protein Digest Standard was purchased from Thermo Fisher Scientific (Hanover Park, USA). Methanol was purchased from Honeywell Burdick & Jackson (Wicklow, Ireland). Uncoated fused silica capillary (50 µm i.d. × 150 µm o.d. and 50 µm i.d. × 350 µm o.d.) was purchased from Polymicro Technologies (Phoenix, AZ). Water was deionized by a Nano Pure system from Thermo Scientific (Marietta, OH).
Preparation of the coated capillaries by surface-confined aqueous reversible-addition fragmentation transfer polymerization method
The schematic diagram for preparation of the LPA coated capillary by SCARAFT method is shown in Figure 1, and has some similarities to the protocol in reference 20. The fused silica capillary was pretreated by washing with 0.1 M NaOH for 2 h, flushing with water until the outflow reached pH ~7.0, flushing with 0.1 M HCl for 12 h, and flushing again with water until the outflow reached pH ~7.0. The capillary was finally dried with a nitrogen stream overnight at room temperature. Then, the capillary was filled with 50% cyanomethyl [3-(trimethoxysilyl)propyl] trithiocarbonate solution in MeOH(v/v) and incubated in a water bath at 45 °C for 12 h. The capillary was then rinsed with MeOH to flush out the residual reagent and dried with a nitrogen stream. At this point, the inner wall of the capillary was modified by a layer of cyanomethyl [3-(trimethoxysilyl)propyl] trithiocarbonate, which is the chain transfer agent for subsequent attachment of polymer to the wall during the SCARAFT polymerization reaction. For coating the capillary, a modified method from a report was used.21 A polymerization mixture was prepared by mixing acrylamide (0.56 M) and 4,4’-azobis(4-cyanovaleric acid) (5.42 × 10⁻⁴ M) in an acetate buffer (pH 5.2, 0.27 M acetic acid, and 0.73 M sodium acetate) at room temperature and stirring for about 10 min under nitrogen to form a homogeneous solution. The mixture then was introduced into the pretreated capillary and incubated at 60 °C for various reaction times. The coated capillary was flushed with MeOH to remove residuals in the capillary and conditioned with the background electrolyte before CZE analysis.
Figure 1.

Schematic diagram for preparation of a coated capillary by SCARAFT.
Preparation of positively charged capillaries by SCARAFT method
A coated capillary with positive charge was prepared using the SCARAFT method by replacing acrylamide with 0.56 M [2-(methacryloyloxy)ethyl]trimethylammonium chloride.
Preparation of the block copolymer coating
First, the LPA coating was prepared by using SCARAFT method as described above. Then, a positively charged coating was prepared on the LPA coating using the SCARAFT method by replacing acrylamide with 0.56 M [2-(methacryloyloxy)ethyl]trimethylammonium chloride.
CZE-ESI-MS/MS analysis
The CZE system consisted of two high-voltage power supplies (Spellman CZE 1000R) and an electrokinetically pumped nanospray interface, which coupled the CZE separation capillary to a mass spectrometer.22–24 The electrospray emitter was made from a borosilicate glass capillary (1.0 mm o.d. × 0.75 mm i.d., 10 cm long) pulled with a Sutter instrument P-1000 flaming/brown micropipette puller; the size of the emitter opening was 15–20 µm. The electrospray sheath electrolyte was 10% (v/v) methanol with 0.5% FA. The background electrolyte was 1 M HAc in water. The sample was injected by nitrogen pressure. Separation voltage was applied at the injection end of the capillary. 1.6 kV was applied to the sheath flow reservoir for electrospray. Voltage programming was controlled by LabView software. The mass spectrometer’s operating parameters are described below.
Determination of EOF
The method used for the determination of EOF was similar to a method reported by Williams and Vign with minor modification.25 Details are presented in the supporting information.
Preparation of E. coli sample
The method used for the preparation of the E. coli sample is described in Supporting Information.
Preparation of Xenopus laevis sample
The method used for the preparation of the Xenopus laevis sample is described in Supporting Information.
Long term stability testing
The long term stability of the 50 µm i.d. × 350 µm o.d. × 100 cm LPA coated capillary was evaluated by using 2 mg/mL of the Xenopus laevis proteins digest dissolved in 30 mM NH4HCO3. A PrinCE Next 840 Series autosampler (from PrinCE Technologies) coupled to a LTQ XL mass spectrometer (Thermo Scientific) was used to generate 121 consecutive separations of the Xenopus laevis digest followed by a blank injection. In this analysis, a 25 nL sample was injected by pressure every 100 min for 201.7 h (8.4 days) of continuous separation. No rinse or regeneration step was performed between injections.
UPLC-ESI-MS/MS analysis
A nanoACQUITY UltraPerformance LCH (UPLCH) system (Waters, Milford, MA, USA) with a UPLC BEH 130 C18 column (Waters, 100 µm × 100 mm, 1.7 µm) was coupled to an LTQ Orbitrap Velos mass spectrometer (Thermo Fisher Scientific) for peptide separation and identification. Mobile phase A (0.1%FA in water) and mobile phase B (0.1% FA in ACN) were used as mobile phases for gradient separation. Peptides were automatically loaded onto a commercial C18 reversed phase column and flushed with 2% buffer B for 10 min at a flow rate of 1 µL/min, then followed by gradient: 10–11 min, 2–8% B; 11–71 min, 8–30% B; 71–72 min, 30–80% B; 72–77 min, 80% B; 77–78 min, 80–2% B; 78–90 min, 2% B. The eluted peptides from the C18 column were pumped through a capillary tip for electrospray. The MS parameters were the same as that used for CZE-ESI-MS/MS analysis.
Mass Spectrometer Operating Parameters
An LTQ-Orbitrap Velos mass spectrometer (Thermo Fisher Scientific) was used to optimize the coating conditions and for the comparison between CZE and UPLC methods. The electrospray voltage was 1.6 kV, and the ion transfer tube temperature was held at 300 °C. The S-Lens RF level was 50.00. The mass spectrometer was programmed in data-dependent mode. Full MS scans were acquired in the Orbitrap mass analyzer over the m/z 380–1800 range with resolution of 30,000 (m/z 400) and the number of microscans was set to 1. The target value was 1.00E+06, and maximum injection time was 500 ms. For MS/MS scans, the 20 most intense peaks with charge state ≥ 2 were sequentially isolated and further fragmented in the collision-induced dissociation mode following one full MS scan. The normalized collision energy was 35%.
A Q Exactive HF mass spectrometer (Thermo Scientific) was used to evaluate the reproducibility of the coating method and for analysis of the HeLa digest. The mass spectrometer was programmed in data-dependent mode. A top 20 method was used. The S-lens RF level was set at 60, and heated capillary at 300 °C. Full scan resolution was set to 60,000 at m/z 200. Full scan target was 3.00E+06 with a maximum fill time of 50 ms. Mass range was set to m/z 350–1,800. Target value for fragment scans was set at 1.00E+05, and intensity threshold was kept at 1.00E+05. Isolation width was set at 1.4 Th. A fixed first mass of 100 was used. Normalized collision energy was set at 28. The proteins mixture was analyzed in an intact mode. Full MS scans were acquired in the Orbitrap over the m/z 600–2000. The three most intense peaks with charge state ≥5 were selected in data dependent fashion for fragmentation. The AGC target value for MS1 was 1.00E+06 with a maximum injection time of 100 ms, whereas the AGC target value for MS2 scans is 5.00E+05 and a maximum injection time is 200 ms. Seven and three microscans were used in MS1 and MS2 scans, respectively. An exclusion window of ±10 ppm was constructed around the monoisotopic peak of each selected precursor for 5 s. Other parameters were the same as above.
An LTQ XL mass spectrometer (Thermo Scientific) was used to evaluate the long term stability of the LPA coated capillary. Full MS scans were acquired over the 380–1800 m/z range.
Database Searching
Database searching of the raw files was performed in Proteome Discoverer 1.4 (Thermo) with MASCOT 2.5. The SwissProt databases with taxonomy as E. coli and Homo sapiens were used as database for E. coli cell lysate and HeLa cell line proteome digest, respectively. Database searching for the reversed database was also performed to evaluate the false discovery rate. The database searching parameters included full tryptic digestion and allowed up to two missed cleavages, the precursor mass tolerance was set at 10 ppm, and fragment mass tolerance was 0.5 Da for the data obtained on the LTQ-Orbitrap Velos mass spectrometer and 0.05 Da for the data obtained on the Q Exactive HF instrument. Carbamidomethylation (C) was set as a fixed modification. Oxidation (M) and deamidated (NQ) were set as variable modifications. On the peptide level, peptide confidence value as high was used to filter the peptide identification, and the corresponding false discovery rate on peptide level was less than 1%. On the protein level, protein grouping was enabled.
RESULTS AND DISCUSSION
Preparation of the linear polyacrylamide coated capillary by SCARAFT
The monomer concentration, initiator concentration, and the reaction time affect the coating process. Generally, increasing the concentration of the monomer and the initiator results in an increase of the coating thickness and decrease in the required reaction time. For optimization experiments, we kept the initiator concentration at 2.2 × 10⁻⁵ M and the reaction time at 21 h, and prepared the coated capillary with different monomer concentrations. The EOF decreased from 2.4 × 10⁻⁵ cm2·V−1 ·s−1 to 8.6 × 10⁻⁶ cm2·V−1·s−1 (N=2, RSD=0.9%) when the monomer concentration increased from 0.39 M to 0.56 M. 390 protein groups and 1,923 peptides were identified from 50 ng E. coli digest using a coated capillary prepared with 0.39 M monomer. In contrast, 525 protein groups and 2,742 peptides were identified from 50 ng E. coli digest using a coated capillary prepared with 0.56 M monomer. The identified protein groups and peptides are listed in the Supporting Information. Increasing the monomer concentration leads to increased free radical polymerization between the monomers, which can result in a clogged capillary. Therefore, the monomer concentration of 0.56 M was used in subsequent studies.
The effect of the initiator concentration on the coating was also studied. Capillaries were prepared with various initiator concentrations while keeping the monomer concentration (0.56 M) unchanged. When the initiator concentration was less than 2.2 × 10⁻⁵ M, over 21 hours were required to complete the coating process. Initiator concentrations much higher than 2.2 × 10⁻³ M led to the free radical polymerization reaction between the monomers in the solution, and the capillary was clogged after 21 h. Based on the experiment results, an initiator concentration of 5.4 × 10⁻⁴ M was used in the remainder of this work.
We also investigated the effect of the reaction time on the coating process. The capillaries were coated with 0.56 M acrylamide and 5.4 × 10⁻⁴ M initiator. The EOF was essentially unchanged when the polymerization time increased from 3 h (6.1 × 10⁻⁶ cm2·V−1 ·s−1, N = 2, RSD = 7%) to 7 h (4.7 × 10⁻⁶ cm2·V−1 ·s−1, N = 2, RSD = 13%). 738 protein groups and 4,086 peptides were identified from 50 ng E. coli digest using the coated capillary prepared with 3 h reaction. In contrast, 816 protein groups and 4,084 peptides were identified from 50 ng E. coli digest using the coated capillary prepared with 7 h reaction. Information on the identified protein groups and peptides is listed in Supporting Information.
The results obtained with SCARAFT coated capillaries for bottom-up proteomics of 50 ng E. coli digests with an Orbitrap Velos mass spectrometer are much better than our previous report using a commercial LPA coated capillary with 100 ng sample loading amount and the same mass spectrometer.26
Comparison with UPLC-ESI-MS/MS method
CZE-ESI-MS/MS with the SCARFT coated capillary was compared with UPLC-ESI-MS/MS using an LTQ Orbitrap Velos mass spectrometer with E. coli digests. The E. coli digests were loaded onto a reverse phase C18 analytical column followed by a 90 min gradient UPLC–ESI-MS/MS analysis, Figure S1 in the Supporting Information. Venn diagrams for peptides and protein groups identified by the UPLC and CZE methods are shown in Figure 2. 880 protein groups and 4,727 unique peptides were identified with 50 ng E. coli digests by using UPLC-ESI-MS/MS method. As mentioned above, 816 protein groups and 4084 peptides were identified from 50 ng E. coli digest by using CZE-ESI-MS/MS with the SCARFT coated capillary under similar experimental conditions. The identified protein groups and peptides information are listed in the Supporting information. 76% of the protein groups and 52% of the peptides identified in the UPLC method were also identified by the CZE method. However, 18% of the protein groups and 40% of peptides that were identified by the CZE method were not identified by UPLC method. The results demonstrate that CZE and UPLC provided complementary peptide level identifications.
Figure 2.

Venn diagrams for peptides (A) and protein group (B) identifications for the CZE and UPLC analysis of E. coli tryptic digests.
Reproducibility
The SCARAFT method was used to prepare three batches of LPA coated capillaries; two capillaries were prepared for each batch. The mean and standard deviation of the electroosmotic mobility of these capillaries were (2.8 ± 0.2) × 10−6 cm2·V−1 ·s−1 (N=3), which is nearly an order of magnitude lower than commercial LPA coated capillaries (2.5 × 10⁻⁵ cm2·V−1 ·s−1). The detector traces for µEOF determination are shown in Figure S2 in the Supporting information.
Reproducibility in proteomics analysis was evaluated by using two of these capillaries with a Q Exactive HF mass spectrometer for single-shot bottom-up proteomics. 990 protein groups and 5,514 peptides were identified from 50 ng E. coli digest with the first capillary and 964 protein groups and 5,703 peptides were identified with the second capillary. These numbers of identifications are significantly better than the results we reported using single-shot CZE analysis with a commercial LPA-coated capillary and an Orbitrap Fusion mass spectrometer (956 protein groups and 4,741 peptides) from ~250 ng E. coli digest.22 The identified protein groups and peptides are listed in the Supporting Information.
Long term stability testing
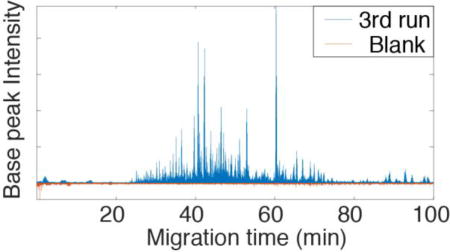
The Xenopus laevis tryptic digest was injected by pressure every 100 min for 201.7 h (8.4 days) of continuous separation to generate 121 consecutive separations of the Xenopus laevis digest. Representative base-peak electropherograms are shown in Figure S3 in Supporting information. Selected ion electropherograms were generated at six arbitrarily chosen m/z values (m/z = 542.3, 566.1, 577.6, 652.6, 703.6, and 722.2) with mean migration times ranging from 27 to 89 min. The selected ion electropherograms were fit with Gaussian functions using a nonlinear least-squares routine to estimate migration time and peak widths. The relative standard deviation for migration time ranged from 2.0 to 3.0%. This variation is likely dominated by temperature fluctuations in the room; the viscosity of water decreases by ~2.5% per °C increase in temperature, and electrophoretic and electroosmotic mobilities are inversely proportional to viscosity. The median theoretical plate counts ranged from 240,000 to 600,000 for selected ion electropherograms generated at the six m/z values.
To check sample carryover between separations, a blank analysis was carried out after the 121th separation of the Xenopus laevis digest by injecting 25 nL of 1 M HAc. The base peak electropherogram is shown in the Figure S3 in Supporting information. Negligible carryover was observed.
Analysis of HeLa digest
We used the SCARAFT coated capillary and a Q Exactive HF mass spectrometer for analysis of a HeLa digest. 2,158 protein groups and 10,005 peptides were identified with 25 ng of the HeLa digests. The identified protein groups and peptides are listed in the Supporting Information. A representative electropherogram is shown in Figure 3. These numbers of identifications are similar to a previous report from this group using an Orbitrap Fusion mass spectrometer, but the sample amount we now use is 16 times lower.21 The pI distribution of the identified peptides is shown in Figure 4.
Figure 3.

Representative electrophorogram of CZE-ESI-MS/MS analysis of the HeLa digest. Experimental conditions: Q Exactive HF mass spectrometer; 50 µm i.d. × 150 µm o.d. × 100 cm long LPA coated capillary; 25 ng HeLa digest; 1 M HAc separation buffer; 21.6 kV separation voltage; and 1.6 kV spray voltage.
Figure 4.

pI distribution of the identified peptides from HeLa digest. Experimental conditions are same as Figure 3.
The improved performance of the SCARAFT coated capillary was due to its very low EOF, which resulted in a doubling of the separation window compared to the use of a commercially coated LPA capillary. In addition, we believe that the SCARAFT-coated capillaries are more homogeneous and result in less sample loss, which facilitates analysis of small sample loadings. We present the cumulative migration time distribution of the HeLa peptides in Figure S4 in the Supporting information. Though the analysis time was 200 min, most of the peptides (>96%) migrated within 120 min. In addition, the migration time of the peptides versus pI is shown in Figure S5. Most of the peptides that migrated after 100 min have pI<6, which is expected because peptides with low pI carry low charge and migrate slowly.
Finally, we investigated phosphorylation of the HeLa peptides using phosphoRS 3.0 in Proteome Discoverer software version 1.4.27 153 phosphorylation sites (with phosphoRS site probabilities higher than 95%) and 163 phosphopeptides were identified. The modest numbers of phosphorylation sites and phosphopeptides were due to their low abundance, and the results could undoubtedly be improved after enrichment by using affinity chromatography.6, 28 The migration time distribution of the phosphopeptides is shown in Figure S6 in the Supporting information. As expected, more than 96% of the identified phosphopeptides migrated after 60 min due to their negatively charged phosphorylation sites. The pI distribution the phosphopeptides is shown in Figure S7, most of them (>80%) have a pI lower than 7.
Preparation of positively charged capillaries by SCARAFT method
A coated capillary with positively charge was prepared using the SCARAFT method. The anodic EOF was 5.6 × 10⁻⁴ cm2·V−1·s−1 (N=3, RSD=0.76%). The reversed direction and the strong EOF confirmed the successful coating process. A mixture of four proteins was separated on the cationic capillary, Figure 5(A).
Figure 5.

Separation of intact proteins by using a capillary with the direct positively charged coating (A), and block copolymer coating (B). Peak: (1) carbonic anhydrase, (2) myoglobin, (3) ribonuclease A, (4) lysozyme. Experimental conditions: 50 µm i.d. × 150 µm o.d. × 62 cm long; 1 M HAc background electrolyte; 1.6 kV spray voltage, −19.6 kV separation voltage.
The high EOF produced a short separation window. As a result, only 390 protein groups and 1604 peptides were identified from analysis of 50 ng E. coli digest. The identified protein groups and peptides are listed in Supporting Information.
Preparation of the block copolymer coating
To prove the living characteristic of the coating prepared by using SCARAFT method, a block polymer coating was prepared. After the first coating (LPA coating) process, the cathodic EOF was 2.42 × 10⁻⁶ cm2·V−1·s−1. However, the EOF was reversed to anodic EOF of 5.46 × 10⁻⁴ cm2·V−1·s−1 after the second coating (positively charged coating) process. The reversed direction of EOF confirmed the successful preparation of the block copolymer coatings and the living characteristic of the coating prepared by using SCARAFT method. The separation of the four proteins mixture is shown in Figure 5(B).
The RSDs of the migration times of myoglobin, ribonuclease A, and lysozyme are listed in Table 1. The reproducibility of the migration time produced by the block copolymer coated capillary is more than two-times better than produced by direct positive coating.
Table 1.
Migration times of intact proteins on two coated capillaries.
| Migration time on capillary with direct positively charged coating/ min |
Migration time on the capillary with block copolymer coating / min |
|||||||
|---|---|---|---|---|---|---|---|---|
| protein | 1st run | 2nd run | 3rd run | RSD/ % | 1st run | 2nd run | 3rd run | RSD/ % |
| Myoglobin | 12.9 | 13.7 | 13.2 | 2.9 | 11.1 | 10.9 | 10.8 | 1.2 |
| Ribonuclease A | 14.1 | 14.9 | 14.4 | 3.0 | 12.0 | 11.7 | 11.7 | 1.2 |
| Lysozyme | 17.1 | 18.3 | 17.6 | 3.5 | 14.2 | 13.9 | 13.8 | 1.5 |
355 protein groups and 1,483 peptides were identified from 50 ng E. coli digest by using the block polymer coating capillary, which are similar to the direct positively charged coating. The identified protein groups and peptides information are listed in the Supporting information.
Conclusions
A versatile method based on surface-confined aqueous reversible addition-fragmentation chain transfer (SCARAFT) polymerization reaction for coating capillary was developed. The polymerization reaction mainly takes place on the inner surface of the capillary instead of in solution, which avoid the possible clogging and greatly improve the homogeneity of the coating. The EOF of the coated capillary is roughly an order of magnitude lower than that of commercialize LPA coated capillary. The very low EOF results in a long separation window, which produces improved performance for bottom-up proteomics analysis. Various types of coatings could be prepared by simply replace the functional vinyl monomers in the polymerization mixture. By taking advantage of the living characteristic of the coating prepared by the SCARAFT polymerization reaction, capillary coatings based on block co-polymers are easy to prepare. These block co-polymers have great potential to improve the CZE separation performance and expand its range of applications.
Supplementary Material
Acknowledgments
We thank Dr. William Boggess in the Notre Dame Mass Spectrometry and Proteomics Facility for their help with this project. This work was funded by the National Institutes of Health (Grant R01GM096767). EHP acknowledges support from the National Science Foundation Graduate Research Fellowship program (2015–2018).
Footnotes
Conflict of interest
The authors declare no competing financial interest.
Further details on sample preparation, determination of EOF, representative UPLC chromatograph, CZE electropherograms, and the results of data analysis are available in the Supporting Information. This material is available free of charge via the Internet at http://pubs.acs.org.
References
- 1.Guo X, Fillmore TL, Gao Y, Tang K. Anal. Chem. 2016;88:4418–4425. doi: 10.1021/acs.analchem.5b04912. [DOI] [PMC free article] [PubMed] [Google Scholar]
- 2.Zhang Z, Sun L, Zhu G, Yan X, Dovichi NJ. Talanta. 2015;138:117–122. doi: 10.1016/j.talanta.2015.01.040. [DOI] [PMC free article] [PubMed] [Google Scholar]
- 3.Ramautar R, Heemskerk AAM, Hensbergen PJ, Deelder AM, Busnel JM, Mayboroda OA. J. Proteomics. 2012;75:3814–3828. doi: 10.1016/j.jprot.2012.04.050. [DOI] [PubMed] [Google Scholar]
- 4.Zhang Z, Sun L, Zhu G, Cox OF, Huber PW, Dovichi NJ. Anal. Chem. 2016;88:877–882. doi: 10.1021/acs.analchem.5b03496. [DOI] [PMC free article] [PubMed] [Google Scholar]
- 5.Wang Y, Fonslow BR, Wong CCL, Nakorchevsky A, Yates JR. Anal. Chem. 2012;84:8505–8513. doi: 10.1021/ac301091m. [DOI] [PMC free article] [PubMed] [Google Scholar]
- 6.Ludwig KR, Sun L, Zhu G, Dovichi NJ, Hummon AB. Anal. Chem. 2015;87:9532–9537. doi: 10.1021/acs.analchem.5b02457. [DOI] [PMC free article] [PubMed] [Google Scholar]
- 7.Hjerten S. J. Chromatogr. A. 1985;347:191–198. [Google Scholar]
- 8.Horvath J, Dolník V. Electrophoresis. 2001;22:644–655. doi: 10.1002/1522-2683(200102)22:4<644::AID-ELPS644>3.0.CO;2-3. [DOI] [PubMed] [Google Scholar]
- 9.Huang X, Doneski LJ, Wirth MJ. Anal. Chem. 1998;70:4023–4029. doi: 10.1021/ac980231c. [DOI] [PubMed] [Google Scholar]
- 10.Pan X, Malhotra N, Simakova A, Wang Z, Konkolewicz D, Matyjaszewski K. J. Am. Chem. Soc. 2015;137:15430–15433. doi: 10.1021/jacs.5b11599. [DOI] [PubMed] [Google Scholar]
- 11.Barbey R, Lavanant L, Paripovic D, Schüwer N, Sugnaux C, Tugulu S, Klok HA. Chem. Rev. 2009;109:5437–5527. doi: 10.1021/cr900045a. [DOI] [PubMed] [Google Scholar]
- 12.Leinweber FC, Stein J, Otto M. Fresenius J. Anal. Chem. 2001;370:781–788. doi: 10.1007/s002160000682. [DOI] [PubMed] [Google Scholar]
- 13.Boyer C, Bulmus V, Davis TP, Ladmiral V, Liu J, Perrier S. Chem. Rev. 2009;109:5402–5436. doi: 10.1021/cr9001403. [DOI] [PubMed] [Google Scholar]
- 14.Krishnamoorthy M, Hakobyan S, Ramstedt M, Gautrot JE. Chem. Rev. 2014;114:10976–11026. doi: 10.1021/cr500252u. [DOI] [PubMed] [Google Scholar]
- 15.Semsarilar M, Perrier S. Nat. Chem. 2010;2:811–820. doi: 10.1038/nchem.853. [DOI] [PubMed] [Google Scholar]
- 16.Yuan J, Huang X, Li P, Li L, Shen J. Polym. Chem. 2013;4:5074–5085. [Google Scholar]
- 17.Ali F, Cheong WJ. J. Sep. Sci. 2015;38:1763–1770. doi: 10.1002/jssc.201401356. [DOI] [PubMed] [Google Scholar]
- 18.Ali F, Cheong WJ. J. Sep. Sci. 2015;38:3645–3654. doi: 10.1002/jssc.201500765. [DOI] [PubMed] [Google Scholar]
- 19.Ali F, Cheong WJ. B. Korean Chem. Soc. 2016;37:1374–1377. [Google Scholar]
- 20.Zhang Z, Yan X, Sun L, Zhu G, Dovichi NJ. Anal. Chem. 2015;87:4572–4577. doi: 10.1021/acs.analchem.5b00789. [DOI] [PMC free article] [PubMed] [Google Scholar]
- 21.Rodriguez-Emmenegger C, Schmidt BVKJ, Sedlakova Z, Šubr V, Alles AB, Brynda E, Barner-Kowollik C. Macromol. Rapid Commun. 2011;32:958–965. doi: 10.1002/marc.201100176. [DOI] [PubMed] [Google Scholar]
- 22.Sun L, Hebert AS, Yan X, Zhao Y, Westphall MS, Rush MJP, Zhu G, Champion MM, Coon JJ, Dovichi NJ. Angew. Chem. Int. Ed. 2014;53:13931–13933. doi: 10.1002/anie.201409075. [DOI] [PMC free article] [PubMed] [Google Scholar]
- 23.Wojcik R, Dada OO, Sadilek M, Dovichi NJ. Rapid Commun. Mass Spectrom. 2010;24:2554–2560. doi: 10.1002/rcm.4672. [DOI] [PubMed] [Google Scholar]
- 24.Sun L, Zhu G, Zhang Z, Mou S, Dovichi NJ. J. Proteome Res. 2015;14:2312–2321. doi: 10.1021/acs.jproteome.5b00100. [DOI] [PMC free article] [PubMed] [Google Scholar]
- 25.Williams BA, Vigh G. Anal. Chem. 1996;68:1174–1180. doi: 10.1021/ac950968r. [DOI] [PubMed] [Google Scholar]
- 26.Zhu G, Sun L, Yan X, Dovichi NJ. Anal. Chem. 2013;85:2569–2573. doi: 10.1021/ac303750g. [DOI] [PMC free article] [PubMed] [Google Scholar]
- 27.Taus T, Köcher T, Pichler P, Paschke C, Schmidt A, Henrich C, Mechtler K. J. Proteome Res. 2011;10:5354–5362. doi: 10.1021/pr200611n. [DOI] [PubMed] [Google Scholar]
- 28.Zhou H, Ye M, Dong J, Corradini E, Cristobal A, Heck AJ, Zou H, Mohammed S. Nat. Protoc. 2013;8:461–480. doi: 10.1038/nprot.2013.010. [DOI] [PubMed] [Google Scholar]
Associated Data
This section collects any data citations, data availability statements, or supplementary materials included in this article.