

Abstract
Bacteriophages play key roles in microbial evolution1,2, marine nutrient cycling3, and human disease4. Phages are genetically diverse and their genome architectures are characteristically mosaic, driven by horizontal gene transfer (HGT) with other phages and host genomes5. As a consequence, phage evolution is complex and their genomes are composed of genes with distinct and varied evolutionary histories6,7. However, there are conflicting perspectives on the roles of mosaicism, and the extent to which it generates a spectrum of genome diversity8 or genetically discrete populations9,10. Here, we show that bacteriophages evolve within two general evolutionary modes that differ in the extent of HGT by an order of magnitude. Temperate phages distribute into high and low gene flux modes, whereas lytic phages share only the lower gene flux mode. The evolutionary modes are also a function of the bacterial host, and different proportions of temperate and lytic phages are distributed in either mode depending on the host phylum. Groups of genetically-related phages fall into either the high or low gene flux modes, suggesting there are genetic as well as ecological drivers of HGT rates. Consequently, genome mosaicism varies depending on the host, lifestyle, and genetic constitution of phages.
The vast majority (>95%) of sequenced bacteriophage genomes are from double-stranded DNA (dsDNA) tailed phages, and 2,191 dsDNA genomes in public databases were examined for evolutionary patterns driven by HGT. These phages infect over 130 host genera, predominantly in the phyla Actinobacteria, Bacteroidetes, Cyanobacteria, Firmicutes, and Proteobacteria (Supplementary Data 1) and inhabit a wide variety of environments. However, the representation of phages of different hosts is highly heterogeneous; 877 (40%) phages of Proteobacteria infect 76 genera and 828 (38%) phages of Actinobacteria infect 15 genera, but the other 22% are broadly distributed across the other 42 host genera. Approximately 35% of the total have been isolated, sequenced, and annotated with manual inspection in the Science Education Alliance Phage Hunters Advancing Genomics and Evolutionary Science (SEA-PHAGES) program8,11, all of which infect Actinobacterial hosts.
We determined gene content variation relative to nucleotide distances by pairwise comparison of all dsDNA phages using two kmer-based metrics that facilitate the 2.7 × 10⁶ comparisons that are computationally challenging using alignment-based approaches (Fig. 1a, Supplementary Data 2). First, whole genome nucleotide sequence similarities were calculated using Mash12 using parameters that mirror homology-based Average Nucleotide Identity (ANI) measures (Supplementary Fig. 1a). Specifically, very large sketch sizes were chosen as these increase the accuracy of Mash distances when comparing distantly related genomes12. Second, gene content differences were determined by first grouping genes into phamilies13 according to amino acid sequence relationships using kclust, implemented in Phamerator8,14 with parameters that mirror BLAST-based measures8, then by calculating the proportions of pairwise shared phamilies.
Figure 1. Two evolutionary modes correlate with phage lifestyle.
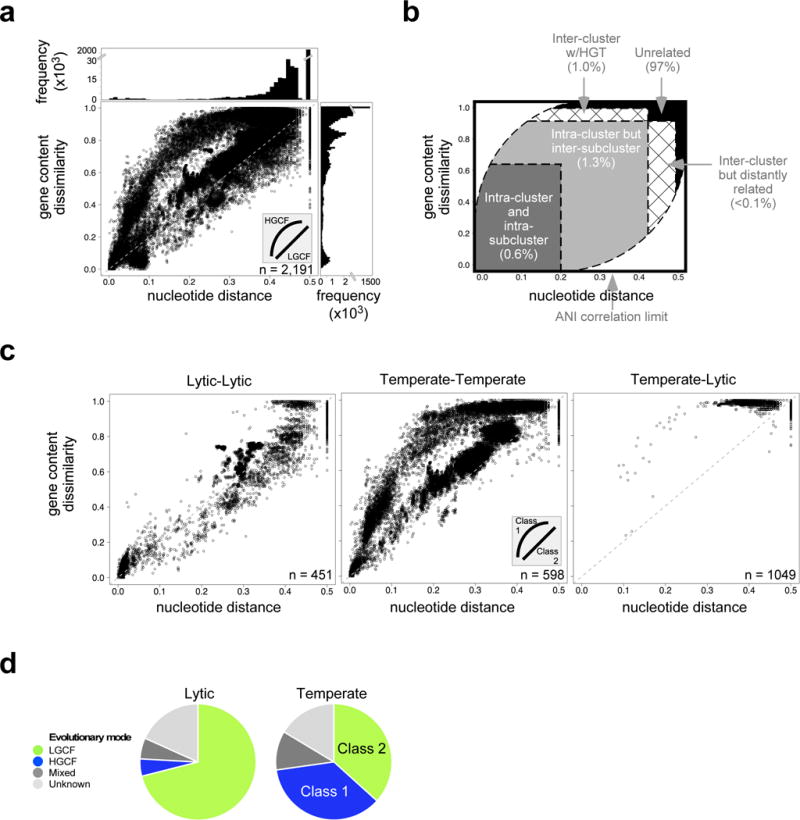
a, Nucleotide distance (using Mash) and gene content dissimilarity (using phams from Phamerator) are plotted for ~2.4 × 10⁶ dsDNA phage comparisons to reveal two evolutionary modes (inset). The line at y = 2x is plotted for reference. Marginal frequency histograms emphasize densely-plotted regions, with truncated y axes for viewability. b, Defined genomic similarity plot sectors (dotted lines) highlight various genomic relationships (see Methods), including the percentage of dsDNA phage comparisons in panel a that are positioned in each sector. c, Comparisons involving two lytic (left), two temperate (middle), or one lytic and temperate phage are plotted (right) as in panel a. d, Pie charts reflecting the proportion of predicted lytic and temperate phages in the dataset that exhibit the HGCF or LGCF mode. Two classes of temperate phages are apparent: those with HGCF (class 1) and those with LGCF (class 2). n = number of phages used for the analysis (distinct from the number of comparisons plotted).
Because the genetic diversity of phages is high, most pairwise comparisons (97%) have values outside of the informative ranges of comparison (Fig. 1a; see below); i.e. they have no DNA similarity and share few if any genes at the amino acid sequence level. However, comparisons between genomes with measurable similarities reveal two distinct patterns, one in which gene content dissimilarity is roughly proportional to Mash distance, and a second in which gene content dissimilarity increases more quickly as Mash distance grows. We propose that the hyperbolic-like disproportionate increase in gene content variation reflects a faster rate of gene acquisition and loss through HGT, and we will refer to these as the low (LGCF) and high (HGCF) gene content flux evolutionary modes (Fig. 1a). Because Mash is an alignment-free calculation of similarity, it does not strictly correlate with evolutionary divergence, and non-alignment characteristics such as base composition can influence Mash values. Likewise, grouping of genes into phamilies with alignment-free methods may imperfectly reflect sequence relationships. To address these, we showed that similar analyses using alignment-based ANI on a subset of phage genomes, using alternative methods for gene family construction15 and indexing gene content, all produce similar patterns to those shown in Figure 1a (Supplementary Fig. 2); a representative alignment-based phylogeny also supports the pham designations (Supplementary Fig. 3). Thus, although alignment-free comparisons should be used with caution when comparing such diverse genomes, the close agreement with subsets of the data using alignment-based methods (Supplementary Figs. 2 and 3) adds confidence to the interpretation that these distinct evolutionary patterns are not artifacts of kmer-based approaches. We note that phages with ssDNA, ssRNA, or dsRNA genomes show different distributions to dsDNA phages, although sample sizes are small (Supplementary Fig. 4).
Two approaches were used to relate the genomic similarity plot to previous genome comparisons (Fig. 1). First, the values for evidently dissimilar genomes were determined by comparing phages with non-phage viruses, phages with different nucleic acid types, and phages of different host phyla (Supplementary Fig. 5a–c). Second, we correlated the genomic similarity plot with prior groupings of actinobacteriophages established with several metrics8,16 (Supplementary Fig. 5d–f). These groupings include ‘clusters’ of phages sharing nucleotide sequence similarity spanning at least 50% of the genome lengths, and ‘subclusters’ sharing relatively high levels of ANI; phages with no close relatives are ‘singletons’8,16. Comparing phages that share (or don’t share) the characteristics in these two approaches defines sectors in the plot for further analysis (Fig. 1b). Fewer than 2% of the 2.4 × 10⁶ dsDNA phage comparisons lie within the intra-cluster sectors, reflecting the overall high level of diversity (Fig. 1b).
Lytic and temperate phages differentially influence their microbial environments17 and are proposed to differ in their evolution18–21. Intra-lytic and intra-temperate phage comparisons distribute into the HGCF and LGCF modes, respectively, regardless of whether empirically-determined (Fig. 1c) or predicted (Supplementary Fig. 6) lifestyle data are used. Lytic phage comparisons predominantly lie within the LGCF modes (94%; Fig. 1d), whereas temperate phage comparisons segregate into both the HGCF (43%) and LGCF (57%) profiles; we will refer to these as class 1 and class 2 temperate phages, respectively (Fig. 1c,d). As expected, there are few examples of similarities between lytic and temperate phages, although those observed are in the HGCF mode (Fig. 1c). Additionally, while both classes of temperate phages are present among Siphoviridae and Myoviridae, most temperate Podoviridae phages are class 1 (Supplementary Fig. 7a).
Genetically-related lineages of phages have distinctive HGCF and LGCF profiles (Fig. 2). For example, temperate Mycobacterium Cluster F phages evolve exclusively in the HGCF mode, whereas temperate Mycobacterium Cluster K and lytic Propionibacterium Cluster BU phages exclusively evolve in the LGCF mode, although with distinctive profiles (Fig. 2a). These patterns are observed even when alignment-based ANI is used to determine nucleotide distances (Supplementary Fig. 2d). The correlation between genome type and evolutionary mode extends to all of the clusters for which there are sufficient genomes to evaluate, regardless of whether they are classified as predominantly temperate or lytic (Fig. 2b). Approximately 60% of the designated actinobacteriophage clusters have sufficient members to assign to HGCF or LGCF modes (Fig. 2c).
Figure 2. Phage clusters exhibit unique evolutionary trajectories.

a, Cluster-specific intra-cluster (orange) and inter-cluster (black) comparisons are plotted as in Figure 1a for representative actinobacteriophage clusters and grouped by their predicted or known lifestyle, with cluster and host genus indicated. n = number of phages present in the specific cluster. b, Stacked bargraphs for 44 actinobacteriophage clusters in which the evolutionary mode of their constituent phages could be determined, along with their predicted lifestyle. For each cluster, the percentage of the constituent phages that are predicted to be temperate or lytic, along with the percentage of the constituent phages that are predicted to be in each evolutionary mode, are indicated. c, Pie chart reflecting the proportion of all actinobacteriophage clusters in each mode (same color scheme as in panel b). d, BLAST-based whole genome alignments of two individual phage comparisons highlight class 1 (Cluster F phages Bobi and Cerasum) and class 2 (Cluster A phages Bactobuster and RhynO) temperate phages. Both comparisons have approximately equal gene content dissimilarities (0.51 and 0.50, respectively) but markedly unequal whole genome nucleotide distances (0.07 and 0.25, respectively). Spectrum color shading reflects BLASTN e-value significance of aligned regions, ranging from unrelated (white) to closely related (violet).
The HGCF and LGCF profiles could differ because of differential rates of gene acquisition and loss5, or because the genes that are not shared (i.e. that are either not homologous, or are too distantly related to be grouped into the same phamily) have different characteristics (such as base composition) and thus contribute differently to the Mash nucleotide distance measures. Several lines of evidence support the former interpretation (Supplementary Fig. 8). First, HGCF comparisons exhibit greater variation in genome size than LGCF and lytic comparisons (Supplementary Fig. 8a), consistent with higher levels of HGT. Second, the Mash distances of the portions of the genomes corresponding to the unshared genes is similar for lytic and both classes of temperate phages (Supplementary Fig. 8b,c), such that these are not driving the different evolutionary modes. As a consequence, if two pairs of genomes are compared in which 50% of the genes in each pair are homologues, the nucleotide sequences of the shared genes are much more closely related in the HGCF than in the LGCF comparisons (Fig. 2d). We also note that the gene content differences correlate with the proportions of the total coding sequences derived from the unshared genes similarly for the different modes (Supplementary Fig. 8d), ruling out distortions resulting from exchange of large numbers of disproportionately small genes. However, for all phage groups, unshared (non-homologous) genes are generally smaller than shared (homologous) genes, reflecting prior observations (Supplementary Fig. 8e)16. Taken together, these observations support the hypothesis that the HGCF and LGCF profiles are driven by different rates of HGT, rather than acquisition of different types of genes from distinct sources.
Differential rates of HGT can be directly tested with Cluster A actinobacteriophages since they atypically distribute into both LGCF and HGCF modes (Fig. 3a). There are nearly 200 phages in this cluster, they are all temperate or recent derivatives of temperate phages, and they share common genomic architectures8. However, they are quite diverse and are subdivided into 17 subclusters8. Subcluster A1 phages – representing 25% of all Cluster A phages – follow the HGCF mode (spanning a narrow range of low Mash distance), whereas all other Cluster A phage comparisons follow the LGCF mode (Fig. 3a). Subcluster A1 phages are somewhat distantly related to other Cluster A phages (Fig. 3a), but they share general properties such as genome size, GC% content, immunity regulation, head packaging strategy, and tail type8.
Figure 3. Evolutionary modes correlate with different rates of HGT.
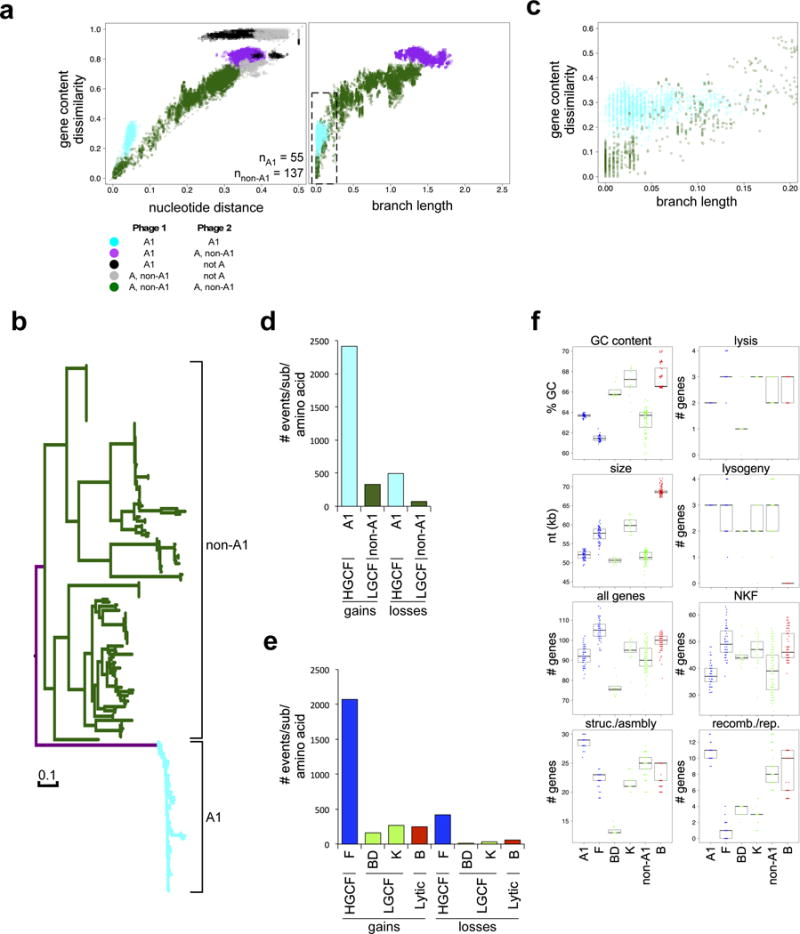
a Mycobacteriophage Cluster A-specific comparisons are plotted (left) similar to Fig. 2, but subcluster relationships are highlighted. Cluster A comparisons involving two Subcluster A1 phages (cyan), two non-Subcluster A1 phages (dark green), one Subcluster A1 and one non-Subcluster A1 phage (purple), one Subcluster A1 and one non-Cluster A phage (black), and one non-Subcluster A1 and one non-Cluster A phage (grey) are plotted. Subcluster A1 phages exhibit HGCF compared to other Cluster A phages. n = number of Cluster A phages in Subcluster A1 (nA1) and Subclusters A2-A17 (nnon-A1). The same Cluster A gene content dissimilarities were plotted (right) against pairwise branch lengths from the phylogenetic tree in panel b. Box indicates the area of the plot enlarged in panel c. b, Phylogenetic tree of all Cluster A phages based on structural/assembly genes. All branches are colored as in panel a, highlighting that all A1 phages form a monophyletic clade. c, Enlarged area of plot in panel a (right) to highlight different patterns of gene content changes. d, Bar graph of the predicted number of pham gains and losses per substitution per amino acid site for A1 and non-A1 phages. e, Bar graph of the predicted number of pham gains and losses as in panel d for additional representative clusters (colored as in Supplementary Fig. 8a). f, Comparison of phages in specific representative clusters in the phylogenetic analysis, using several genome metrics such as GC content, genome size (size), and the number of all genes or genes in functional categories per genome (struc./asmbly = structural and assembly; recomb./rep. = recombination and replication; NKF = no known function). Each data point is a phage genome, and boxplots depict the middle 50% of the data surrounding the median (black bar).
Phylogenetic analysis of all Cluster A phages based on highly conserved structural/assembly genes shows that Subcluster A1 phages form a monophyletic clade with markedly shorter branch lengths than phages of other subclusters (Fig. 3b). Distinct genomic similarity distributions are still observed when these branch lengths – corrected for evolutionary distance – are used instead of Mash-based whole genome nucleotide distance (Fig. 3a, c), adding further confidence in the Mash-based analyses (Fig. 1). Phylogenetic analyses (branch length determinations) of other representative actinobacteriophage clusters from each mode reveal similar trends, and they show that HGCF comparisons differ from LGCF and lytic comparisons in several general gene content metrics (Supplementary Fig. 9).
The homology-based phylogeny provides a framework for calculating the rates at which the non-homologous genes are being acquired or lost, and we observe that Subcluster A1 phages exhibit nearly 10 times more pham gains and losses than Cluster A phages in other subclusters (Fig. 3d). The same pattern is observed for other groups of phages (Fig. 3e), and the predicted HGT events correlate with homology-based evolutionary distances (Supplementary Figs. 3b, 10a, b). Specifically, the HGCF temperate phages in Cluster F show much greater rates of gene acquisition and loss that the LGCF phages of Clusters BD or K, or the lytic phages in Cluster B (Fig. 3e). Thus, at least for these subsets of the phages, there is a strong correlation between the rates of gene acquisition and loss derived from homology-based phylogenetic reconstruction, and the modes that exhibit when comparing GCD and Mash distances with alignment-free methods (Fig. 1). There are no obvious genetic characteristics that distinguish phages of specific modes (Fig. 3f), and the different HGT rates between HGCF and LGCF modes are not correlated with specific types of genes (Supplementary Fig. 10c, d).
Phages infecting hosts within different phyla show different distributions among HGCF and LGCF modes (Fig. 4). The numbers of phages infecting Firmicutes (Fig. 4d) and Proteobacteria (Fig. 4e) are sufficient to provide robust profiles, similar to the actinobacteriophages (Fig. 4a), although with different distributions. Over 80% of temperate phages infecting Firmicutes, but less than 50% of temperate phages infecting Proteobacteria, are class 1. Bacteroidetes and Cyanobacteria phages contribute almost exclusively to HGCF and LGCF profiles, respectively (Fig. 4b, c), and the cyanobacteria phages are of particular note as these reflect aqueous environments explored using metagenomics and viral tagging9,22. The Cyanobacterial phage comparisons closely map to the LGCF mode, there is a dearth of comparisons in the ‘inter-cluster’ sectors, and none of the temperate phages are class 1 (Fig. 1b, 4c). This is consistent with reports of genetically-distinct phage populations and constrained genomic mosaicism of Synechococcus phages9. In contrast, Actinobacterial and Proteobacterial phages show both LGCF and HGCF profiles, have many class 1 temperate phages, and have substantial inter-cluster relatedness (Fig. 4a, e). These are consistent with extensive genomic mosaicism and a continuum of genetic diversity5,8,23. Thus, the bifurcation of evolutionary modes by host, environment, lifestyle, and genome accounts for different views on phage genome mosaicism and evolution8,9.
Figure 4. Host phyla exhibit diversity in phage evolutionary modes.

a-e, Genomic similarities in Figure 1a were divided based on the five most predominant host phyla. Each host phylum displays unique phage genomic similarity profiles, indicating that patterns of phage evolution vary based on host. Pie charts reflect the proportion of phages of each host phylum that are predicted to be in each mode for each predicted lifestyle, as in Fig. 1d (L = lytic, T = temperate). n = number of phages present in the host phylum that were used for the analysis.
While the biological mechanisms that cause a ten-fold change in HGT and two distinct evolutionary modes are unclear, the two modes have important biological implications. Bacterial genomes, when similarly analyzed for classification, do not show bifurcating genomic similarity patterns24–26, although they do exhibit varying rates of HGT27. Many well-studied temperate phages that contribute to host physiology, virulence, and viral defense evolve in the HGCF mode, including the Cluster N mycobacteriophages28, lambda and its relatives29, and others2,4 (Supplementary Fig 11). Selection for such traits may fuel the HGCF mode, suggesting the possibility that many of the unshared genes – most of which have unknown function – contribute to host adaptations. Alternatively, the increased HGT rates may be the result of specific genes such as recombinases, but these have yet to be identified. Class 1 temperate phages engage in more exchange with lytic phages than class 2 temperate phages do, although these are relatively rare because of overall dissimilarity of the genomes (Fig. 1c), as well as the rare exchanges between phages with different tail morphotypes (Supplementary Fig. 7b). Other factors such as variations in host range evolution, differential access to the common gene pool in different environments, constraints on the diversity of genomes available for recombination, and the roles of temperate phages at different microbial densities, are also expected to contribute to these modes of phage genome evolution17,30,31.
Methods
Phages used in this study
A total of 2,333 microbial viruses were used for this study. All 1,941 viruses in the NCBI RefSeq database (https://www.ncbi.nlm.nih.gov/refseq/) listed as ‘microbial viruses’ were downloaded on 8/11/2016 and combined with phages in a local Phamerator14 database Actinobacteriophage_785, thus comprising 2,191 double-stranded DNA bacteriophages, 84 bacteriophages with alternative nucleic acid genomes (ssDNA, dsRNA, ssRNA), 23 bacteriophages with unspecified nucleic acid type, 3 archaeal viruses, 1 eukaryotic virus, and 31 viruses of unspecified origin (see Supplementary Data 1 for a complete list of viruses). All 2,333 viral genomes were used to create the Bacteriophages_2333 Phamerator database (http://phamerator.webfactional.com/databases_Hatfull). CDS features from the Actinobacteriophage_785 database (for those actinobacteriophages) or from the RefSeq records (for all other genomes) were retrieved and used. Phamerator implements the kclust algorithm, and all CDS translations were grouped into 62,363 unique phamilies (phams)14.
Collection of virus metadata
Several types of metadata were used for analysis: phage clusters, host taxonomy, viral taxonomy, and phage lifestyle (Supplementary Data 1). For all metadata fields in Supplementary Data 1, missing/incomplete data were listed as “Unspecified” and were excluded from each specific type of analysis.
Host genera of the 785 actinobacteriophages were derived from phagesdb (http://phagesdb.org). For the other 1,548 genomes, the Biopython32 package was used to retrieve host genus from each RefSeq record. Host data is stored in multiple fields in RefSeq records, and manual assessment of host data parsed from these fields was required to identify the best choice of host genus. For all 2,333 genomes, the ete3 python package33 was used within the conda environment (https://www.continuum.io) to retrieve the complete host taxonomy.
For viral taxonomy, taxonomic data of the 785 actinobacteriophages were derived from phagesdb (http://phagesdb.org), and for all other phages from each RefSeq record using Biopython. Cluster data was obtained from phagesdb.
Empirical phage lifestyle data for 1,067 phages was obtained from multiple sources. For the 785 actinobacteriophages in phagesdb, lifestyle for all phages within a specific cluster was assigned if there was empirical data or strong, reasonable genomic evidence indicating they are temperate or lytic (pers. communication with W. Pope). For phages of other host phyla, lifestyle data was compiled from two online resources, PHACTS34 and ACLAME35, as well as previously compiled data for subsets of these phages19,23,36–38 and as well as other various literature. Lifestyle data was thus curated for over 40% of the phages in this database, resulting in 452 lytic and 614 temperate phages, and predominantly from the host phyla Actinobacteria (562 phages), Firmicutes (131 phages), and Proteobacteria (362 phages).
Categorization of phams into general gene functions
Phams present within 785 actinobacteriophages, which have been predominantly manually and systematically curated through the SEA-PHAGES program, were manually grouped into mutually exclusive, but non-exhaustive, functional categories based on the pham descriptions present in the database. Common gene functions associated with each category are as follows: lysis (endolysin, holin, LysA, LysB, LysM, lysin); lysogeny (immunity repressor, integrase, parA, parB, excise); recombination/replication (DnaB, DnaC, DnaJ, Ftsk, helicase, ku, DNA polymerase, primase, RDF, RecA, RecB, RecE, RecT, RusA, RuvC, resolvase); structural/assembly (capsid, capsid maturation protease, capsid morphogenesis, head assembly, head-to-tail connector, head decoration, major capsid, major tail subunit, minor tail subunit, portal, teminase, structural, tail assembly chaperone, tail fiber, tape measure, scaffolding, tail, tail sheath, tail spike, baseplate); misc. (any phams with gene functions that do not clearly fit into any of the above categories; no known function (no pham description data available).
Prediction of phage lifestyle
The lifestyles of all phages in the dataset were predicted in order to complement the empirical lifestyle dataset. Phamerator identifies conserved domains in all genes using the NCBI conserved domain database39. All conserved domains in the dataset that contain descriptions relating to “integrase” (for integrating temperate phages) or “parA” (partitioning gene found in extrachromosomal temperate phages40), or those that are associated with phams that contain manual descriptions relating to “integrase” or “parA”, were manually identified, resulting in 206 “temperate phage” domains. All phams in the dataset containing at least one temperate phage domain were identified, resulting in 149 “temperate phage” phams. All phages in the dataset containing at least one temperate phage pham were identified, resulting in 962 predicted temperate and 1371 predicted lytic phages. The predicted lifestyle data conflicts with the empirical lifestyle data in 4% of the empirical dataset. Not surprisingly, some of these are readily identifiable as recent lytic mutant derivatives of temperate parents, such as the Cluster K phage, TM441. Additionally, temperate mu-like phages integrate into the host genome using transposases instead of integrases, so they were not identified using this strategy, accounting for several other phages on this list. We also note that some recombinase genes may contain similar conserved domains as found in integrases; true lytic phages containing these recombinases would be erroneously categorized as temperate. Conversely, true temperate phages that contain novel integration machinery would be missed by this strategy and would be erroneously categorized as lytic.
Calculation of gene content dissimilarity
Custom python scripts were developed to compute a gene content dissimilarity index. For each pairwise comparison of genomes, the number of shared phams between the two genomes was computed, and this was divided by the total number of phams present in each genome. The two proportions were averaged and converted to a gene content dissimilarity: 1 – average shared pham proportion, ranging from 0 (all phams are shared) to 1 (no phams are shared) (Supplementary Data 2). The Jaccard index was also computed, where the number of shared phams was divided by the total number of phams present in both genomes. Gene function-specific gene content dissimilarity was computed for each pairwise comparison in the same manner, except that only the subset of phams grouped into each specific category were used.
Calculation of whole genome nucleotide distance
Mash software v1.1 was used to compute nucleotide distance between all genomes using custom bash and python scripts. Mash implements kmer-based scoring using two user-defined parameters (kmer size and sketch size) to enable rapid genomic comparisons12. It was originally described as a tool that, with optimized parameters, can quickly group related sequences at the species level (nucleotide distance < 0.05). The Mash distance highly correlates with average nucleotide identity (ANI), a common metric for genome sequence similarity that is robust but computationally prohibitive for large datasets12. In general, larger sketch sizes and smaller kmer sizes provide more accurate estimates between genomes of greater distance. We extended Mash’s utility to examine patterns of phage genome evolution across larger distances and optimized the parameters accordingly.
A subset of 79 phage genomes from multiple actinobacteriophage clusters and host phyla were chosen (Supplementary Data 1). Pairwise ANI of all genomes was computed using default settings in DNA Master (http://cobamide2.bio.pitt.edu), an alignment-based approach similar to that described by Konstantinidis and Tiedje42. For the largest genome in the database, phage G, at a size of ~500,000 bp, Mash recommends kmer sizes of 13 or larger, so we tested kmer sizes ranging from 13 to 17, and sketch values of 200, 1000, 5000, and 25,000 (Supplementary Fig. 1a). Correlations of ANI-based distance (1 – ANI) and Mash-based distance were analyzed in RStudio (https://www.rstudio.com) to determine the optimal parameters. We determined that in using kmer = 15 and sketch = 25,000, Mash and ANI distances correlate up to a Mash distance of ~0.33 (ANI distance of ~0.4). We retained all distances with a p-value < 1×10¹⁰. Additionally, since genome sizes ranged from 2.5 kb to nearly 500 kb, we added a parameter to minimize distortions caused by large genome size disparities (Supplementary Fig. 1b). We limited our analysis to genomes that had a maximum genome size disparity of 100%, meaning that for any pairwise comparison, one genome was no more than twice the size of the other genome (however, we note that <2% of all comparisons are impacted by this parameter, and <0.06% of these comparisons are positioned within intra-cluster boundaries, so omitting this parameter would not impact results). After optimization, the following parameters were used for further genome comparisons: kmer = 15, sketch = 25,000, p-value < 1E-10, and genome size disparity of 100%.
Using these optimized parameters, nucleotide distances for all ~2.7 million pairwise comparisons in the dataset were computed (Supplementary Data 2). In order to retain all data points to generate scatterplots and histograms, all comparisons that did not exhibit relationships based on the optimized parameters were set to a distance of 0.5, larger than any other value that passed the filters. Thus, nucleotide distances for this dataset range from near 0 (complete identity) to 0.5 (completely unrelated). Of the ~2.4 million pairwise comparisons between dsDNA viruses tested, less than 9% passed the filter, reflecting the large genetic diversity in the dataset. We note that even though we optimized the Mash parameters, the same general patterns are observed in the data when either less stringent parameters (sketch size = 5000, kmer size = 13) or more stringent parameters (sketch size = 50,000, kmer size = 17) are used, indicating that the observed patterns are robust to a range of Mash parameters.
Plotting genomic similarity and defining sectors
Genomic similarities were plotted with RStudio (version 0.99.903, implementing R version 3.3.0). Each point represents a single pairwise comparison, and its position in the scatterplot reflects the genomic relationship between the two phages. To compare patterns in genomic similarities, only the 2,191 dsDNA bacteriophage data was plotted. However, we used the other 142 viruses to inform our interpretation of the metrics used. First, viruses of different host domains and nucleic acid genomes are expected to be unrelated6,10,20. In our analysis, there were no significant nucleotide distances computed between any bacteriophages and the eukaryotic virus, Tetraselmis viridis virus S1. Additionally, all genomic similarities between bacteriophages and the three archaeal viruses, or between bacteriophages of different nucleic acid types, exceeded nucleotide distances of 0.38 and had gene content dissimilarities of 1, and over 99% of comparisons between dsDNA phages of different host phyla exhibit either nucleotide distances of 0.5 or gene content dissimilarities of 1 (Supplementary Fig. 5a–c).
Next, we compared and contrasted phage genomic diversity within and between manually curated actinobacteriophage clusters, subclusters, clustered phages that have not yet been subclustered, and singletons (Supplementary Fig. 5d–f). Almost 100% of comparisons involving phages within the same cluster (intra-cluster) exhibit nucleotide distances below 0.42 and gene content dissimilarities below 0.89. Similarly, almost 100% of comparisons involving phages within the same subcluster (intra-subcluster) exhibit nucleotide distances below 0.2 and gene content dissimilarities below 0.62.
Using these cluster-specific and subcluster-specific values, we defined sectors on the genomic similarity plot to highlight approximate boundaries between different types of relationships (Fig. 1b): ‘Intra-cluster and intra-subcluster’ (dark grey), phages with enough similarity to be grouped into the same subcluster; ‘Intra-cluster but inter-subcluster’ (light grey), phages with enough similarity to be grouped into the same cluster; ‘Inter-cluster but distantly related’ (grid pattern), phages that lack enough similarity to be grouped into the same cluster, but low gene content dissimilarity may suggest they are distant relatives; ‘Inter-cluster w/HGT’ (grid pattern), phages that lack enough similarity to be grouped into the same cluster, but exhibit low nucleotide distance, suggesting that they have experienced substantial, recent, horizontal gene transfer that skews the whole genome nucleotide distance; ‘Unrelated’ (black), phages that lack enough similarity to be grouped into the same cluster, did not pass the p-value threshold, or that contain large genome size disparities; White sectors, approximate regions of the profile that contain no data and are inaccessible due to the intrinsic relationship between the two metrics.
Using these sectors, almost 100% of comparisons involving dsDNA phages of different host phyla are positioned in the unrelated sector. Less than 1% of inter-cluster comparisons and about 1% of comparisons involving at least one singleton are positioned within the intra-cluster sector. Fewer than 3.5% of inter-subcluster comparisons between phages of the same cluster and nearly 99% of comparisons involving phages of the same cluster but have not yet been subclustered are positioned within the intra-subcluster sector.
Categorizing comparisons into evolutionary modes
For data subsets used in Supplementary Figs. 8 and 9, each pairwise comparison was classified in the HGCF evolutionary mode if a) the mash distance was less than 0.16 and gene content dissimilarity was above the line y = 3.5x, or b) the mash distance was greater than 0.16 and gene content dissimilarity was above the line y = 2x + 0.25. Otherwise, the pairwise comparison was classified in the LGCF evolutionary mode.
Prediction of evolutionary mode per phage and cluster
Individual phages were classified into evolutionary modes as follows (Supplementary Fig. 6c). In addition to the parameters used for classifying individual comparisons described above, only comparisons that are distributed within intra-cluster boundaries (nucleotide distance < 0.42, gene content dissimilarity < 0.89) and within the intermediate range of similarity (where they are not positioned within the regions where the two modes converge, reflected by nucleotide distance < 0.06 and gene content dissimilarity < 0.22 or nucleotide distance > 0.28 and gene content dissimilarity > 0.79, as observed in Fig. 1a) were used. With each comparison classified, the proportion of comparisons in the HGCF mode were computed. Phages were classified as a) “HGCF” if > 80% of comparisons are distributed in the HGCF mode, b) “LGCF if < 20% of comparisons are distributed in the HGCF mode, c) “Mixed” if 20–80% of comparisons are distributed in the HGCF mode, d) “Unknown” if no comparisons were distributed in either of the two mode regions (Supplementary Fig. 6d). Nearly 60% of phages exhibit 100% of comparisons in one mode or the other. While the thresholds and parameters are intended to predict the evolutionary mode in an unbiased, conservative manner, there are nevertheless phages that exhibit a “Mixed” distribution. This designation is likely an artifact for many of these phages based on the conservative thresholds used. For instance, while 15 of the Subcluster A1 phages are assigned “HGCF”, 40 are assigned “Mixed”, not because they are broadly distributed across the LGCF sector, but simply due to their distant pairwise relationships with other Cluster A phages that are positioned within close proximity to the conservative boundaries (Fig. 3a). Classification of individual actinobacteriophage clusters were based on the classification of their constituent phages. Clusters were classified as a) “HGCF” if they contain phages classified as HGCF and contain no phages classified as LGCF or Mixed, b) “LGCF” if they contain phages classified as LGCF and contain no phages classified as HGCF or Mixed, c) “Mixed” if more than one phage was classified as Mixed, and d) “Unknown” if all phages were classified as Unknown.
Calculation of genome size disparities
The genome size disparity was computed for each comparison by determining the absolute nucleotide difference between the two phage genomes, determining the proportion of the size difference relative to each individual genome, and averaging the two proportions. Sliding window averages were then computed by sorting all data points by whole genome nucleotide distance and using the runmean function in the caTools (version 1.17.1, https://CRAN.R-project.org/package=caTools) R package to compute average genome size disparities within sliding windows of 101 data points.
Calculation of shared and unshared gene subset data
Shared and unshared nucleotide distances were computed as follows. Gene nucleotide sequences were extracted from genomes and analyzed using custom python scripts. For each comparison, gene phams were categorized as “shared” or “unshared” depending on whether they were present in both genomes or only one genome. Gene sequences for both genomes were categorized as “shared” or “unshared” depending on their associated pham’s assigned category. For each genome, gene sequences in each category were concatenated into a single nucleotide sequence. Each pairwise comparison thus resulted in four concatenated nucleotide sequences. Mash was used with the whole genome optimized parameters to compute nucleotide distances between the shared gene sequences, or between the unshared gene sequences, within each pairwise phage comparison. All shared and unshared nucleotide distances with a p-value < 1 × 10⁻¹⁰ were less than 0.6; therefore, all insignificant data points were set to 0.6 so that all data is retained for each plot.
Each comparison thus resulted in a shared gene nucleotide distance and unshared gene nucleotide distance, in addition to the previously computed whole genome nucleotide distance (Supplementary Data 2). Sliding window averages for shared and unshared gene distances were computed similar to the genome size disparities, in which all data points were first sorted by whole genome gene content dissimilarity (Supplementary Fig. 8c). The proportion of total coding sequence derived from unshared genes in each genome was computed by dividing the length of the concatenated unshared gene sequences by the combined length of shared and unshared gene sequences (i.e. the genome’s total coding sequence). For each comparison, the unshared coding sequence proportions of both genomes were averaged.
For all phams present in clustered actinobacteriophages, a ‘pham distribution’ metric was computed, reflecting the total number of clusters or singletons in which the pham is present at least once (Supplementary Fig. 9c). The average pham distribution for shared and unshared phams was computed for each pairwise comparison. Orphams are phams that contain a single gene, and the ‘orpham frequency’ metric reflects the total number of orphams present for each comparison (Supplementary Fig. 9c). Sliding window averages for these two metrics were computed as for genome size disparities.
Analysis of prokaryotic Virus Orthologous Groups (VOGs)
We compared our strategy of clustering genes into shared phamilies to the strategy used for prokaryotic viral clusters of orthologous genes (VOGs). VOG data for 1,877 phages in our dataset was downloaded from the pVOG database15 on 2/21/2017. Gene content dissimilarity was computed based on VOG data and plotted it as in Figure 1. While there is a strong correlation between pham-based and VOG-based gene content dissimilarity (Supplementary Fig. 2e), some discrepancy is observed, but this is expected. Phamerator assigns all genes to a pham, even if they are the sole members of the pham. In contrast, the strategy to create VOGs relies on orthologous genes being present in at least three genomes in the dataset, and genes that do not meet this criteria are not assigned a VOG43. As a result, on average only ~60–70% of proteins per phage genome are assigned to VOGs15, which would increase gene content dissimilarity scores.
Creating cluster-specific multi-gene phylogenies
In order to compare Mash-based nucleotide distance to phylogenetic branch lengths, phylogenetic trees were created for specific clusters that differ in lifestyle and evolutionary mode. The phylogenies are based on several structural and assembly genes, which tend to be the most highly conserved genes44. We manually identified highly conserved structural/assembly genes by assessing which phams were present in a majority of phages per cluster and assessing their predicted function based on SEA-PHAGES annotations. Multiple genes were used for each phylogeny, and since different clusters tend to be highly unrelated, it is not possible to create phylogenies based on the same exact types of genes. Specifically, for Cluster A [phams 2847 (head-to-tail connector), 22298 (head-to-tail connector); average concatenated length = 263 amino acids]; for Cluster B [phams 3753 (minor tail subunit), 5322 (capsid morphogenesis), 22085 (major capsid), 22421 (major tail subunit); average concatenated length = 2,214 amino acids]; for Cluster F [phams 431 (head-to-tail connector), 1120 (head-to-tail connector), 3237 (minor tail subunit), 5414 (head-to-tail connector), 5557 (minor tail subunit), 16649 (major tail subunit); average concatenated length = 1,470 amino acids]; for Cluster K [phams 2031 (major tail subunit), 4865 (head-to-tail connector), 7777 (minor tail subunit), 8258 (major capsid), 21863 (scaffold), 21994 (terminase large subunit), 22458 (portal); average concatenated length = 2,203 amino acids]; for Cluster BD [phams 4535 (head-to-tail connector), 5928 (scaffold), 6139 (major capsid), 21799 (minor tail subunit), 21936 (major tail subunit), 22504 (portal); average concatenated length = 1,654 amino acids]. The number of genes used for each cluster-specific phylogeny varied due to the number of highly conserved structural and assembly genes available for analysis in that cluster as well as the average size of the gene (where it was attempted to create concatenated alignments that were comparable in length between clusters). Notably, for Cluster A phages only two genes were used. Originally, two other genes were used [phams 7209 (head-to-tail connector) and 22174 (portal)], but a horizontal gene transfer event among three of the Subcluster A1 phages resulted in an unreliable phylogenetic tree for downstream analysis, so these two genes were not used for the final tree. Protein sequences for each gene set were aligned using webPRANK45 using default settings, all gene alignments for each specific cluster were concatenated, and the concatenated alignments were used to construct phylogenies using PhyML in SeaView software46 using default settings.
Measuring rates of horizontal gene transfer
Rates of horizontal gene transfer were computed using Count software47 as follows. Using the cluster-specific multigene phylogenies and cluster-specific presence/absence pham tables, Count predicted the gain and loss of individual phams across the phylogeny using Wagner parsimony (with equal penalties for gains and losses). For each branch in the tree, gain/loss events were matched to amino acid distances using the ete3 python package. The total gain/loss events were divided by the total branch lengths in the tree (or A1 and non-A1 subtrees in the Cluster A analysis) resulted in the HGT rates, similar to what has been done previously in bacterial genomes27. Summed gain and loss events for phams in specific gene function categories were divided by total branch lengths to obtain gene function-specific HGT rates. Gene function-specific rate deviation from expected (Supplementary Fig. 10d) is the log2 transformed ratio of the proportion of the category’s HGT rate relative to the total HGT rate in the cluster divided by the proportion of phams in the category relative to all phams in the cluster. We note that when larger gain penalties are used, the absolute number of predicted pham gains decreases while that of pham losses increases, as expected, and the sum total of gains and losses increases. Regardless of gain penalty though, the sum total of gains and losses remains proportionally larger in HGCF phages compared to LGCF phages. Therefore, the results using a gain penalty of 1 are reported, which reflect the smallest sum total of gains and losses predicted and are thus a conservative estimate of horizontal gene transfer rates.
Analysis of LysB horizontal gene transfer
All Cluster F phages contain one of two LysB phams (21902 and 6754). All protein sequences from clustered actinobacteriophages that are assigned to either of these two phams were retrieved, and a single alignment and phylogenetic tree was constructed as for the cluster-specific multigene analysis.
Code availability
Custom bash, python, and RStudio scripts were used to execute software, process data, analyze data, and create figures. These are available upon request.
Data availability
The phage metadata, Mash distance data, and gene content dissimilarity data are provided with the paper.
Supplementary Material
Acknowledgments
We thank Jeffrey Lawrence, Roger Hendrix, and Nathan Clark for insightful discussions and Rebekah Dedrick, Deborah Jacobs-Sera, and Welkin Pope for comments on the manuscript. This research was supported by funding from National Institutes of Health grant GM116884, by Howard Hughes Medical Institute grant 54308198, and by National Science Foundation Graduate Research Fellowship grant 1247842.
Footnotes
Author Contributions T.N.M. performed the experiments. T.N.M. and G.F.H. interpreted the results and wrote the paper.
Author Information
The authors declare no competing financial interests.
References
- 1.Canchaya C, Fournous G, Brussow H. The impact of prophages on bacterial chromosomes. Mol Microbiol. 2004;53:9–18. doi: 10.1111/j.1365-2958.2004.04113.x. [DOI] [PubMed] [Google Scholar]
- 2.Bondy-Denomy J, et al. Prophages mediate defense against phage infection through diverse mechanisms. ISME J. 2016 doi: 10.1038/ismej.2016.79. [DOI] [PMC free article] [PubMed] [Google Scholar]
- 3.Rodriguez-Brito B, et al. Viral and microbial community dynamics in four aquatic environments. Isme J. 2010;4:739–751. doi: 10.1038/ismej.2010.1. [DOI] [PubMed] [Google Scholar]
- 4.Brussow H, Canchaya C, Hardt WD. Phages and the evolution of bacterial pathogens: from genomic rearrangements to lysogenic conversion. Microbiol Mol Biol Rev. 2004;68:560–602. doi: 10.1128/MMBR.68.3.560-602.2004. [DOI] [PMC free article] [PubMed] [Google Scholar]
- 5.Pedulla ML, et al. Origins of highly mosaic mycobacteriophage genomes. Cell. 2003;113:171–182. doi: 10.1016/s0092-8674(03)00233-2. [DOI] [PubMed] [Google Scholar]
- 6.Lawrence JG, Hatfull GF, Hendrix RW. Imbroglios of viral taxonomy: genetic exchange and failings of phenetic approaches. J Bacteriol. 2002;184:4891–4905. doi: 10.1128/JB.184.17.4891-4905.2002. [DOI] [PMC free article] [PubMed] [Google Scholar]
- 7.Hendrix RW, Smith MC, Burns RN, Ford ME, Hatfull GF. Evolutionary relationships among diverse bacteriophages and prophages: all the world’s a phage. Proc Natl Acad Sci U S A. 1999;96:2192–2197. doi: 10.1073/pnas.96.5.2192. [DOI] [PMC free article] [PubMed] [Google Scholar]
- 8.Pope WH, et al. Whole genome comparison of a large collection of mycobacteriophages reveals a continuum of phage genetic diversity. Elife. 2015;4:e06416. doi: 10.7554/eLife.06416. [DOI] [PMC free article] [PubMed] [Google Scholar]
- 9.Deng L, et al. Viral tagging reveals discrete populations in Synechococcus viral genome sequence space. Nature. 2014;513:242–245. doi: 10.1038/nature13459. [DOI] [PubMed] [Google Scholar]
- 10.Roux S, Hallam SJ, Woyke T, Sullivan MB. Viral dark matter and virus-host interactions resolved from publicly available microbial genomes. Elife. 2015;4 doi: 10.7554/eLife.08490. [DOI] [PMC free article] [PubMed] [Google Scholar]
- 11.Jordan TC, et al. A broadly implementable research course in phage discovery and genomics for first-year undergraduate students. MBio. 2014;5:e01051–01013. doi: 10.1128/mBio.01051-13. [DOI] [PMC free article] [PubMed] [Google Scholar]
- 12.Ondov BD, et al. Mash: fast genome and metagenome distance estimation using MinHash. Genome Biol. 2016;17:132. doi: 10.1186/s13059-016-0997-x. [DOI] [PMC free article] [PubMed] [Google Scholar]
- 13.Hatfull GF, et al. Exploring the mycobacteriophage metaproteome: phage genomics as an educational platform. PLoS Genet. 2006;2:e92. doi: 10.1371/journal.pgen.0020092. [DOI] [PMC free article] [PubMed] [Google Scholar]
- 14.Cresawn SG, et al. Phamerator: a bioinformatic tool for comparative bacteriophage genomics. BMC Bioinformatics. 2011;12:395. doi: 10.1186/1471-2105-12-395. [DOI] [PMC free article] [PubMed] [Google Scholar]
- 15.Grazziotin AL, Koonin EV, Kristensen DM. Prokaryotic Virus Orthologous Groups (pVOGs): a resource for comparative genomics and protein family annotation. Nucleic Acids Res. 2017;45:D491–D498. doi: 10.1093/nar/gkw975. [DOI] [PMC free article] [PubMed] [Google Scholar]
- 16.Hatfull GF, et al. Comparative Genomic Analysis of 60 Mycobacteriophage Genomes: Genome Clustering, Gene Acquisition, and Gene Size. J Mol Biol. 2010;397:119–143. doi: 10.1016/j.jmb.2010.01.011. [DOI] [PMC free article] [PubMed] [Google Scholar]
- 17.Knowles B, et al. Lytic to temperate switching of viral communities. Nature. 2016;531:466–470. doi: 10.1038/nature17193. [DOI] [PubMed] [Google Scholar]
- 18.Bobay LM, Rocha EP, Touchon M. The adaptation of temperate bacteriophages to their host genomes. Molecular biology and evolution. 2013;30:737–751. doi: 10.1093/molbev/mss279. [DOI] [PMC free article] [PubMed] [Google Scholar]
- 19.Chopin A, Bolotin A, Sorokin A, Ehrlich SD, Chopin M. Analysis of six prophages in Lactococcus lactis IL1403: different genetic structure of temperate and virulent phage populations. Nucleic Acids Res. 2001;29:644–651. doi: 10.1093/nar/29.3.644. [DOI] [PMC free article] [PubMed] [Google Scholar]
- 20.Lima-Mendez G, Van Helden J, Toussaint A, Leplae R. Reticulate representation of evolutionary and functional relationships between phage genomes. Mol Biol Evol. 2008;25:762–777. doi: 10.1093/molbev/msn023. [DOI] [PubMed] [Google Scholar]
- 21.Lucks JB, Nelson DR, Kudla GR, Plotkin JB. Genome landscapes and bacteriophage codon usage. PLoS Comput Biol. 2008;4:e1000001. doi: 10.1371/journal.pcbi.1000001. [DOI] [PMC free article] [PubMed] [Google Scholar]
- 22.Perez Sepulveda B, et al. Marine phage genomics: the tip of the iceberg. FEMS Microbiol Lett. 2016;363 doi: 10.1093/femsle/fnw158. [DOI] [PMC free article] [PubMed] [Google Scholar]
- 23.Grose JH, Casjens SR. Understanding the enormous diversity of bacteriophages: the tailed phages that infect the bacterial family Enterobacteriaceae. Virology. 2014:468–470. doi: 10.1016/j.virol.2014.08.024. [DOI] [PMC free article] [PubMed] [Google Scholar]
- 24.Konstantinidis KT, Ramette A, Tiedje JM. The bacterial species definition in the genomic era. Philos Trans R Soc Lond B Biol Sci. 2006;361:1929–1940. doi: 10.1098/rstb.2006.1920. [DOI] [PMC free article] [PubMed] [Google Scholar]
- 25.Rodriguez-R LMKKT. Bypassing Cultivation to Identify Bacterial Species. ASM Microbe Magazine. 2014;9 [Google Scholar]
- 26.Varghese NJ, et al. Microbial species delineation using whole genome sequences. Nucleic Acids Res. 2015;43:6761–6771. doi: 10.1093/nar/gkv657. [DOI] [PMC free article] [PubMed] [Google Scholar]
- 27.Puigbo P, Lobkovsky AE, Kristensen DM, Wolf YI, Koonin EV. Genomes in turmoil: quantification of genome dynamics in prokaryote supergenomes. BMC Biol. 2014;12:66. doi: 10.1186/s12915-014-0066-4. [DOI] [PMC free article] [PubMed] [Google Scholar]
- 28.Dedrick RM, et al. Prophage-mediated defence against viral attack and viral counter-defence. Nat Microbiol. 2017;2:16251. doi: 10.1038/nmicrobiol.2016.251. [DOI] [PMC free article] [PubMed] [Google Scholar]
- 29.Hendrix RW, Roberts JW, Stahl FW, Weisberg RA. Lambda II. Cold Spring Harbor Press; 1983. [Google Scholar]
- 30.Jacobs-Sera D, et al. On the nature of mycobacteriophage diversity and host preference. Virology. 2012;434:187–201. doi: 10.1016/j.virol.2012.09.026. [DOI] [PMC free article] [PubMed] [Google Scholar]
- 31.Marinelli LJ, et al. Propionibacterium acnes Bacteriophages Display Limited Genetic Diversity and Broad Killing Activity against Bacterial Skin Isolates. MBio. 2012;3 doi: 10.1128/mBio.00279-12. [DOI] [PMC free article] [PubMed] [Google Scholar]
Methods References
- 32.Cock PJ, et al. Biopython: freely available Python tools for computational molecular biology and bioinformatics. Bioinformatics. 2009;25:1422–1423. doi: 10.1093/bioinformatics/btp163. [DOI] [PMC free article] [PubMed] [Google Scholar]
- 33.Huerta-Cepas J, Dopazo J, Gabaldon T. ETE: a python Environment for Tree Exploration. BMC bioinformatics. 2010;11:24. doi: 10.1186/1471-2105-11-24. [DOI] [PMC free article] [PubMed] [Google Scholar]
- 34.McNair K, Bailey BA, Edwards RA. PHACTS, a computational approach to classifying the lifestyle of phages. Bioinformatics. 2012;28:614–618. doi: 10.1093/bioinformatics/bts014. [DOI] [PMC free article] [PubMed] [Google Scholar]
- 35.Leplae R, Lima-Mendez G, Toussaint A. ACLAME: a CLAssification of Mobile genetic Elements, update 2010. Nucleic Acids Res. 2010;38:D57–61. doi: 10.1093/nar/gkp938. [DOI] [PMC free article] [PubMed] [Google Scholar]
- 36.Chithambaram S, Prabhakaran R, Xia X. Differential codon adaptation between dsDNA and ssDNA phages in Escherichia coli. Mol Biol Evol. 2014;31:1606–1617. doi: 10.1093/molbev/msu087. [DOI] [PMC free article] [PubMed] [Google Scholar]
- 37.Klumpp J, Loessner MJ. Listeria phages: Genomes, evolution, and application. Bacteriophage. 2013;3:e26861. doi: 10.4161/bact.26861. [DOI] [PMC free article] [PubMed] [Google Scholar]
- 38.Sau K, Gupta SK, Sau S, Ghosh TC. Synonymous codon usage bias in 16 Staphylococcus aureus phages: implication in phage therapy. Virus research. 2005;113:123–131. doi: 10.1016/j.virusres.2005.05.001. [DOI] [PubMed] [Google Scholar]
- 39.Marchler-Bauer A, et al. CDD: a database of conserved domain alignments with links to domain three-dimensional structure. Nucleic Acids Res. 2002;30:281–283. doi: 10.1093/nar/30.1.281. [DOI] [PMC free article] [PubMed] [Google Scholar]
- 40.Dedrick RM, et al. Function, expression, specificity, diversity and incompatibility of actinobacteriophage parABS systems. Mol Microbiol. 2016;101:625–644. doi: 10.1111/mmi.13414. [DOI] [PMC free article] [PubMed] [Google Scholar]
- 41.Pope WH, et al. Cluster K Mycobacteriophages: Insights into the Evolutionary Origins of Mycobacteriophage TM4. PLoS ONE. 2011;6:e26750. doi: 10.1371/journal.pone.0026750. [DOI] [PMC free article] [PubMed] [Google Scholar]
- 42.Konstantinidis KT, Tiedje JM. Genomic insights that advance the species definition for prokaryotes. Proc Natl Acad Sci U S A. 2005;102:2567–2572. doi: 10.1073/pnas.0409727102. [DOI] [PMC free article] [PubMed] [Google Scholar]
- 43.Tatusov RL, Koonin EV, Lipman DJ. A genomic perspective on protein families. Science. 1997;278:631–637. doi: 10.1126/science.278.5338.631. [DOI] [PubMed] [Google Scholar]
- 44.Hatfull GF, Hendrix RW. Bacteriophages and their Genomes. Current Opinions in Virology. 2011;1:298–303. doi: 10.1016/j.coviro.2011.06.009. [DOI] [PMC free article] [PubMed] [Google Scholar]
- 45.Loytynoja A, Goldman N. webPRANK: a phylogeny-aware multiple sequence aligner with interactive alignment browser. BMC Bioinformatics. 2010;11:579. doi: 10.1186/1471-2105-11-579. [DOI] [PMC free article] [PubMed] [Google Scholar]
- 46.Gouy M, Guindon S, Gascuel O. SeaView version 4: A multiplatform graphical user interface for sequence alignment and phylogenetic tree building. Mol Biol Evol. 2010;27:221–224. doi: 10.1093/molbev/msp259. [DOI] [PubMed] [Google Scholar]
- 47.Csuros M. Count: evolutionary analysis of phylogenetic profiles with parsimony and likelihood. Bioinformatics. 2010;26:1910–1912. doi: 10.1093/bioinformatics/btq315. [DOI] [PubMed] [Google Scholar]
Associated Data
This section collects any data citations, data availability statements, or supplementary materials included in this article.
Supplementary Materials
Data Availability Statement
The phage metadata, Mash distance data, and gene content dissimilarity data are provided with the paper.