
FIGURE 5.
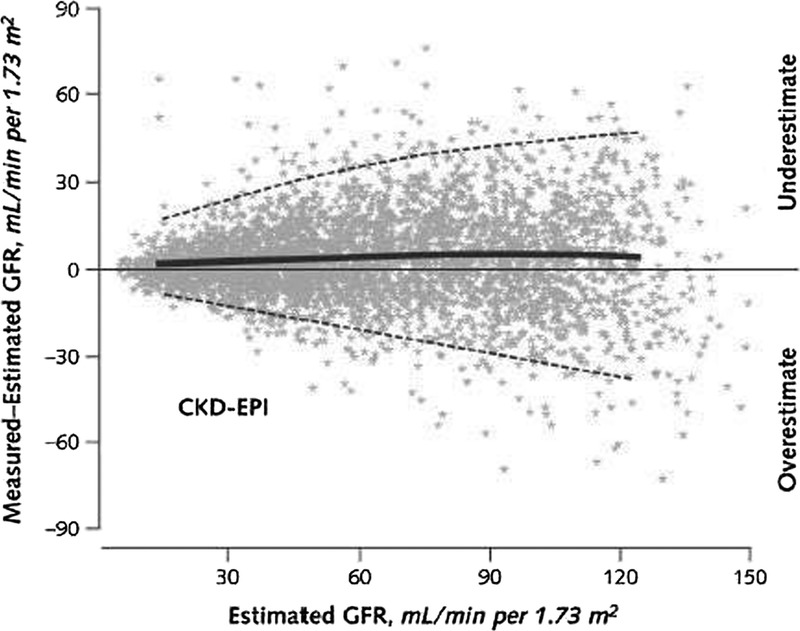
Performance of the CKD-EPI equation in estimating measured GFR. The figure shows the difference between measured and estimated GFR (bias) versus estimated GFR in an external validation dataset (N = 3896). A smoothed regression line is shown with the 95% CI. CI, confidence interval; CKD-EPI, Chronic Kidney Disease Epidemiology Collaboration; GFR, glomerular filtration rate. Copyright © 2009 American College of Physicians and reprinted with permission from Levey AS, Stevens LA, Schmid CH, et al. A new equation to estimate glomerular filtration rate. Ann Intern Med. 2009;150:604-612.128