

Abstract
Dynamic contrast enhanced (DyCE) fluorescence imaging was recently demonstrated for identifying the organs in mice based on principal component analysis (PCA) of contrast kinetics following infusion of indocyanine green (ICG). It occurred to us that this approach could be used to evaluate acute effects of vascular disrupting agents (VDAs), since these cause massive vascular shutdown. As proof of principle, we have examined the action of combretastatin-A4P (CA4P) on MCF7 human breast tumors growing in nude mice. Tumors were implanted in the thigh and allowed to grow to about 7 mm diameter. Indocyanine green (ICG; 50 μl 260 μM) was administered as a bolus by tail vein injection to anesthetized mice. The fluorescence time course was acquired over 200 s using a sensitive charge-coupled device (CCD) camera system. CA4P was then administered IP (120 mg/kg in 100 μl saline) and DyCE repeated following administration of fresh ICG two and 24 hours later. At 2 hours the developed fluorescence intensity was much reduced in the tumors indicating vascular impairment, which was confirmed histologically. After 24 hours there was considerable recovery. Good reproducibility was found for control mice and normal organs. We believe the method shows promise for developing VDAs by evaluating and optimizing therapeutic drug doses and combinations.
Keywords: Combretastatin-A4P, Vascular Disrupting Agents, Dynamic Contrast Enhanced Imaging, Indocyanine Green, Fluorescence Imaging, Tumor, Breast Cancer, Mice
INTRODUCTION
Vascular disrupting agents (VDAs) are a class of molecule causing selective acute vascular damage in tumors and showing promise as therapeutic drugs.1,2 While several VDAs are being evaluated in clinical trials new agents are being actively developed. Initial efficacy and toxicity may be tested in vitro and in cell culture, but a crucial step is evaluation in animal models prior to translation to human subjects. Ideally non-invasive assays are applied and indeed many imaging modalities have been success-fully exploited.3,4 Notably, dynamic contrast enhanced MRI and CT have been applied in both small animals and humans.5–8 Recently, several other approaches have been demonstrated including dynamic bioluminescence imaging (dBLI)6,9 fluorescence10 and ultrasound11 each using contrast agents, as well as near infrared spectroscopy,12 power-Doppler13,14 or color-Doppler15 ultrasound and optoacoustic imaging16 based on blood flow or endogenous chromophores. Each method has strengths and limitations and we have now explored the utility of dynamic contrast enhanced fluorescent imaging to reveal vascular disruption.
Dynamic contrast enhanced (DyCE) fluorescent imaging was recently demonstrated for identifying the organs in mice based on principal component analysis (PCA) of contrast kinetics.17 It occurred to us that this approach could be used to evaluate acute effects of VDAs, since these cause massive vascular shutdown and therefore perturb contrast agent delivery. Combretastatin-A4 phosphate CA4P, also named (Zybrestat™ or fosbretabulin) is a tubulin depolymerizing agent, which has been shown to cause acute vascular disruption in tumors and has been extensively evaluated in mice, and rats and human clinical trials.5,6,18–23 Reported side effects have included hypertension, tumor pain and occasional cardiovascular toxicity.24 It has been stated that CA4P is tumor selective rather than specific and the lack of specificity for tumor endothelium was highlighted by studies showing a CA4-induced inhibition of the neovascularization of hyperplastic thyroids and retina, suggesting that CA4P may be relevant to the treatment of some non-cancer diseases.25 CA4P has been reported to have a plasma half-life in mice of about 1.5 hours and half-life in tumor of under 1 hr.26
As proof of principle, we have now examined the action of combretastatin A-4 phosphate on MCF7 human breast tumors growing in nude mice using DyCE fluorescent imaging.
MATERIALS AND METHODS
Chemicals
CA4P (Fig. 1; OxiGene, South San Francisco, CA) is a white solid, which was dissolved in saline, sterile filtered and used immediately for injection (dosing solution concentration of 120 mg/kg). Matrigel was obtained from BD Biosciences (San Jose, CA). All other chemicals were purchased from Sigma-Aldrich (St. Louis, MO), and were of standard analytic grade or higher.
Figure 1.
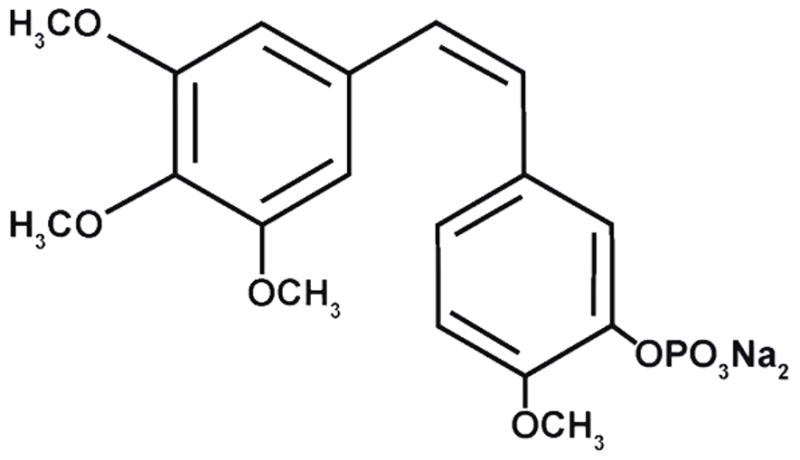
Structure of the Combretastatin A-4P (CA4P)
Cell Line and Animal Model
This study was approved by the UT Southwestern Institutional Animal Care and Use Committee (APN #0464-04-32-1). Human breast cancer cell line MCF7 was obtained from American Type Culture Collection (ATCC, Manassas, VA). The MCF7 cells were cultured in DMEM-medium (custom formula D6046), which was supplemented with 10% FBS (Invitrogen, Carlsbad, CA), 100 U/mL penicillin, 100 μg/mL streptomycin, 1% glutamine and 1% pyruvic acid. The cells were cultured at 37 °C in a 5% CO2 humidified incubator. MCF7 (1 × 10⁶) cells were implanted subcutaneously with 10% Matrigel in the right flanks of 15 female 6–8 week old nude mice (NCI, Frederick, MD).
DyCE Fluorescence Imaging
When tumors reached about 6–8 mm in diameter, DyCE fluorescence imaging was performed using a Maestro imaging system (CRi Inc, Woburn, MA). Each mouse was maintained under general anesthesia (air and 2% isoflurane) and 50 μl indocyanine green (Sigma, ICG; 260 μM or about 10 μg) was administered as a bolus by rapid manual tail vein injection in situ on the imaging bed of the Maestro. The epifluorescent signal time course was observed over 200 s using a set of filters specifically for NIR imaging (excitation, 671–705 nm; detection, 750 nm long pass filter) and 5 images were captured per second with exposure time 50 ms. Following DyCE, CA4P (120 mg/kg in 100 μl saline) was administered IP into each of 8 mice. DyCE was repeated following administration of fresh ICG 2 hours later and again after 24 hours. As a control, saline (100 μl) was injected into an additional cohort of mice (n = 7), repeating the same procedures.
Image Processing
Fluorescence images were processed with the Maestro software 2.10. The entire time course of in vivo images for each mouse acquired before and at various times after injection of ICG, was examined for quantification. The automated PCA analysis was performed to help identify organs. Regions of interest corresponding to tumor and major organs were identified and the signal evolution evaluated for the baseline, 2 hour and 24 hour data sets for both CA4P and control saline. For statistical comparison the total photon count for each region of interest was normalized by comparison with a major blood vessel (identified in red in Figs. 2–5) based on maximum signal intensity and signal intensity at 200 s. Data were compared using an analysis of variance (ANOVA) on the basis of Fisher’s PLSD tests.
Figure 2.

Dynamic Fluorescent Imaging of ICG infusion with respect to CA4P. Top row: Series of images showing fluorescence intensity at various times after infusion of ICG in the tail vein of nude mouse with MCF7 human breast tumor xenograft in right thigh. At every time point including pre-ICG infusion, there was a bright region in the abdomen, which we attribute to intense auto fluorescence from food. Color overlay at right shows tissue regions identified by principal component analysis of the signal intensity variation following ICG infusion (50 l, 260 μM). Distinct regions were identified as tumor (green), liver (blue), main vasculature (red), kidneys (light blue) and vessel supplying tumor (yellow). Middle row: Corresponding images obtained from same mouse following administration of fresh ICG 2 hrs after administration of CA4P (120 mg/kg in saline 100 μl IP). Bottom row: Corresponding images 24 hrs later.
Figure 5.

Principal component analysis of mouse organs based on DyCE with respect to control saline treatment. Data similar to Figure 4, but for control mouse with infusion of saline
Immunohistology
After imaging, one treated and one control mouse were injected in the tail vein with Hoechst 33342 perfusion marker dye (Invitrogen, Eugene, Oregon, USA, 10 mg/Kg). After 1 minute, the mice were sacrificed and the tumors excised and embedded in Tissue-Tek OCT (Miles Laboratory, Elkhart, IN) and stored at − 80 °C. Cryosections (6 μm) were cut and fixed with 4% paraformaldehyde for 15 min. at room temperature. After blocking with normal goat serum for 30 min. the slides were incubated with primary rat-anti-mouse CD31 anti-body (1:1600, BD Pharmingen, USA) overnight at 4 °C. Slides were rinsed three times at 5 minute intervals with PBS and incubated with Alexa Fluor 488 goat anti-rat antibody (1:1000, Molecular Probes, Eugene, OR) for two hours in the dark. Microscopy used an LSM 510 Meta confocal microscope (Carl Zeiss Microscopy, Germany).
RESULTS
Prior to infusing ICG, there was little fluorescent signal except for a bright region, which we attribute to food (Fig. 2). Upon infusing ICG there was rapid evolution of signal consistent with heart, major blood vessels, and brain, which progressively spread throughout the body and then tended to accumulate in the liver. As expected principal component analysis of the ICG pharmacokinetics revealed distinct tissues, including tumor, liver, kidneys, and major blood vessels (Fig. 2) and differential contrast kinetics were apparent (Fig. 3). Background signal indicates variation in signal over lower abdomen, which did not seem to be associated with a specific organ and presumably represents capillary bed in skin. The maximum signal observed in the liver was significantly greater than for the tumor (p< 0.001). Two hours after administration of the VDA CA4P IP at 120 mg/kg, much less fluorescence was seen in the tumor following administration of fresh ICG Figs. 2 and 3). The individual tumors showed consistent response with at least 40% (typically, 70%) reduction in emitted signal intensity at 2 hours (Figs. 2 and 3). Comparison of the maximum signal intensity or signal intensity 100 s after ICG infusion showed a significant decrease (p < 0.05) for the group of five tumors where consecutive IV infusion was successful. After 24 hours some tumors showed recovery of signal enhancement, though it was often little different compared with the 2 hour time point. Curves show differential variation in tissue signal intensity over a period of 200 s following ICG infusion. Other organs showed relatively consistent dynamic signal patterns at each time point. For animals receiving control saline the signal dynamics tended to be quite consistent for all tissues including tumor (Figs. 4 and 5). There was a significant difference between the signal intensity of the group of tumors receiving drug, versus those receiving saline at 2 hrs (p < 0.001). At baseline the two groups showed no significant difference (p > 0.46).
Figure 3.

Principal component analysis of mouse organs based on DyCE with respect to CA4P treatment. Multiple organs such as liver, kidneys, primary vasculature and tumor were identified and the contrast dynamics are presented at baseline top right. Individual curves are shown below for baseline and 2 hours and 24 hours after CA4P.
Figure 4.

Dynamic fluorescent Imaging of ICG infusion for control mouse. Data similar to Figure 2, but for control mouse with respect to infusion of saline.
Tumor vascular density and perfusion were confirmed using anti-CD31 staining (green, tumor vasculature marker) and distribution of Hoechst 33342 (blue, perfusion marker) (Fig. 6). The control tumors showed extensive well perfused vasculature at baseline and following administration of saline, without any significant changes in the fluorescence intensity of CD31 staining and Hoechst distribution (p > 0.05) (Fig. 6). For CA4P treated tumors, blood vessels were found to be distributed throughout the tumor based on anti-CD31 staining at each time point with no significant change (p > 0.05), but the fluorescence intensity and distribution of Hoechst perfusion marker were significantly lower following CA4P, particularly at the 2 hour time point, with only about 15% of baseline values (p < 0.01, Fig. 6), though with recovery at the 24 hour time point (64%, p > 0.05).
Figure 6.

Histological confirmation of vascular extent and shutdown following CA4P. Upper row: CA4P treated tumors; lower row: saline controls. Baseline, 2 hours and 24 hours, after drug or saline, tumors excised and frozen 1 minute after infusion of Hoechst 33342 dye IV. Blue: Hoechst 33342, green: CD31.
DISCUSSION
DyCE based on principal component analysis revealed differential ICG distribution and signal kinetics. The kinetics were reproducible and quite similar for each tumor, but showed a significant decrease 2 hours after administration of the vascular disrupting agent CA4P, as expected. Other organs showed little variation revealing the selective activity of the VDA non-invasively.
The development of commercial small animal optical imaging instruments has facilitated routine investigations of fluorescent and bioluminescent reporters, most notably in terms of tumor growth. However, more specialist applications include Hillman’s development of DyCE, 17,27 which reveals multiple organs in nude mice and has stimulated several studies of ICG pharmacokinetics. Notably, Amoozegar et al.28 examined liver damage in nude mice following carbon tetrachloride administration and established correlation between ICG uptake in the liver visualized by DyCE and plasma alanine aminotransferase (ALT) concentration, which is a traditional biomarker. Lee et al.29 presented a preliminary report of dynamic fluorescent imaging to monitor the anti angiogenesis response to bevacizumab in human Ewing sarcoma xenografts in nude mice. Ku et al.30 revealed acute regional cerebral ischemia in mice subject to middle cerebral artery occlusion.
Valentini et al.10 reported a somewhat similar study to that presented here, specifically using optical assessment of ICG to reveal the acute effects of the VDA ZD6126. They examined both epifluorescence and time correlated single photon counting (TCSPC) using a lab-built system. They reported that optical absorption and ICG fluorescence measured with the TCSPC apparatus in transmittance geometry did not provide robust differentiation between control and treated groups, but epifluorescence showed significantly lower emission from treated tumors compared with control mice 3 hrs after administering the VDA. They compared separate cohorts of mice at each time point, as opposed to the repeated longitudinal dynamics used here and they also used a larger injection volume (300 μl with 30 μg ICG vs. 50 μl with 10 μgICG). We have used ICG to reveal altered perfusion, but in principle other fluorescent markers could be applied. A recent study demonstrated the use of DyCE to examine uptake of 800CW labeled deoxyglucose in brain tumors following IV infusion 31 and presumably, such uptake would be impaired by a VDA.
Optical imaging is attractive since it is relatively cheap, easy to implement and allows high throughout, as well as avoiding the radiation associated with CT or radionuclide tracers. However, optical imaging is often limited to surface tissues and spatial resolution is generally poor. ICG is an attractive tracer since it is FDA approved and is used in humans offering the potential for clinical assessment of VDA activity.32
The major drawback of DyCE for evaluating VDAs is the need for IV injection. Sequential measurements are sufficiently separated (0, 2, 24 hrs) that it is impractical to leave an implanted catheter in mice, but repeated tail vain injections are technically challenging. We achieved a success rate of 10 of 15 for the second injection at two hours and four of 15 for a successful third injection, but this difficulty is also encountered for many MRI and radionuclide imaging approaches. In this respect, we have found dynamic bioluminescent imaging (dBLI) to be useful, since luciferin may be injected subcutaneously, and the dynamic evolution of light emission from a tumor correlates with VDA activity.4,9,14 Of course BLI requires cells to be transfected to express luciferase, and while these are widely available, it limits the ability to work with spontaneous tumors or primary tumor xenografts.
CONCLUSION
We have demonstrated a further application of DyCE to probe tumor vasculature non-invasively and reveal the effects of a vascular disrupting agent. DyCE provides a facile non-invasive non-radioactive approach with a clinically acceptable reporter molecule, ICG, adding to the armamentarium of the imaging scientist.
Acknowledgments
CA4P was kindly provided by Dr. Dai Chaplin of OxiGene. We are grateful to Drs. Kevin Pinney and Mary Lynn Trawick (Baylor University) and Richard Levenson (formerly of Cri) for valuable discussions. Research was supported in part by funds from NIH R01 CA140674 and U24 CA126608, and facilitated by the Southwestern Small Animal Imaging and Live Cell Imaging Resources of the Harold C. Simmons Cancer Center through an NCI Cancer Center Support Grant, 1P30 CA142543. The CRi Maestro was provided by a DOE grant #DE-FG02-05CH11280.
References
- 1.Siemann DW. The unique characteristics of tumor vasculature and preclinical evidence for its selective disruption by tumor-vascular disrupting agents. Cancer Treat Rev. 2011;37:63. doi: 10.1016/j.ctrv.2010.05.001. [DOI] [PMC free article] [PubMed] [Google Scholar]
- 2.Thorpe PE. Vascular targeting agents as cancer therapeutics. Clin Cancer Res. 2004;10:415. doi: 10.1158/1078-0432.ccr-0642-03. [DOI] [PubMed] [Google Scholar]
- 3.Laking GR, West C, Buckley DL, Matthews J, Price PM. Imaging vascular physiology to monitor cancer treatment. Crit Rev Oncol Hematol. 2006;58:95. doi: 10.1016/j.critrevonc.2005.10.006. [DOI] [PubMed] [Google Scholar]
- 4.Mason RP, Zhao D, Liu L, Trawick ML, Pinney KG. A perspective on vascular disrupting agents that interact with tubulin: Preclinical tumor imaging and biological assessment. Integrat Biol. 2011;3:375. doi: 10.1039/c0ib00135j. [DOI] [PMC free article] [PubMed] [Google Scholar]
- 5.Beauregard DA, Pedley RB, Hill SA, Brindle KM. Differential sensitivity of two adenocarcinoma xenografts to the anti-vascular drugs combretastatin A4 phosphate and 5,6-dimethylxanthenone-acetic acid, assessed using MRI and MRS. NMR Biomed. 2002;15:99. doi: 10.1002/nbm.723. [DOI] [PubMed] [Google Scholar]
- 6.Zhao D, Richer E, Antich PP, Mason RP. Antivascular effects of combretastatin A4 phosphate in breast cancer xenograft assessed using dynamic bioluminescence imaging (BLI) and confirmed by magnetic resonance imaging (MRI) FASEB J. 2008;22:2445. doi: 10.1096/fj.07-103713. [DOI] [PMC free article] [PubMed] [Google Scholar]
- 7.Stevenson JP, Rosen M, Sun W, Gallagher M, Haller DG, Vaughn D, Giantonio B, Zimmer R, Petros WP, Stratford M, Chaplin D, Young SL, Schnall M, O’Dwyer PJ. Phase I trial of the antivascular agent combretastatin A4 phosphate on a 5-day schedule to patients with cancer: magnetic resonance imaging evidence for altered tumor blood flow. J Clin Oncol. 2003;21:4428. doi: 10.1200/JCO.2003.12.986. [DOI] [PubMed] [Google Scholar]
- 8.Jin M, Hao G, Sun X, Chen W. Nanoparticle-based positron emission tomography and single photon emission computed tomography imaging of cancer. Rev Nanosci Nanotech. 2012;1:3. [Google Scholar]
- 9.Liu L, Beck H, Wang X, Hsieh HP, Mason RP, Liu X. Tubulin-destabilizing agent BPR0L075 induces vascular-disruption in human breast cancer mammary fat pad xenografts. PLoS ONE. 2012;7:e43314. doi: 10.1371/journal.pone.0043314. [DOI] [PMC free article] [PubMed] [Google Scholar]
- 10.Valentini G, D’Andrea C, Ferrari R, Pifferi A, Cubeddu R, Martinelli M, Natoli C, Ubezio P, Giavazzi R. In vivo measurement of vascular modulation in experimental tumors using a fluorescent contrast agent. Photochem Photobiol. 2008;84:1249. doi: 10.1111/j.1751-1097.2008.00352.x. [DOI] [PubMed] [Google Scholar]
- 11.Foley KP, Zhou D, Borella C, Wu Y, Zhang M, Jiang J, Li H, Sang J, Korbut T, Ye J, Zhang X, Barsoum J, Sonderfan AJ. The vascular disrupting agent STA exhibits potent antitumor activity by selectively targeting microvasculature at both the center and periphery of tumors. J Pharmacol Exp Therapeut. 2012;343:529. doi: 10.1124/jpet.112.196873. [DOI] [PubMed] [Google Scholar]
- 12.Zhao D, Chang C-H, Kim JG, Liu H, Mason RP. In vivo near-infrared spectroscopy and MRI monitoring of tumor response to Combretastatin A4 phosphate correlated with therapeutic outcome. Int J Radiat Onco Biol Phys. 2011;80:574. doi: 10.1016/j.ijrobp.2010.12.028. [DOI] [PMC free article] [PubMed] [Google Scholar]
- 13.Goertz DE, Yu JL, Kerbel RS, Burns PN, Foster FS. high-frequency Doppler ultrasound monitors the effects of antivascular therapy on tumor blood flow. Cancer Res. 2002;62:6371. [PubMed] [Google Scholar]
- 14.Alhasan MK, Liu L, Lewis MA, Magnusson J, Mason RP. Comparison of optical and power Doppler ultrasound imaging for non-invasive evaluation of arsenic trioxide as a vascular disrupting agent in tumors. PLoS ONE. 2012;7:e46106. doi: 10.1371/journal.pone.0046106. [DOI] [PMC free article] [PubMed] [Google Scholar]
- 15.Hadimani MB, MacDonough MT, Strecker ET, Lopez R, Sriram M, Nguyen BL, Kessler RJ, Ghatak A, Shirali AR, Liu L, Garner GM, Pettit GR, Hamel E, Chaplin DJ, Mason RP, Trawick ML, Pinney KG. Synthesis of a 2-arylaroyl indole salt (OXi8007) resembling combretastatin a with application as a vascular disrupting agent. J Nat Prod. 2013;76:1668. doi: 10.1021/np400374w. [DOI] [PMC free article] [PubMed] [Google Scholar]
- 16.Laufer J, Johnson P, Zhang E, Treeby B, Cox B, Pedley B, Beard P. In vivo preclinical photoacoustic imaging of tumor vas-culture development and therapy. J Biomed Optics. 2012;17:056016. doi: 10.1117/1.JBO.17.5.056016. [DOI] [PubMed] [Google Scholar]
- 17.Hillman EMC, Moore A. All-optical anatomical co-registration for molecular imaging of small animals using dynamic contrast. Nat Photonics. 2007;1:526. doi: 10.1038/nphoton.2007.146. [DOI] [PMC free article] [PubMed] [Google Scholar]
- 18.Dark GG, Hill SA, Prise VE, Tozer GM, Pettit GR, Chaplin DJ. Combretastatin A, an agent that displays potent and selective toxicity toward tumor vasculature. Cancer Res. 1997;57:1829. [PubMed] [Google Scholar]
- 19.Tozer GM, Prise VE, Wilson J, Cemazar M, Shan SQ, Dewhirst MW, Barber PR, Vojnovic B, Chaplin DJ. Mechanisms associated with tumor vascular shut-down induced by combretastatin A phosphate: Intravital microscopy and measurement of vascular permeability. Cancer Res. 2001;61:6413. [PubMed] [Google Scholar]
- 20.Galbraith SM, Maxwell RJ, Lodge MA, Tozer GM, Wilson J, Taylor NJ, Stirling JJ, Sena L, Padhani AR, Rustin GJS. Combretastatin A4 phosphate has tumor antivascular activity in rat and man as demonstrated by dynamic magnetic resonance imaging. J Clin Oncol. 2003;21:2831. doi: 10.1200/JCO.2003.05.187. [DOI] [PubMed] [Google Scholar]
- 21.Zhao D, Jiang L, Hahn EW, Mason RP. Tumor physiological response to combretastatin A4 phosphate assessed by MRI. Int J Radiat Oncol Biol Phys. 2005;62:872. doi: 10.1016/j.ijrobp.2005.03.009. [DOI] [PubMed] [Google Scholar]
- 22.Ley CD, Horsman MR, Kristjansen PEG. Early effects of combretastatin-A4 disodium phosphate on tumor perfusion and interstitial fluid pressure. Neoplasia. 2007;9:108. doi: 10.1593/neo.06733. [DOI] [PMC free article] [PubMed] [Google Scholar]
- 23.Lunt SJ, Akerman S, Hill SA, Fisher M, Wright VJ, Reyes-Aldasoro CC, Tozer GM, Kanthou C. Vascular effects dominate solid tumor response to treatment with combretastatin A-phosphate. Int J Cancer. 2011;129:1979. doi: 10.1002/ijc.25848. [DOI] [PubMed] [Google Scholar]
- 24.Nagalah G, Remick SC. Combretastatin A4 phosphate: a novel vascular disrupting agent. Future Oncol. 2010;5:1219. doi: 10.2217/fon.10.90. [DOI] [PubMed] [Google Scholar]
- 25.West CML, Price PM. Combretastatin A4 phosphate. Anti-Cancer Drugs. 2004;15:179. doi: 10.1097/00001813-200403000-00001. [DOI] [PubMed] [Google Scholar]
- 26.Kirwan IG, Loadman PM, Swaine DJ, Anthoney DA, Pettit GR, Lippert JW, Shnyder SD, Cooper PA, Bibby MC. Comparative preclinical pharmacokinetic and metabolic studies of the Combretastatin prodrugs Combretastatin A4 phosphate and A1 phosphate. Clin Cancer Res. 2004;10:1446. doi: 10.1158/1078-0432.ccr-0518-03. [DOI] [PubMed] [Google Scholar]
- 27.Hillman EMC, Amoozegar CB, Wang T, McCaslin AFH, Bouchard MB, Mansfield J, Levenson RM. In vivo optical imaging and dynamic contrast methods for biomedical research. Phil Trans A Math Phys Engin Sci. 2011;369:4620. doi: 10.1098/rsta.2011.0264. [DOI] [PMC free article] [PubMed] [Google Scholar]
- 28.Amoozegar CB, Wang T, Bouchard MB, McCaslin AFH, Blaner WS, Levenson RM, Hillman EMC. Dynamic contrast-enhanced optical imaging of in vivo organ function. J Biomed Optics. 2012;17:096003. doi: 10.1117/1.JBO.17.9.096003. [DOI] [PMC free article] [PubMed] [Google Scholar]
- 29.Lee J, Poschinger T, Hernandez SL, Huang JZ, Johung T, Kandel J, Yamashiro DJ, Hielscher AH. Monitoring of anti-angiogenic drug response with dynamic fluorescence imaging. Proceedings of the IEEE 36th Annual North-east Bioengineering Conference; New York, NY, USA. June (2010). [Google Scholar]
- 30.Ku T, Choi C. Noninvasive optical measurement of cerebral blood flow in mice using molecular dynamics analysis of indocyanine green. PLoS ONE. 2012;7:e48383. doi: 10.1371/journal.pone.0048383. [DOI] [PMC free article] [PubMed] [Google Scholar]
- 31.Zhou H, Luby-Phelps K, Mickey BE, Habib AA, Mason RP, Zhao D. Dynamic near-infrared optical imaging of 2-deoxyglucose uptake by intracranial glioma of athymic mice. PLoS ONE. 2009;4:e8051. doi: 10.1371/journal.pone.0008051. [DOI] [PMC free article] [PubMed] [Google Scholar]
- 32.Marshall MV, Rasmussen JC, Tan IC, Aldrich MB, Adams KE, Wang X, Fife CE, Maus EA, Smith LA, Sevick-Muraca EM. Near-infrared fluorescence imaging in humans with indocyanine green: a review and update. Open Surg Oncol J. 2010;2:12. doi: 10.2174/1876504101002010012. [DOI] [PMC free article] [PubMed] [Google Scholar]