

Abstract
The transcription factor STAT5 plays a critical role in B cell acute lymphoblastic leukemia (B-ALL). How STAT5 mediates this effect is unclear. Here we demonstrate that STAT5 activation cooperates with defects in the pre-BCR signaling components encoded by Blnk, Btk, Prkcb, Nfkb1, and Ikzf1 to initiate B-ALL. STAT5 antagonizes NF-κB and IKAROS by opposing regulation of shared target genes. STAT5 binding was enriched at super-enhancers, which were associated with an opposing network of transcription factors, including PAX5, EBF1, PU.1, IRF4, and IKAROS. Patients with high ratios of active STAT5 to NF-κB or IKAROS have more aggressive disease. Our studies illustrate that an imbalance of two opposing transcriptional programs drive B-ALL, and suggest that restoring the balance of these pathways may inhibit B-ALL.
Acute lymphoblastic leukemia (ALL) is the most common form of cancer in children and predominantly arises from the transformation of B cell progenitors (80–85% of cases)1. Current therapies have improved the 5-year event free survival of children with ALL to 80–90%. However, despite these advances, ALL remains a leading cause of cancer-related death in children and young adults. Moreover, the outcome for adults with ALL tends to be much worse, as only 30% of adults achieve long-term disease free survival2. Most current therapies are non-specific and cause off-target effects such as impaired intellectual and psychomotor function, neuroendocrine abnormalities, impaired reproductive capacity, cardiotoxicity, and secondary neoplasms3–5. Moreover, some patients that currently receive intensive therapy are likely being over-treated and could potentially be cured using less intensive regimens6. Therefore, new stratification methods and therapies need to be developed to more accurately identify and treat high-risk groups of B-ALL.
The transcription factor STAT5 plays a critical role in transformation of progenitor B cells7. For example, STAT5 is required for BCR-ABL and TEL-JAK2 dependent transformation of progenitor B cells8–10. However, the exact mechanism by which STAT5 drives transformation remains unclear. Previous studies suggested that STAT5 simply promotes the survival of progenitor B cells and that the role of STAT5 in transformation is limited to its pro-survival effects11,12. However, other roles for STAT5 in B-ALL have not been explored.
Deregulation of pre-BCR signaling has also been shown to be important in the development of B-ALL. For example, defects in the adaptor protein BLNK when paired with activated STAT5 promote pre-B cell transformation13. However, BLNK regulates many downstream pathways - which of these pathways exerts tumor suppressor function remains unclear. Finally, in addition to the pre-BCR, a number of transcription factors including PAX5, EBF1, and IKAROS have been suggested to play a key role in progenitor B cell transformation14. These transcription factors form a transcriptional network that plays a key role in promoting B cell differentiation15. Importantly, the genes encoding these transcription factors are frequently deleted in B-ALL patient samples, suggesting that they play a role in transformation14. Consistent with this observation, haploinsufficiency for Pax5 or Ebf1 synergizes with STAT5 activation to initiate leukemia16. However, how these transcription factors suppress B-ALL,, whether they interact with STAT5, and if that interaction is important in transformation, remains unknown.
Herein we demonstrate that STAT5 cooperates with defects in a coherent pre-BCR pathway including the adaptor protein BLNK, the associated kinases BTK and PKCβ, and the downstream transcription factors NF-κB and IKAROS. Using microarray and ChIP-Seq approaches we demonstrate that STAT5 tends to reciprocally regulate target gene expression by NF-κB and IKAROS tumor suppressor pathways. Moreover, STAT5 binding overlapped with a larger cohort of transcription factors at super-enhancers linked to genes that control the survival, proliferation and differentiation of progenitor B cells. Finally, analysis of human B-ALL patient samples revealed that the ratio of STAT5 activation to IKZF1 or NF-κB expression was a more powerful predictor of disease outcome than either of these factors alone. Thus, an imbalance between STAT5 and the pre-BCR–NF-κB–IKAROS pathway promotes the development of B-ALL while the degree of imbalance underlies the severity of disease as measured by overall survival and remission duration.
Results
Stat5b-CA mice spontaneously develop B-ALL-like disease
To study the role of STAT5 in B-ALL, we utilized transgenic mice that express a constitutively active form of STAT5b throughout B cell development (Stat5b-CA mice)17. Approximately 2–10% of Stat5b-CA mice develop leukemia13,17 characterized as progenitor B cell leukemia based on the expression pattern of CD19, IL-7Rα, pre-BCR, and BP-1 (Fig. 1a, Supplementary Fig. 1a). The low incidence of leukemia suggests that Stat5b-CA cells require additional mutations to induce transformation. To identify commonly mutated pathways in the Stat5b-CA leukemias, we carried out microarray analyses on pre-B cells sorted from C57BL/6 bone marrow and pre-B leukemic cells from Stat5b-CA mice. As expected, Stat5b-CA leukemic cells showed increased expression of the known STAT5 targets c-Myc and Ccnd2 (Cyclin D2) or Cyclin D1 (Ccnd1) when compared to pre-B cells from C57BL/6 control mice (Fig. 1b). Interestingly, the leukemic cells also had increased expression of asparagine synthetase (Asns), a major chemotherapy target for ALL18. Many other genes were also deregulated in Stat5b-CA pre-B leukemia cells, including components of the pre-BCR signaling pathway, such as Blk, Syk, and Prkcb (Fig. 1b). In contrast, surface expression of the pre-BCR was increased (Fig. 1a,b). This finding is consistent with previous studies showing that pre-BCR signaling triggers a negative feedback loop that reduces Vpreb1 and Igll119. Together, these results led us to hypothesize that STAT5 activation cooperates with defects in pre-BCR signaling components to initiate B-ALL.
Figure 1. Stat5b-CA drives pre-B leukemia.
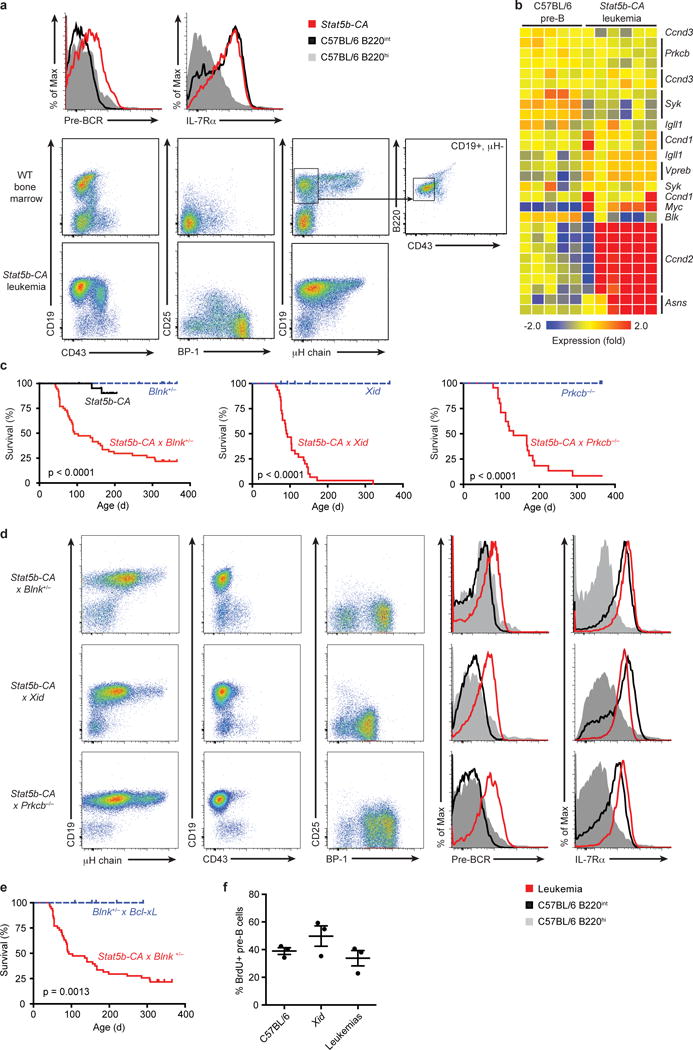
(a) Flow cytometric analysis of bone marrow from leukemic Stat5b-CA mice (red histogram and bottom panels) or C57BL/6 mice (grey and black histograms and middle panels). Boxes in C57BL/6 (i.e. WT) plots show gates used to sort WT pre-B cells for use in microarray studies (b) mRNA expression in Stat5b-CA B-ALL as determined by microarray analysis. RNA was isolated from CD19+B220+ tumor lymph node cells (n = 6 mice) or sorted wild-type pre-B cells (B220+CD19+μHloCD43lo; n = 5 samples pooled from 3–8 mice per sample). (c) Survival of Stat5b-CA (n = 22), Stat5b-CA x Blnk+/− (n = 52), Stat5b-CA x Xid (n = 30), and Stat5b-CA x Prkcb−/− (n = 22) mice compared to Blnk+/− (n = 35), Xid (n = 7), and Prkcb−/− (n = 10) littermate controls. (d) Flow cytometric analysis of bone marrow from leukemic Stat5b-CA x Blnk+/− (top panels), Stat5b-CA x Xid (middle panels), and Stat5b-CA x Prkcb−/− (bottom panels) mice (dot plot and red histogram) or wild-type mice (grey and black histograms). (e) Survival of Blnk+/− x Bcl2l1 (n = 10) compared to Stat5b-CA x Blnk+/− (n = 52) mice. Deaths in c and e are indicative of tumor development. (f) BrdU analysis of pre-B cell proliferation. P-values in c and e determined by log-rank Mantle-Cox test. P = 0.19 (One-way ANOVA (f)). Data are representative of 3 independent experiments (f; mean ± SEM), or 9 (a), 25 (d, top plot), 10 (d, middle plot), or 8 (d, bottom plot) independent experiments with a total of 13 (a) 35 (d, top plot), 17 (d, middle plot), or 13 (d, bottom plot) mice per genotype.
Stat5b-CA and defects in pre-BCR pathway initiate B-ALL
To test our hypothesis, we bred Stat5b-CA mice to mice harboring loss-of-function mutations in the pre-BCR adaptor Blnk, or the downstream kinases Btk (Xid mutant) or Prkcb. Stat5b-CA x Blnk+/−, Stat5b-CA x Xid and Stat5b-CA x Prkcb−/− mice rapidly developed leukemia with high frequency (Fig. 1c). In contrast, Blnk+/−, Xid and Prkcb−/−control mice never developed leukemia and Stat5b-CA mice only had a low incidence of leukemia. The Stat5b-CA x Blnk+/−, Stat5b-CA x Xid and Stat5b-CA x Prkcb−/− leukemias resemble pre-B cell leukemia based on high expression of CD19, IL7Rα, pre-BCR and BP-1, but low/absent expression of CD43, Igκ and Igλ (Fig. 1d, data not shown). Likewise, the global mRNA expression patterns in Stat5b-CA x Blnk+/−, Stat5b-CA x Xid and Stat5b-CA x Prkcb−/−leukemias, and the sorted wild-type, Xid and Stat5b-CA pre-B control samples used for comparison, were most similar to that of large pre-B cells (Hardy fraction C’) in the immgen.org database (Supplementary Fig. 1a). Thus, these results confirmed our hypothesis that STAT5 activation cooperates with defects in a specific pre-BCR signaling pathway to drive highly penetrant progenitor B cell leukemia.
Survival effects of STAT5 alone do not initiate leukemia
Previous studies have suggested that the role of STAT5 in the transformation of progenitor B cells is solely to prevent apoptosis11,12. To test this possibility, we bred Blnk+/− mice with transgenic Bcl2l1 (i.e., Bcl-XL) mice20. Bcl2l1 transgenic mice exhibit comparable expansion of progenitor B cells as seen in Stat5b-CA mice17,20,21. However, BCL-XL overexpression did not cooperate with Blnk heterozygosity to initiate leukemia (Fig. 1e). We then used BrdU labeling to test if STAT5 drives transformation by enhancing cell division. These experiments revealed that Stat5b-CA x Xid leukemias do not proliferate significantly more than wild-type or Xid pre-B cells (Fig. 1f). Therefore, STAT5 does not induce leukemia by solely promoting survival or enhancing the proliferation of progenitor B cells.
NF-κB suppresses STAT5-dependent leukemia
A downstream target of the BLNK–BTK–PKCβ pathway is the transcription factor NF-κB22. Microarray analysis established that expression of 67 out of 95 NF-κB target genes normally expressed in pre-B cells was altered in Stat5b-CA x Blnk+/−, Stat5b-CA x Xid and Stat5b-CA x Prkcb−/− leukemias compared to wild-type pre-B cells (Fig. 2a and Supplementary Fig. 1b). The expression of several NF-κB target genes was already partially reduced in non-transformed progenitor B cells from Stat5b-CA mice (Fig. 2b). To further identify genes synergistically regulated by STAT5 and NF-κB, we made use of an algorithm developed by Land and colleagues to identify factors that cooperatively regulate downstream target genes23. Using this algorithm we identified 25 NF-κB target genes that are likely synergistically deregulated by STAT5 activation and decreased pre-BCR signaling, including the oncogenes Bcl2, Ccnd2 and Myc (Fig. 2c). To determine if STAT5 can deregulate NF-κB target gene expression directly, we performed ChIP-Seq on STAT5 in Stat5b-CA x Blnk+/− leukemias. STAT5 bound ~30% of all genes (P <1.1 × 10⁻¹⁶) and ~50% of NF-κB target genes (P = 9.0 × 10⁻⁷) that were deregulated in all three leukemic strains (Fig. 2d,e and Fig. 3a). One mechanism by which STAT5 could interfere with NF-κB target gene expression would be if STAT5 and NF-κB exhibited overlapping DNA binding sites. Consistent with this idea, STAT5 binding sites identified by ChIP-Seq in Stat5b-CA x Blnk+/− leukemic cells showed enrichment for nearby NF-κB binding motifs, suggesting that STAT5 and NF-κB share binding sites at numerous loci (Fig. 3b,c and Supplementary Table 1). To test if these factors can compete for binding, we stimulated Stat5b-CA x Blnk+/− leukemic cells with IL-7 to increase amounts of active STAT5. IL-7 treatment led to an increase in STAT5 binding (2.4-fold) and a concomitant decrease in RELA binding (1.5-fold) to the Igk intronic enhancer (Fig. 3d), which plays an important role in pre-B cell differentiation. In contrast, when examining competition at the Myc gene, which regulates pre-B cell proliferation and growth, we did not observe such competition and in fact observed enhanced RELA binding (Supplementary Fig. 2a). Thus, STAT5 competes with NF-κB binding at some but not all overlapping binding sites.
Figure 2. STAT5 activation synergizes with pre-BCR signaling defects to deregulate NF-κB target gene expression.
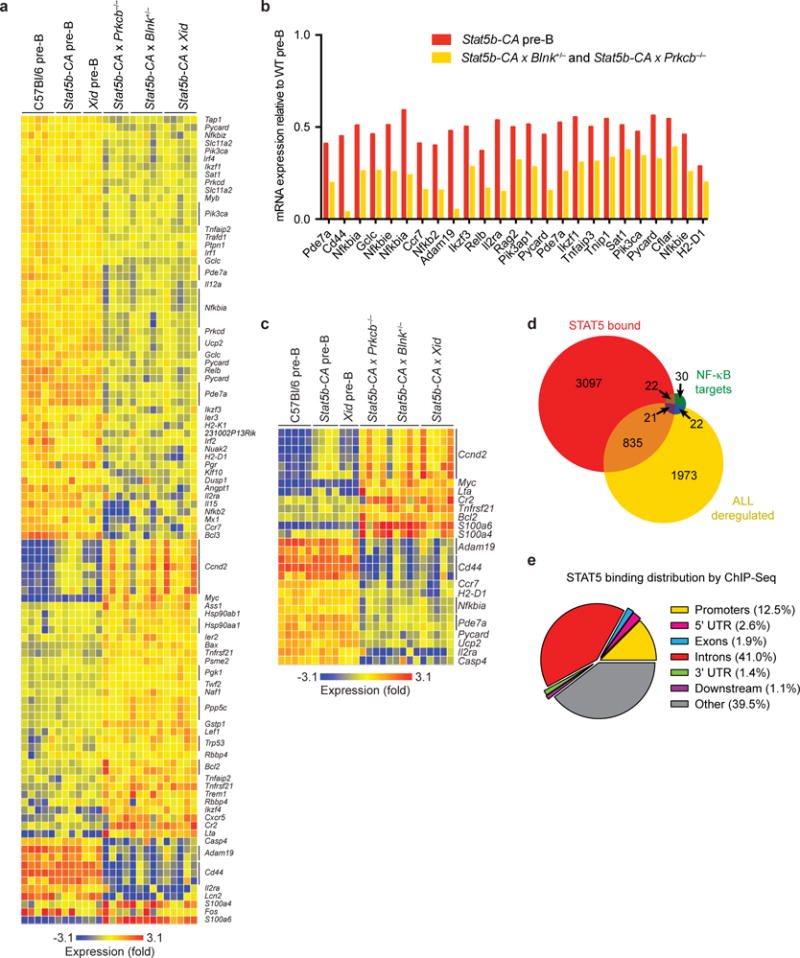
(a), NF-κB target genes deregulated in Stat5b-CA x Blnk+/− (n = 5 mice), Stat5b-CA x Xid (n = 5 mice), and Stat5b-CA x Prkcb−/− (n = 4 mice) leukemias by microarray analysis. Individual gene expression in B220+CD19+ cells from lymph nodes of leukemic mice was compared to B220+CD19+μH−CD43lo pre-B cells from wild-type (n = 5 samples pooled from 3–8 mice per sample), Stat5b-CA (n = 4 samples pooled from 3–8 mice per sample), and Xid (n = 3 samples pooled from 3–8 mice per sample) bone marrow by microarray. (b), Expression of NF-κB target genes by microarray analysis that are further downregulated in Stat5b-CA pre-B cells (n = 4 samples pooled from 3–8 mice per sample) relative to wild-type pre-B cells (n = 5 samples pooled from 3–8 mice per sample) and downregulated in Stat5b-CA x Blnk+/− (n = 5 mice) and Stat5b-CA x Prkcb−/− (n = 4 mice) leukemias compared Stat5b-CA pre-B cells. Expression is plotted relative to the expression in wild-type pre-B cells. (c), The expression of NF-κB target genes synergistically deregulated by Stat5b-CA and pre-BCR signaling defects. Genes identified in Figure 2a were used to calculate synergy scores (see Methods). Microarray heatmap represents mRNA expression of genes with synergy scores < 0.9. (d), Venn diagram illustrating overlap of STAT5-bound genes in Stat5b-CA x Blnk+/− leukemia with NF-κB gene targets and genes deregulated in Stat5b-CA x Blnk+/−, Stat5b-CA x Xid, and Stat5b-CA x Prkcb−/−leukemias. (e), Pie chart of STAT5 binding distribution relative to genes by ChIP-Seq in Stat5b-CA x Blnk+/− leukemia. Promoters defined as 5000 bp region upstream of TSS and downstream regions defined as 1000 bp region downstream of TTS. Bars indicate mean (b). Data are representative of one independent experiment (d,e).
Figure 3. NF-κB1 acts as a tumor suppressor to prevent STAT5b-CA-driven leukemia.
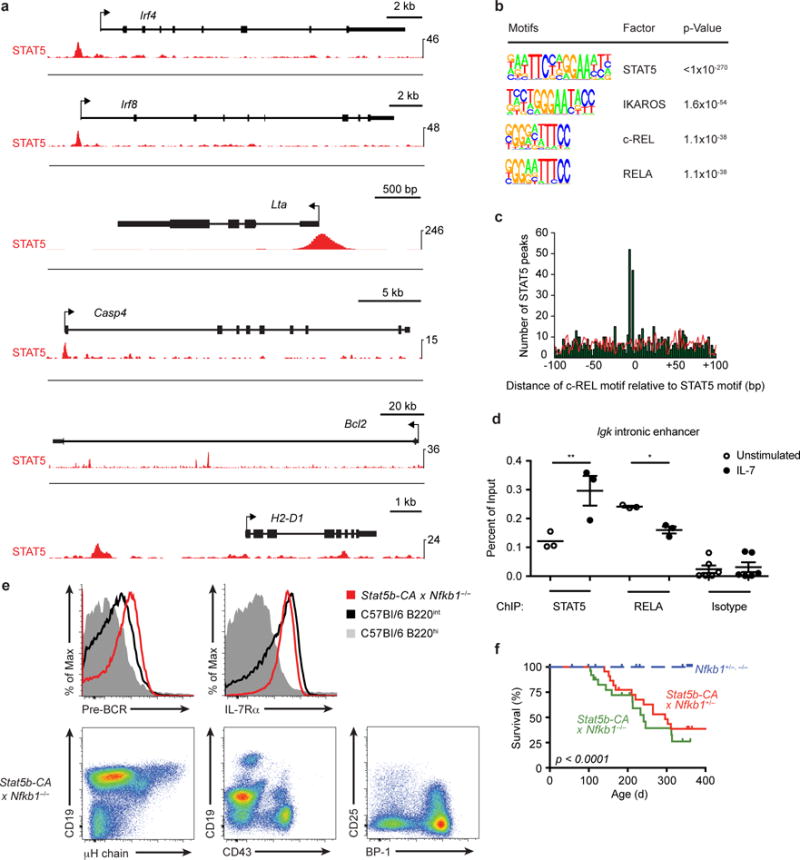
(a) STAT5 (red) occupancy in Stat5b-CA x Blnk+/− leukemias at the NF-κB target gene loci Irf4, Irf8, Lta, Casp4, Bcl2, and H2-D1 by ChIP-seq. (b) Transcription factor binding motifs enriched by STAT5 ChIP-Seq in Stat5b-CA x Blnk+/− leukemias. (c) Distribution of c-REL binding motifs relative to STAT5 binding sites found by STAT5 ChIP-Seq. (d) STAT5 and RELA ChIP-qPCR at Igk intronic enhancer in Stat5b-CA x Blnk+/− leukemias stimulated with or without IL7 at 37°C for 30 minutes. (e) Flow cytometric analysis of lymph nodes from leukemic Stat5b-CA x Nfkb1−/− mice (dot plot and red histogram) or bone marrow from wild-type mice (grey and black histograms). (f) Survival of Stat5b-CA x Nfkb1+/− (n = 23) and Stat5b-CA x Nfkb1−/− mice (n = 27) compared to littermate control mice (n = 27). Deaths are indicative of tumor development. Tick marks represent censored data points. P-value determined by log-rank Mantle-Cox test. *P < 0.05, **P < 0.01 (one-way ANOVA with Bonferroni’s Multiple Comparison post-test, d). Data are representative of one (a-c), three (d; mean ± SEM), or 6 independent experiments with a total of 6 mice per genotype (e).
As an alternative approach to identify direct gene targets of STAT5, we integrated our STAT5b-CA differential gene expression dataset from the Stat5CA x Blnk+/− leukemic cells compared to wild-type cells with our STAT5 ChIP-seq dataset using ChIP-BETA24. This analysis predicted 4198 direct regulatory targets of STAT5, including one third of the NF-κB target genes expressed in wild-type pre-B cells (Supplementary Fig. 2b, data not shown). Thus, STAT5 and NF-κB likely regulate many common target genes. To directly test if the interaction between STAT5 and NF-κB is important in leukemogenesis, we generated Stat5b-CA x Nfkb1+/− and Stat5b-CA x Nfkb1−/− mice; both crosses developed pre-B cell leukemia at high frequency (Fig. 3e,f). Taken together, these data suggest that STAT5 and NF-κB affect each other’s function at multiple target genes in progenitor B cells and directly demonstrate that NF-κB acts as a tumor suppressor in pre-B cells.
STAT5 activity opposes gene regulation by IKAROS
NF-κB induces expression of the transcription factor Ikzf1 by upregulating IRF4 and IRF8 (refs.25,26). IKZF1, which encodes IKAROS, is frequently deleted in human B-ALL and deletion correlates with poor prognosis27–29. IKAROS binding motifs were enriched near STAT5 binding sites in Stat5b-CA x Blnk+/− leukemias (Fig. 3b and Supplementary Table 1). Furthermore, comparison of our STAT5 ChIP-Seq dataset from Stat5b-CA x Blnk+/− leukemic cells with an IKAROS ChIP-Seq dataset from wild-type pre-B cells30 showed that 37% of genes bound by IKAROS are also bound by STAT5 (P <1.1 × 10⁻¹⁶); 53% of these genes (896) show direct binding overlap between IKAROS and STAT5 (P = 8.5 × 10⁻¹⁰) (Fig. 4a–c and Supplementary Fig. 2c). We found 249 genes were bound and regulated by IKAROS in wild-type pre-B cells and deregulated in the Stat5b-CA x Blnk+/−, Stat5b-CA x Xid and Stat5b-CA x Prkcb−/−leukemias (Fig. 4c). Of those 249 genes, 180 (72%) show opposing regulation by STAT5 and IKAROS (Supplementary Table 2). Similarly, Gene Set Enrichment Analysis (GSEA) revealed that genes activated by STAT5 are enriched in genes that are negatively regulated by IKAROS (Fig. 4d). Thus, STAT5 and IKAROS share hundreds of target genes and these transcription factors tend to reciprocally regulate expression of those shared target genes.
Figure 4. STAT5 antagonizes IKAROS and disrupts B cell super-enhancer networks.
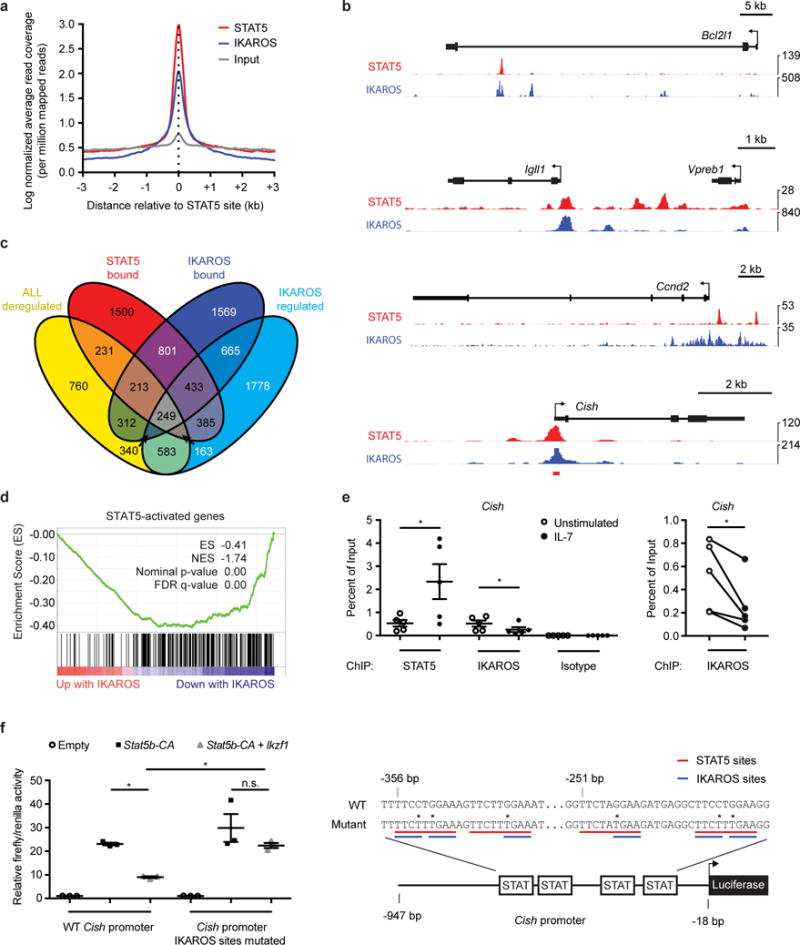
(a) Distribution of STAT5 and IKAROS peak summits relative to STAT5 binding sites by ChIP-Seq. (b) Occupancy of STAT5 and IKAROS by ChIP-Seq in Stat5b-CA x Blnk+/− leukemia and wild-type pre-B cells, respectively, at Bcl2l1, Igll1, Vpreb1, Ccnd2, and Cish. Red bar below Cish indicates location of ChIP-qPCR amplicon used in e. (c) Venn diagram of genes deregulated in Stat5b-CA x Blnk+/−, Stat5b-CA x Xid, and Stat5b-CA x Prkcb−/− leukemias compared to wild-type pre-B cells; genes bound by STAT5 in Stat5b-CA x Blnk+/− leukemias; genes bound by IKAROS in pre-B cells; genes regulated by IKAROS. (d) Gene Set Enrichment Analysis (GSEA) reveals that genes activated by STAT5 in the Stat5b-CA x Blnk+/− tumors are enriched for genes that are negatively regulated by IKAROS. (e) STAT5 and IKAROS ChIP-qPCR at Cish promoter in Stat5b-CA x Blnk+/− leukemias stimulated with or without IL7 at 37°C for 30 minutes. (f) Luciferase activity of wild-type or mutant Cish promoter in Ba/F3 progenitor B cells transfected with Stat5b-CA or Stat5b-CA and Ikzf1 retroviruses (left panel). Illustration of the Cish luciferase constructs (right panel). STAT5 binding sites are underlined in red while IKAROS binding sites are underlined in blue. Sites of mutation are indicated with asterisks. Base pair (bp) positions indicate distances relative to the Cish translational start codon. (e,f) Mean ± SEM. *P < 0.05 (two-tailed paired t-test, e). *P < 0.05, **P ≤ 0.001 (one-way ANOVA with Bonferroni’s Multiple Comparison post-test, f). Data are representative of five (e), three (f), or one (a-d, STAT5) or two (a-d, IKAROS) independent experiments. Data for IKAROS ChIP-Seq experiments in a-c came from ref.30).
One way that STAT5 and IKAROS may opposingly regulate target gene expression is via competing for binding to target loci. To explore this possibility, we performed ChIP-qPCR on the shared target Cish in Stat5b-CA x Blnk+/− leukemias with and without IL-7 stimulation. Cish was chosen because it is a well-characterized gene target of STAT5 (ref.31) and has been shown to be negatively regulated by IKAROS30. IL-7 led to an increase in STAT5 binding (~4-fold) and a decrease in IKAROS binding (~2-fold) to the Cish promoter (Fig. 4e). To study this in further detail, we cloned the Cish promoter into a luciferase reporter construct. Overexpression of STAT5b-CA induced luciferase activity in the progenitor B cell line, Ba/F3, while co-expression of STAT5b-CA and IKAROS reduced this effect. Repression by IKAROS was alleviated when we mutated the IKAROS binding sites that overlap with STAT5 binding sites within the Cish promoter (Fig. 4f). Using a similar luciferase assay approach, we observed identical results for Socs2, another gene with overlapping STAT5 and IKAROS binding sites (Supplementary Fig. 2d). Thus, STAT5 and IKAROS can antagonize each other via direct competition for overlapping binding sites.
STAT5 and IKAROS may also opposingly regulate shared targets via other mechanisms. One such example occurs at the Myc locus, which is controlled by a distal super-enhancer located 1.7 Mb downstream of Myc32. ChIP-Seq analysis revealed that STAT5 and IKAROS bind at several sites within this Myc super-enhancer (Fig. 5a). One way that STAT5 activates target gene transcription is by recruiting the histone acetyltransferase p300 and promoting H3K27 acetylation (H3K27Ac)33. We found that IL-7 stimulation increased STAT5, p300, and H3K27Ac abundance at the Myc super-enhancer in Stat5b-CA x Blnk+/− leukemias (~5-fold, 3-fold, and 2.5-fold respectively) (Fig. 5b). Similar results were observed upon ectopic expression of STAT5b-CA in Ba/F3 progenitor B cells – H3K27Ac marks increased 2.2-fold (P < 0.0001) and Myc expression was increased by 38% (Fig. 5c and data not shown). STAT5 regulated the Pim1 and Bcl2l1 loci in a similar manner (Supplementary Fig. 2e,f). IL-7 stimulation had no effect on IKAROS binding at the Myc super-enhancer, suggesting that STAT5 and IKAROS bind to non-overlapping sites at this locus (Supplementary Fig. 2a). IKAROS can repress gene expression by recruiting the nucleosome remodeling and deacetylation complex (NuRD)34, which promotes deacetylation of H3K27. Overexpression of Ikzf1 in Ba/F3 cells led to an ~2-fold decrease in the active histone mark H3K27Ac at the Myc super-enhancer and a corresponding 2-fold decrease in Myc expression (Fig. 5d,e). Therefore, STAT5 and IKAROS regulate the Myc super-enhancer by opposingly regulating histone acetylation.
Figure 5. STAT5 binds to several progenitor B cell super-enhancers and opposes regulation of the Myc locus by IKAROS.
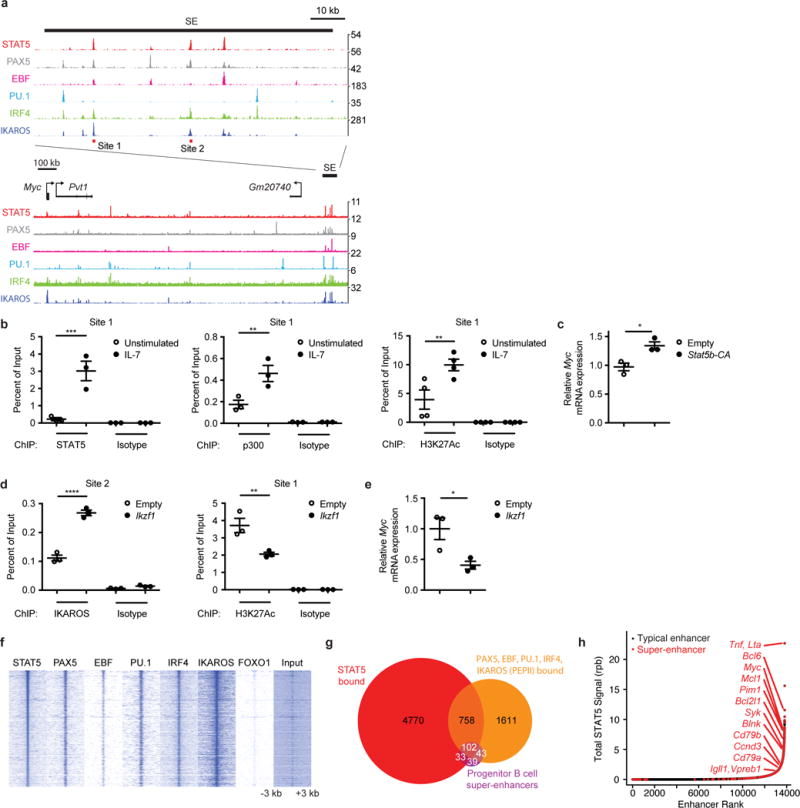
(a) Occupancy of STAT5, PAX5, EBF, PU.1, IRF4 and IKAROS by ChIP-Seq at Myc locus in Stat5b-CA x Blnk+/− leukemia (STAT5), Rag−/− pro-B cells (PAX5, EBF, PU.1, IRF4) or wild-type pre-B cells (IKAROS); SE = super-enhancer. Red bars indicate the locations (sites 1 and 2) of two ChIP-qPCR amplicons used in b and d. (b) STAT5 (left panel), p300 (middle panel), and H3K27Ac (right panel) ChIP-qPCR at Myc super-enhancer site 1 in Stat5b-CA x Blnk+/− leukemias stimulated with or without IL7 at 37°C for 30 minutes. (c) Myc qRT-PCR in Ba/F3 cells transduced with empty or Stat5b-CA retroviruses. (d) IKAROS (left panel) and H3K27Ac (right panel) ChIP-qPCR at Myc super-enhancer in Ba/F3 cells transduced with empty or Ikzf1 retroviruses. (e) Myc qRT-PCR in Ba/F3 cells transduced with empty or Ikzf1 retroviruses. (f) Heat map of STAT5, PAX5, EBF, PU.1, IRF4, IKAROS and FOXO1 occupancy centered on STAT5 binding sites at STAT5-bound loci by ChIP-Seq. (g) Venn-diagram illustrating the peak-level overlap of STAT5, 4 or more of PAX5, EBF, PU.1, IRF4, and IKAROS (PEPII), and progenitor B cell super-enhancers. (h) STAT5 ChIP-Seq signal in reads-per-billion (rpb) at progenitor B cell typical enhancers and super-enhancers. (b-e) Mean ± SEM. *P < 0.05 (two-tailed unpaired t-test, c, e). **P < 0.01, ***P < 0.001, ****P < 0.0001 (one-way ANOVA with Bonferroni’s Multiple Comparison post-test, b,d). Data are representative of one (a,f-h, STAT5, PAX5, EBF, PU.1, IRF4, FOXO1), two (a,f,g, IKAROS), or three (b-e) independent experiments. Data for PEPII ChIP-Seq experiments in a,f,g came from30,36–38. Defined super-enhancers in a,g,h came from39.
We next tested whether constitutively active STAT5 can cooperate with loss of function mutations in Ikzf1 to drive B-ALL. The resulting Stat5b-CA x Ikzf1+/− mice developed leukemia but only T-ALL (data not shown). This result is most likely because the Stat5b-CA transgene is also highly expressed in developing T cells. To circumvent this issue, we used a sleeping beauty (SB) transposon mutagenesis screen to identify genes that cooperate with Stat5b-CA to initiate B-ALL. This strategy resulted in highly penetrant B cell leukemia. Importantly, Ikzf1 was targeted by the Sleeping Beauty transposon in 15% of the leukemias in this screen. The orientation and location of the transposon insertions within the Ikzf1 locus are predicted to cause loss of function mutations; consistent with this prediction Ikzf1 expression was reduced in SB-driven leukemias compared to wild-type pre-B cells35. These data provide evidence that STAT5 activation and loss of function mutations in Ikzf1 cooperate to initiate both T-ALL and B-ALL.
STAT5 binding overlaps with B cell super-enhancers
IKAROS forms a transcriptional network with PAX5, EBF1, PU.1, and IRF4 (referred to as PEPII factors) that regulates B cell differentiation. Binding motifs for PEPII factors were significantly enriched near STAT5 binding sites identified in Stat5b-CA x Blnk+/− leukemias (Supplementary Table 1). Comparison of PEPII30,36–38 and STAT5 ChIP-Seq datasets demonstrated a substantial enrichment of PAX5, EBF1, PU.1, IRF4 and IKAROS at STAT5-bound loci (3.8-, 5.3-, 1.9-, 3.1-, and 1.7-fold enrichment, respectively; p<0.001) (Fig. 5a,f,g and Supplementary Table 3). In contrast, the transcription factor FOXO1 did not overlap significantly with STAT5 binding (Fig. 5f). Thus, STAT5 binding directly overlaps with binding sites for many but not all transcription factors that promote B cell differentiation.
Recent studies have identified a class of enhancers, termed super-enhancers, as key regulators of cell identity and transformation39–41. Consistent with the key role of the PEPII network in B cell development and transformation, 67% of defined progenitor B cell super-enhancers39 are bound by 4 or more members of this network. Importantly, 70% of those sites are also bound by STAT5 in leukemia (Fig. 5g). We next identified enhancers with the highest content of STAT5 binding by ranking progenitor B cell enhancers based on the amount of STAT5 bound at each enhancer in Stat5b-CA x Blnk+/− leukemias. We found that 207 of the 395 previously identified super-enhancers also scored as super-enhancers when the regions were re-scored using STAT5 abundance to define super-enhancer regions (hypergeometric test, P = 4.3 × 10−157) (Fig. 5h). Thus, STAT5 binding correlates with super-enhancer identity in progenitor B cells. Importantly, PEPII factors and STAT5 binding were enriched at super-enhancers linked to genes regulating survival, cell cycle, and B cell differentiation (Fig. 5g and Supplementary Table 4). We confirmed that STAT5, PAX5, EBF, and IKAROS all bind at the Myc, Bcl2l1, and Igll1 super-enhancers in the Stat5b-CA x Blnk+/− leukemias by ChIP-qPCR (Supplementary Fig. 2g). Moreover, expression of STAT5b-CA led to an increase of H3K27Ac at the Myc and Bcl2l1 super-enhancers – suggesting that STAT5 binds to and promotes acetylation of multiple super-enhancers in progenitor B cells (Supplementary Fig 2f and data not shown). Finally, genes encoding master transcription factors are themselves driven by super-enhancers in other cell types, forming feedback loops in which the key transcription factors regulate their own expression39. Consistent with other super-enhancer networks, STAT5 and PEPII factors bound to enhancers located within the genes that encoded STAT5 and PEPII or their functional regulators (i.e., Il7r, Jak1, Socs3) and thus might cross-regulate each other (Supplementary Fig. 3a,b). These data demonstrate that STAT5 participates in a regulatory B cell transcriptional network at progenitor B cell super-enhancers, and demonstrate that high intensities of STAT5 binding to these super-enhancers is a defining feature of B-ALL.
To determine whether our findings in murine B-ALL models are recapitulated in human disease, we examined STAT5, NF-κB and IKAROS ChIP-Seq datasets in a human B lymphoblastoid cell line. We found that 41% and 33% of STAT5 binding sites in a human B lymphoblastoid cell line overlap with IKAROS or NF-κB binding sites, respectively (P < 0.0001) (Fig. 6a,b). In addition, high intensities of STAT5 binding identified a similar network of super-enhancer linked genes associated with survival, proliferation, and B cell differentiation (Fig. 6c and Supplementary Table 5). Moreover, in two primary human BCR-ABL+ leukemia samples, we found enrichment of STAT5 binding motifs near IKAROS binding sites identified by ChIP-Seq (Fig. 6d). Thus, STAT5 binding overlaps with NF-κB and IKAROS in transformed human B cells, with high intensities of STAT5 bound to a similar network of super-enhancers in mouse and human B cell malignancies.
Figure 6. STAT5 binding overlaps with NF-κB and IKAROS and correlates with super-enhancer function in human B lymphoblastoid cells.
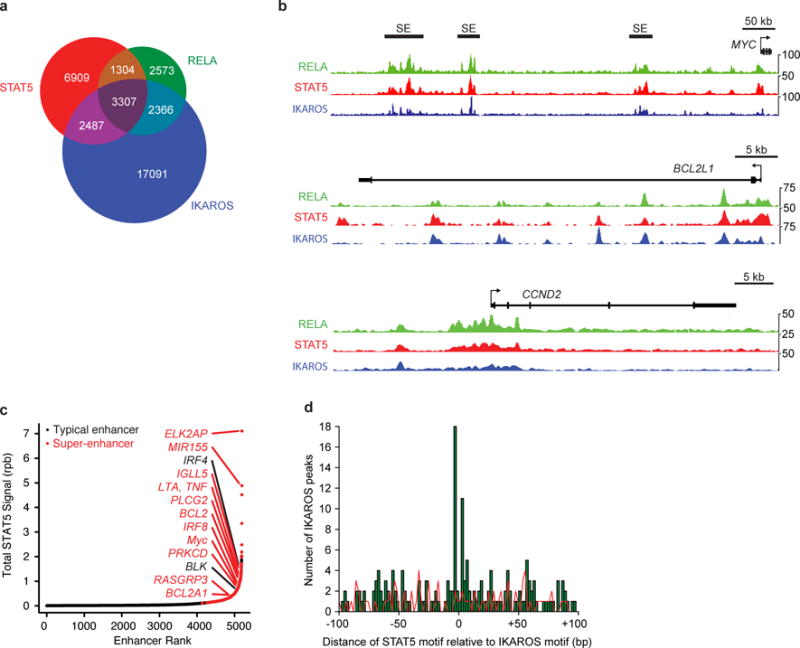
A, Venn diagram showing overlap between STAT5, RELA and IKAROS binding sites in GM12878 cell line. B, Occupancy of STAT5, RELA, and IKAROS at BCL2L1, CCND2 and MYC loci in GM12878 cell line. C, STAT5 ChIP-Seq signal in reads-per-billion at GM12878 cell line typical enhancers and super-enhancers. D, Distribution of STAT5 binding motifs relative to IKAROS binding sites found by IKAROS ChIP-Seq in ICN1 and LAX2 primary B-ALL samples. Data are representative of 2 independent experiments (a–d).
STAT5 to IKAROS or NF-κB ratios correlate with survival
Previous studies have linked STAT5 activation, or deletions in IKZF1, to poor patient outcomes16,28,29. However, the mechanism that accounts for these separate observations, and whether NF-κB is involved, is unclear. To address these questions, we examined whether the balance of active STAT5 (pSTAT5) to IKZF1 correlated with remission duration or overall survival in 64 B-ALL patient samples (Supplementary Table 6). Patient samples were subdivided into three groups: (1) low pSTAT5 and wild-type IKZF1 (two good indicators), (2) low pSTAT5 and deleted IKZF1 (ΔIKZF1) or high pSTAT5 and wild-type IKZF1 (one bad indicator) and (3) high pSTAT5 and deleted IKZF1 (2 bad indicators). There was a significant decrease in remission duration and patient survival as the number of bad prognostic indicators increased (Fig. 7a and Supplementary Fig. 4). In contrast, IKZF1 or pSTAT5 status alone was less effective at predicting survival or remission duration (Supplementary Fig. 4). One concern with our analysis is that BCR-ABL translocations were enriched in the higher-risk groups, and thus may have accounted for poorer outcomes observed in these groups. However, similar results were seen when we focused on just one BCR-ABL negative subset of B-ALL (B-NOS), thereby eliminating concerns about inherent differences in survival between different subsets of B-ALL (Supplementary Fig. 5). Thus, the ratio of pSTAT5 to IKAROS negatively correlates with patient survival and remission duration.
Figure 7. STAT5 activation paired with loss of IKZF1 or NF-κB correlates with survival in B-ALL patients.
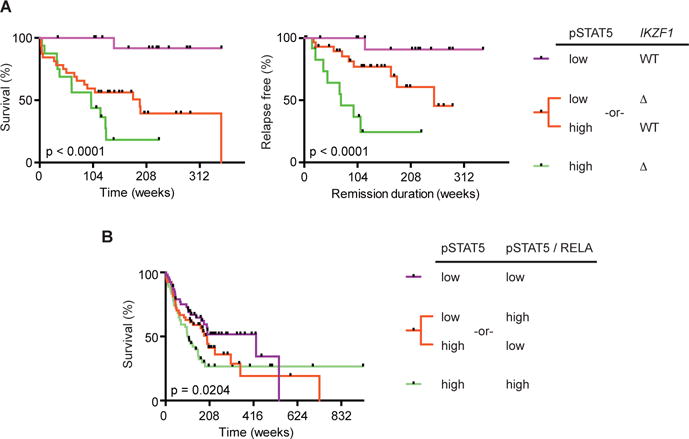
A, Survival (left panel) and remission duration (right panel) in B-ALL patients stratified by pSTAT5 and IKZF1 status (n = 64). B, Survival in B-ALL patients stratified by pSTAT5 and the ratio of pSTAT5 to RELA (n = 161). P-values determined by log-rank test for trend of medians (a,b). Tick marks represent censored data points.
We also examined if the relationship between pSTAT5 and the NF-κB subunit RELA correlated with survival in 161 B-ALL patients (Supplementary Table 7). Patient samples were split into three groups based on total pSTAT5 abundance and the ratio between pSTAT5 and RELA: (1) low total pSTAT5 and low pSTAT5/RELA (two good indicators), (2) low total pSTAT5 and high pSTAT5/RELA or high overall pSTAT5 and low pSTAT5/RELA (one bad indicator) and (3) high overall pSTAT5 and high pSTAT5/RELA (two bad indicators). The combination of high pSTAT5 with a high ratio of pSTAT5 to RELA correlated most strongly with decreased survival (Fig. 7b and Supplementary Fig. 6). In contrast, pSTAT5 or pSTAT5/RELA levels alone did not effectively correlate with overall patient survival (Supplementary Fig. 6). We obtained similar results after excluding BCR-ABL cases by just focusing on B-NOS patients (Supplementary Fig. 7). Moreover, in the B-NOS patient samples we also observed a significant difference for remission duration based on both the combination of pSTAT5 abundance and the pSTAT5/RELA ratio or just the pSTAT5/RELA ratio alone (Supplementary Fig. 7). Thus, the ratio of pSTAT5 to RELA correlated with patient outcome.
Discussion
Our studies of B-ALL identify a linear tumor suppressor pathway downstream of the pre-BCR involving BLNK, BTK, PKCβ, NF-κB1, and IKAROS. These findings were particularly intriguing as NF-κB family members were initially identified as oncogenes in other cancers – not tumor suppressors42. Constitutively active NF-κB has been reported in some B cell malignancies43,44. In contrast, we demonstrate that for progenitor B cell leukemia, NF-κB1 acts functionally as a tumor suppressor gene in murine pre-B cell leukemia. Consistent with this observation, we observed that the ratio between pSTAT5 and the NF-κB family member RELA in human progenitor B cell leukemias correlated with patient survival and disease remission. In part, this observation reflects direct competition between STAT5 and NF-κB for common binding sites. However, competition between STAT5 and NF-κB was not observed at all overlapping STAT5 and NF-κB binding sites. Specifically, we observed clear antagonism at the Igk locus, a gene involved in pre-B cell differentiation, but enhanced binding at the Myc super-enhancer, a gene involved in pre-B cell proliferation and growth. While this is a limited sample size, it may be indicative of a broader phenomenon. STAT5 may antagonize NF-κB binding at NF-κB target genes involved in B cell differentiation, while STAT5 may enhance NF-κB binding at genes involved in proliferation. In this model, reduced NF-κB expression would allow for more effective STAT5-dependent inhibition of pre-B cell differentiation. In parallel, STAT5 activation would compensate for the effects of reduced NF-κB on NF-κB gene targets involved in cell proliferation.
Our studies also demonstrate that STAT5 plays a much broader role in B cell development and transformation than previously suspected. Previous studies demonstrated that STAT5 provides important survival signals to progenitor B cells11,12. In addition, STAT5 regulates a number of genes involved in cell growth and proliferation including Ccnd2, Ccnd3 and Myc. However, besides regulating genes that promote survival and proliferation, STAT5 also bound to a large subset of genes that regulate normal progenitor B cell development. These include genes encoding components of the pre-BCR pathway including those for the pre-BCR (λ5 and VpreB1), the associated signaling chain Igα, the upstream kinases SYK and BLK, the adaptors BLNK and CARMA1 (which plays a key role in activating NF-κB downstream of the pre-BCR), and the downstream transcription factors IRF4, IRF8, IKAROS and AIOLOS. These results suggest that STAT5 not only plays a key role during progenitor B cell transformation, but likely plays an important role during normal B cell development to ensure sufficient expansion of progenitor B cells and to prevent premature B cell differentiation.
In addition to interactions with NF-κB, we found substantial overlap in STAT5 binding to previously identified IKAROS binding sites in pre-B cells. In the majority of cases (72%), these involved genes that were regulated in one direction by IKAROS and in the opposite direction in our STAT5b-CA driven leukemias. We provide evidence for at least two mechanisms that could explain these results. First, STAT5 and IKAROS directly compete for overlapping binding sites at some target genes. Second, at other sites, such as the Myc super-enhancer, STAT5 increased H3K27 acetylation and expression of Myc. In contrast, IKAROS binding appears to reverse H3K27 acetylation at the Myc locus and repressed Myc expression. These results are consistent with a previous report that found that histone deacetylases reversed both STAT5-dependent recruitment of the bromodomain protein BRD2 to the Myc super-enhancer and STAT5-dependent Myc transcription45. Thus, competition between STAT5-dependent histone acetylation and IKAROS-dependent histone deacetylation of the Myc super-enhancer likely plays an important role in pre-B cell transformation. Other mechanisms could exist as well. For example, STAT5 bound to genes encoding PAX5, EBF1, PU.1, IRF4 and IKAROS (PEPII). Likewise, these PEPII factors bound to genes involved in the STAT5 signaling pathways including Il7r, Jak1, Stat5b, and Socs3. This suggests that STAT5 and the PEPII factors might cross-regulate one another, thus forming another level of regulation.
The interaction between STAT5 and IKAROS has important functional consequences for patients with B-ALL. Consistent with previous studies16,28,29 we found that both the level of STAT5 phosphorylation and IKZF1 deletion status correlated with patient survival and remission duration (hazard ratio for overall survival of 2.2- and 2.5-fold, respectively). In contrast, splitting patients into distinct hazard groups based on both IKZF1 deletion status and STAT5 activation was substantially more effective (hazard ratio of 20-fold for overall survival). Qualitatively similar results were seen when comparing the ratio between pSTAT5 and RELA, although the magnitude of the difference was smaller. This may be due to the fact that multiple NF-κB family members including c-REL and NF-κB1 are involved in pre-BCR signaling and that the strongest predictive power will only come when considering all relevant NF-κB family members. This might also explain why Stat5b-CA x Nfkb1+/− leukemias were not as penetrant as the Stat5b-CA x Blnk+/− leukemias. Another explanation could be that N-FκB may have both tumor suppressor and oncogenic roles in progenitor B cells via its regulation of B cell differentiation and proliferation, respectively. Importantly, the magnitude of the imbalance between the STAT5 and NF-κB–IKAROS pathways correlates powerfully with disease outcome. Thus, future work taking this observation into account should allow for the development of clinical tests that better stratify patients into high and low risk groups.
In summary, our studies suggest a model (Supplementary Fig. 8) in which the balance between STAT5 and a specific transcription factor network at super-enhancers acts as a molecular switch to govern appropriate progenitor B cell proliferation, survival and differentiation. Altering the balance between these two antagonistic pathways drives B cell transformation, while the degree of imbalance underlies how patients with B-ALL will respond to therapy. Our findings suggest that strategies aimed at modestly altering this balance, involving submaximal STAT5 inhibition paired with modest NF-κB agonism or IKAROS induction could effectively inhibit B-ALL with minimal effects on other STAT5- and NF-κB–IKAROS-dependent processes.
Accession Codes
Microarray and ChIP-Seq data has been deposited at the GEO database. The accession numbers are GSE25643 (for Stat5b-CA x Blnk+/−, Stat5b-CA x Xid and Stat5b-CA x Prkcb−/− microarray data), GSE86878 (for the Stat5b-CA x Blnk+/− ChIP-Seq data), and GSE58825 (for the IKAROS ChIP-Seq dataset from human primary B-ALL samples).
Data Availability Statement
The data that support the findings of this study are available from the corresponding author upon request.
Online Methods
Mice
Stat5b-CA, Blnk+/−, Prkcb−/−, Xid, Nfkb1−/−, and Bcl2l1 transgenic mice have been described previously17,20,46–48. All mice were backcrossed to the C57BL/6 background with the exception of Prkcb−/−. Mice were housed in specific pathogen-free facilities at the University of Minnesota; all animal experiments were approved by the University of Minnesota Institutional Animal Care and Use Committee. All Stat5b-CA x Blnk+/−, Stat5b-CA x Xid and Stat5b-CA x Prkcb−/− leukemias were confirmed by flow cytometry to be B-ALL. 50% of the Stat5b-CA x Nfkb1+/− and Stat5b-CA x Nfkb1−/− leukemias were B-ALL and the other 50% were T-ALL. Spleen, lymph nodes, and bone marrow were isolated from leukemic mice and used for further experiments. B220+CD19+ lymph node cells were isolated using magnetic bead separation (Miltenyi Biotech) and used to isolate RNA and DNA. Purity of B lymphocytes was > 95% as assessed by flow cytometry. Kaplan-Meier survival curves were created using Prism software (GraphPad Software). No blinding was done to allocate mice into experimental groups.
Cell lines
Ba/F3 were purchased from Leibniz-Institut DSMZ-Deutsche Sammlung von Mikroorganismen und Zelkulturn GmbH. We authenticated the Ba/F3 cells by demonstrating that these cells remain cytokine responsive and express cell surface markers by flow cytometry that match published data by Leibniz-Institut DSMZ. These cells were not tested for mycoplasma.
Flow cytometry
Single-cell suspensions were stained with fluorescent antibodies. For BrdU analysis, mice were injected intraperitoneally with 200 μl of 10 mg/ml BrdU (BD Pharmingen) and analyzed after 16 h Cells were assayed on a LSRII or Fortessa flow cytometer (BD Biosciences) and data was analyzed using FlowJo software (Treestar).
Quantitative real-time PCR
RNA was isolated from the cells using an RNeasy kit (Qiagen). cDNA was synthesized from 2 ng of RNA using a qScript cDNA synthesis kit (Quanta Biosciences). Real-time PCR was performed using FastStart Universal SYBR Green Master (Roche). Reactions were run on a 7000 Sequence Detection PCR System (Applied Biosystems). Amplification conditions were: 50 °C for 2 min; 95 °C for 10 min; 40 cycles of 95 °C for 15 s and 58 °C for 60 s. Normalized values were calculated as previously described49. Primers used are listed in supplementary table 8.
Chromatin immunoprecipitation (ChIP) assays
STAT5b-CA x Blnk+/− tumor lymph node single cell suspensions were stimulated with 10 ng/mL IL-7 at 37 °C for 30 min (ChIP-Seq). Cells were immediately fixed in 1% formaldehyde for 10 min at 23 °C. Formaldehyde was quenched with 50 mM glycine. Cells were washed twice with PBS and resuspended in 0.5% SDS, 5.6 mM EDTA, 33.4 mM Tris pH8, 84 mM NaCl. DNA was sonicated to 200 bp fragments. 1–8 × 10⁶ (ChIP-qPCR) or 50 × 106 cell (ChIP-Seq) samples were immunoprecipitated overnight with 4–10 μg (ChIP-qPCR) or 50 μg (ChIP-Seq) of α-STAT5 (sc-835 x, Santa Cruz Biotechnology), IKAROS (sc-13039 x, Santa Cruz Biotechnology), PAX5 (sc-1974, Santa Cruz Biotechnology), EBF1 (ABE1294, EMD Millipore), RELA (sc-372 x, Santa Cruz Biotechnology), p300 (sc-585 x, Santa Cruz Biotechnology), H3K27Ac (ab4729, Abcam), or isotype control antibody (sc-2027 x, Santa Cruz Biotechnology) and salmon sperm DNA blocked protein A agarose bead slurry (EMD Millipore). Beads were washed twice with each of low salt, high salt, and LiCl2 buffers then three times with Tris-EDTA pH8 buffer. DNA was eluted with 1% SDS, 0.1 M NaHCO3. NaCl was added to 0.6 M final and crosslinks were reversed at 65 °C overnight. Tris, pH 8, was added to 40 mM final and EDTA, pH 8, to 8.8 mM final. Samples were digested with 0.1 mg/ml Proteinase K for 1 h. DNA was purified with QIAquick PCR purification kit (Qiagen). Replicate IKAROS ChIP-seq datasets were produced using cultures of ~ 5 × 10⁷ GM12878 cells cultured on separate days, essentially as described50.
Library Preparation
ChIP-seq libraries were prepared using the Illumina TruSeq ChIP sample kit according to the manufacturer’s instructions with the following deviations. Adaptors were ligated to the sample DNA and libraries were PCR amplified prior to size-selection.
Retroviral transduction
pMIGR retroviral plasmids containing either nothing, Ikzf1, or Stat5b-CA cDNAs were transfected into 293 T cells along with helper viruses using Effectene (Qiagen). Supernatants were harvested 24–48 h later and used to transduce Ba/F3 pro-B cells (ATCC) in the presence of 20% WeHi 3B cell supernatant as previously described51.
Luciferase assays
Ba/F3 cells were transfected with a wild-type or mutated Cish promoter pGL4.10, pRL-TK (Promega), and empty, Stat5b-CA, or Stat5b-CA + Ikzf1 pMIGR constructs by electroporation (240 volts, 25 milliseconds). Relative light units were measured 48 h post-transfection using Dual-Luciferase Reporter Assay System (Promega).
Reverse phase proteomics
This study used samples collected from the blood and/or bone marrow of adult ALL patients taken at diagnosis (Supplementary Tables 6,7). Samples were collected for the Leukemia Sample Bank at the University of Texas M.D. Anderson Cancer Center between 1992 and 2007. These samples were collected on institutional review board (IRB)–approved protocol Lab01-473, and consent was obtained in accordance with the Declaration of Helsinki. Samples were analyzed under an IRB-approved laboratory protocol (Lab05-0654). These samples were analyzed using reverse phase protein arrays, as previously described52.
IKZF1 deletion detection
IKZF1 deletions in human leukemia samples were detected using the SALSA P335 ALL-IKZF1 Multiplex Ligation-dependent Probe Amplification (MLPA) assay (MRC-Holland) according to manufacturer’s instructions.
Flow cytometry antibodies
The following antibodies were used for flow cytometry: α-μH chain (Jackson ImmunoResearch), α-CD19 (1D3), α-CD45R (RA3-6B2), α-CD127 (A7R34), α-pre-BCR (SL165, BD Pharmingen), α-Igκ (187.1, SouthernBiotech), α-Igλ (JC5-1, SouthernBiotech). α-CD43 (S7, BD Pharmingen), BP-1 (FG35.4), CD25 (PC61.5), α-Gr-1 (RB6-8C5), and α-Ter119 (TER-119). All antibodies were obtained from eBioscience unless otherwise indicated. SA-PerCP-Cy5.5 was used to detect biotinylated antibodies.
Microarray
Microarray analysis was performed on total RNA extracted from either bone marrow cells depleted of CD11b, Ter119, DX5, CD3e, GR-1, and μH using magnetic beads and then sorted B220+CD19+μHloCD43lo pre-B cells (C57BL/6, Stat5b-CA, or Xid) or B220+CD19+ leukemic cells from lymph nodes of tumor-bearing mice using an RNeasy kit (Qiagen). Control pre-B cells were harvested from mice aged 7–12 weeks old. Stat5b-CA leukemia samples were harvested from mice aged 13–48 weeks old, Stat5b-CA x Blnk+/− leukemias were harvested from mice aged 9–13 weeks old, Stat5b-CA x Xid leukemias were harvested from mice aged 12–21 weeks old, and Stat5b-CA x Prkcb−/− leukemias were harvested from mice aged 11–17 weeks old. cRNA probes were synthesized and hybridized to Mouse 430 2.0 arrays following Affymetrix protocols and statistical analyses were performed using GeneSpringGX 11.0 (Agilen t). Samples were normalized using RMA, filtered on expression (20.0–100.0th) percentile, or Affymetrix Microarray Suite 5.0 (MAS5.0) software. Significant gene lists were generated using one-way ANOVA with a corrected P-value < 0.05 with a 1.5 fold change in gene expression. Clustering was performed using hierarchical clustering on both entities and conditions, using Euclidean distance metric and Centroid Linkage rule. Synergy scores were calculated as described previously23. Briefly, the Land algorithm predicts genes that are synergistically regulated by cooperating gene mutations. Specifically, we compared Affymetrix microarray expression data from wild-type pre-B cells with Stat5b-CA pre-B, Xid pre-B, or the Stat5b-CA x Blnk+/−, Stat5b-CA x Xid, and Stat5b-CA x Prkcb−/− leukemias. We then identified genes that were differentially regulated between Stat5b-CA or Xid and wild-type cells. The Land algorithm then identifies genes that respond synergistically to the combination of STAT5b-CA and loss of pre-BCR signaling. Expression values for each probe were averaged across sample groups. Synergy between Stat5b-CA and Xid was calculated as follows: for any probe, let a represent the average Stat5b-CA pre-B value, let b represent the average Xid pre-B value and let c represent the average leukemia value. Values for each probe were entered into the formula [(c/a)+(c/b)] for downregulated genes or [(a+b)/c] for upregulated genes. Synergy scores < 0.9 identified cooperation response genes.
To determine NF-κB target genes that are deregulated in mouse pre-B cell leukemias, a list of NF-κB target genes was obtained from www.Nf-kb.org. Genes were identified as differentially regulated if they had an absolute fold change >1.5, absolute difference >200, and p value <0.05 when compared to controls.
Luciferase constructs
Forward (5′-ATTAGCTAGCCTGTCTGGGAGCTGACTATCT-3′) and reverse (5′-ATTAAAGCTTGGCTCGAGAGTCGGAGTT-3′) primers were used to amplify a 930 bp amplicon of the Cish promoter. The resulting product was then digested with NheI and HindIII (New England Biolabs) and ligated to pGL4.10 (Promega). Two consecutive rounds of site-directed mutagenesis (round 1: 5′- CTCCCGCCCAGTTTTCTTTGAAAGTTCTTTGAAATCTGTCAAAGG-3′ and 5′- CCTTTGACAGATTTCAAAGAACTTTCAAAGAAAACTGGGCGGGAG-3′; round 2: 5′- CGCGGTTCTATGAAGATGAGGCTTCTTTGAAGGGCTGGGACGCAG-3′ and 5′- CTGCGTCCCAGCCCTTCAAAGAAGCCTCATCTTCATAGAACCGCG-3′) on the Cish pGL4.10 construct were used to generate the Cish pGL4.10 with the IKAROS sites mutated. In order to clone the Socs2 promoter, forward (5′- AGAGGCATCCTTCCCATCAAAG-3′) and reverse (5′- GGAGGAAAGGCTCATGCTTCA-3′) primers were used to amplify a 1602 bp product. The resulting amplicon was then used as template along with forward (5′- ATTAGAGCTCCAGGAAAACAGCCTCCCCCCTCCGCG-3′) and reverse (5′- ATTACTCGAGCCGCCTCCCGCCCCTCGC-3′) primers to generate a 1456 bp product. The resulting product was then digested with SacI and XhoI (New England Biolabs) and ligated to pGL4.10. Site-directed mutagenesis (5′- GCGGTCACGTGAGGCGGATTCTTTGAAAGTTCTTTGAAAGCGGCCTCCGCCGC-3′ and 5′- GCGGCGGAGGCCGCTTTCAAAGAACTTTCAAAGAATCCGCCTCACGTGACCGC-3′) on the Socs2 pGL4.10 construct were used to generate the Socs2 pGL4.10 with the IKAROS sites mutated.
Supplementary Material
Acknowledgments
We thank A. Vegoe, R. Agneberg, J. Bednar, C. Anderson, P. Schoettler, L. Swanson, A. Kne, C. Reis, A. Mack and E. Sykes for assistance with mouse breeding; M. Mandal for advice on ChIP-Seq, P. Champoux and N. Shah for cell sorting; the University of Minnesota’s Supercomputing Institute for computing resources; R. Woodland (University of Massachusetts medical School) for providing Xid mice on a C57BL/6 background, S. van Reijmersdal for MLPA analysis support, and L. Manlove and J. Fiege for help and discussion. S.F. and H.S. are supported by NIH grant R21CA209229. This work was also supported by a Cancer Research Institute Investigator Award, a Leukemia and Lymphoma Society Scholar Award, and grants from the NIH to M.A.F. (CA154998, CA151845 and CA185062) and to M.M. (R01CA137060, R01CA139032, R01CA157644, R01CA169458, and R01CA172558), a translational research grant from the Leukemia and Lymphoma Society, and a Leukemia Spore grant (P50 PA100632) to S.M.K. R.P.K, B.S. and F.N.vL. were supported by KiKa grant (KIKA-55). C.D.S.K. and M.J.L.W. were supported by an NIH training grant (T32-AI07313); L.B.R. was supported by a University of Minnesota doctoral dissertation fellowship.
Footnotes
AUTHOR CONTRIBUTIONS
C.D.S.K., L.M.H.-H. and M.J.L.W. designed and performed experiments, and analyzed data; L.B.R. set up and ran microarray experiments; G.H. assisted with analysis of murine leukemias, C.M.H., S.F., R.Y. and K.A.T.S. analyzed murine ChIP-Seq datasets; S.F., H.S. and M.M. generated human IKAROS ChIP-Seq data and with C.M.H. analyzed STAT5/IKAROS/NF-κB overlap in human lymphoblastoid and leukemia cell lines. A.D.W. provided critical reagents and experimental advice. R.P.K., B.S. and F.N.vL. carried out MPLA analysis for IKZF1 on human patient samples. S.M.K. oversaw leukemia proteomics data and assisted with analyzing correlations between IKZF1, RELA and pSTAT5 ratios in human patient samples. M.A.F. designed experiments and helped with analysis. C.D.S.K. and M.A.F. wrote the manuscript; all co-authors edited the paper.
COMPETING FINANCIAL INTERESTS: The authors have no competing financial interests.
References
- 1.Pui CH, Gajjar AJ, Kane JR, Qaddoumi IA, Pappo AS. Challenging issues in pediatric oncology. Nature reviews Clinical oncology. 2011;8:540–549. doi: 10.1038/nrclinonc.2011.95. [DOI] [PMC free article] [PubMed] [Google Scholar]
- 2.Inaba H, Greaves M, Mullighan CG. Acute lymphoblastic leukaemia. Lancet. 2013;381:1943–1955. doi: 10.1016/S0140-6736(12)62187-4. [DOI] [PMC free article] [PubMed] [Google Scholar]
- 3.Pui CH, et al. Treating childhood acute lymphoblastic leukemia without cranial irradiation. The New England journal of medicine. 2009;360:2730–2741. doi: 10.1056/NEJMoa0900386. [DOI] [PMC free article] [PubMed] [Google Scholar]
- 4.Bhatia S, et al. Low incidence of second neoplasms among children diagnosed with acute lymphoblastic leukemia after 1983. Blood. 2002;99:4257–4264. doi: 10.1182/blood.v99.12.4257. [DOI] [PubMed] [Google Scholar]
- 5.Downing JR, et al. The Pediatric Cancer Genome Project. Nature genetics. 2012;44:619–622. doi: 10.1038/ng.2287. [DOI] [PMC free article] [PubMed] [Google Scholar]
- 6.Conter V, et al. Molecular response to treatment redefines all prognostic factors in children and adolescents with B-cell precursor acute lymphoblastic leukemia: results in 3184 patients of the AIEOP-BFM ALL 2000 study. Blood. 2010;115:3206–3214. doi: 10.1182/blood-2009-10-248146. [DOI] [PubMed] [Google Scholar]
- 7.Heltemes-Harris LM, Farrar MA. The role of STAT5 in lymphocyte development and transformation. Current opinion in immunology. 2012;24:146–152. doi: 10.1016/j.coi.2012.01.015. [DOI] [PMC free article] [PubMed] [Google Scholar]
- 8.Hoelbl A, et al. Clarifying the role of Stat5 in lymphoid development and Abelson-induced transformation. Blood. 2006;107:4898–4906. doi: 10.1182/blood-2005-09-3596. [DOI] [PMC free article] [PubMed] [Google Scholar]
- 9.Hoelbl A, et al. Stat5 is indispensable for the maintenance of bcr/abl-positive leukaemia. EMBO Mol Med. 2010;2:98–110. doi: 10.1002/emmm.201000062. [DOI] [PMC free article] [PubMed] [Google Scholar]
- 10.Schwaller J, et al. Stat5 is essential for the myelo- and lymphoproliferative disease induced by TEL/JAK2. Molecular cell. 2000;6:693–704. doi: 10.1016/s1097-2765(00)00067-8. [DOI] [PubMed] [Google Scholar]
- 11.Malin S, McManus S, Busslinger M. STAT5 in B cell development and leukemia. Current opinion in immunology. 2010;22:168–176. doi: 10.1016/j.coi.2010.02.004. [DOI] [PubMed] [Google Scholar]
- 12.Malin S, et al. Role of STAT5 in controlling cell survival and immunoglobulin gene recombination during pro-B cell development. Nature immunology. 2010;11:171–179. doi: 10.1038/ni.1827. [DOI] [PMC free article] [PubMed] [Google Scholar]
- 13.Nakayama J, et al. BLNK suppresses pre-B-cell leukemogenesis through inhibition of JAK3. Blood. 2009;113:1483–1492. doi: 10.1182/blood-2008-07-166355. [DOI] [PMC free article] [PubMed] [Google Scholar]
- 14.Mullighan CG, et al. Genome-wide analysis of genetic alterations in acute lymphoblastic leukaemia. Nature. 2007;446:758–764. doi: 10.1038/nature05690. [DOI] [PubMed] [Google Scholar]
- 15.Nutt SL, Kee BL. The transcriptional regulation of B cell lineage commitment. Immunity. 2007;26:715–725. doi: 10.1016/j.immuni.2007.05.010. [DOI] [PubMed] [Google Scholar]
- 16.Heltemes-Harris LM, et al. Ebf1 or Pax5 haploinsufficiency synergizes with STAT5 activation to initiate acute lymphoblastic leukemia. The Journal of experimental medicine. 2011;208:1135–1149. doi: 10.1084/jem.20101947. [DOI] [PMC free article] [PubMed] [Google Scholar]
- 17.Burchill MA, et al. Distinct effects of STAT5 activation on CD4+ and CD8+ T cell homeostasis: development of CD4+CD25+ regulatory T cells versus CD8+ memory T cells. J Immunol. 2003;171:5853–5864. doi: 10.4049/jimmunol.171.11.5853. [DOI] [PubMed] [Google Scholar]
- 18.Richards NG, Kilberg MS. Asparagine synthetase chemotherapy. Annual review of biochemistry. 2006;75:629–654. doi: 10.1146/annurev.biochem.75.103004.142520. [DOI] [PMC free article] [PubMed] [Google Scholar]
- 19.Parker MJ, et al. The pre-B-cell receptor induces silencing of VpreB and lambda5 transcription. The EMBO journal. 2005;24:3895–3905. doi: 10.1038/sj.emboj.7600850. [DOI] [PMC free article] [PubMed] [Google Scholar]
- 20.Fang W, et al. Frequent aberrant immunoglobulin gene rearrangements in pro-B cells revealed by a bcl-xL transgene. Immunity. 1996;4:291–299. doi: 10.1016/s1074-7613(00)80437-9. [DOI] [PubMed] [Google Scholar]
- 21.Goetz CA, Harmon IR, O’Neil JJ, Burchill MA, Farrar MA. STAT5 activation underlies IL7 receptor-dependent B cell development. J Immunol. 2004;172:4770–4778. doi: 10.4049/jimmunol.172.8.4770. [DOI] [PubMed] [Google Scholar]
- 22.Saijo K, et al. Essential role of Src-family protein tyrosine kinases in NF-kappaB activation during B cell development. Nature immunology. 2003;4:274–279. doi: 10.1038/ni893. [DOI] [PubMed] [Google Scholar]
- 23.McMurray HR, et al. Synergistic response to oncogenic mutations defines gene class critical to cancer phenotype. Nature. 2008;453:1112–1116. doi: 10.1038/nature06973. [DOI] [PMC free article] [PubMed] [Google Scholar]
- 24.Wang S, et al. Target analysis by integration of transcriptome and ChIP-seq data with BETA. Nat Protoc. 2013;8:2502–2515. doi: 10.1038/nprot.2013.150. [DOI] [PMC free article] [PubMed] [Google Scholar]
- 25.Ma S, Pathak S, Trinh L, Lu R. Interferon regulatory factors 4 and 8 induce the expression of Ikaros and Aiolos to down-regulate pre-B-cell receptor and promote cell-cycle withdrawal in pre-B-cell development. Blood. 2008;111:1396–1403. doi: 10.1182/blood-2007-08-110106. [DOI] [PMC free article] [PubMed] [Google Scholar]
- 26.Grumont RJ, Gerondakis S. Rel induces interferon regulatory factor 4 (IRF-4) expression in lymphocytes: modulation of interferon-regulated gene expression by rel/nuclear factor kappaB. The Journal of experimental medicine. 2000;191:1281–1292. doi: 10.1084/jem.191.8.1281. [DOI] [PMC free article] [PubMed] [Google Scholar]
- 27.Mullighan CG, et al. BCR-ABL1 lymphoblastic leukaemia is characterized by the deletion of Ikaros. Nature. 2008;453:110–114. doi: 10.1038/nature06866. [DOI] [PubMed] [Google Scholar]
- 28.Mullighan CG, et al. Deletion of IKZF1 and prognosis in acute lymphoblastic leukemia. The New England journal of medicine. 2009;360:470–480. doi: 10.1056/NEJMoa0808253. [DOI] [PMC free article] [PubMed] [Google Scholar]
- 29.Kuiper RP, et al. IKZF1 deletions predict relapse in uniformly treated pediatric precursor B-ALL. Leukemia. 2010;24:1258–1264. doi: 10.1038/leu.2010.87. [DOI] [PubMed] [Google Scholar]
- 30.Ferreiros-Vidal I, et al. Genome-wide identification of Ikaros targets elucidates its contribution to mouse B-cell lineage specification and pre-B-cell differentiation. Blood. 2013;121:1769–1782. doi: 10.1182/blood-2012-08-450114. [DOI] [PubMed] [Google Scholar]
- 31.Matsumoto A, et al. CIS, a cytokine inducible SH2 protein, is a target of the JAK-STAT5 pathway and modulates STAT5 activation. Blood. 1997;89:3148–3154. [PubMed] [Google Scholar]
- 32.Shi J, et al. Role of SWI/SNF in acute leukemia maintenance and enhancer-mediated Myc regulation. Genes & development. 2013;27:2648–2662. doi: 10.1101/gad.232710.113. [DOI] [PMC free article] [PubMed] [Google Scholar]
- 33.Pfitzner E, Jahne R, Wissler M, Stoecklin E, Groner B. p300/CREB-binding protein enhances the prolactin-mediated transcriptional induction through direct interaction with the transactivation domain of Stat5, but does not participate in the Stat5-mediated suppression of the glucocorticoid response. Molecular endocrinology (Baltimore, Md) 1998;12:1582–1593. doi: 10.1210/mend.12.10.0180. [DOI] [PubMed] [Google Scholar]
- 34.Kim J, et al. Ikaros DNA-binding proteins direct formation of chromatin remodeling complexes in lymphocytes. Immunity. 1999;10:345–355. doi: 10.1016/s1074-7613(00)80034-5. [DOI] [PubMed] [Google Scholar]
- 35.Heltemes-Harris LM, et al. Sleeping Beauty transposon screen identifies signaling modules that cooperate with STAT5 activation to induce B-cell acute lymphoblastic leukemia. Oncogene. 2016;35:3454–3464. doi: 10.1038/onc.2015.405. [DOI] [PMC free article] [PubMed] [Google Scholar]
- 36.Schwickert TA, et al. Stage-specific control of early B cell development by the transcription factor Ikaros. Nature immunology. 2014;15:283–293. doi: 10.1038/ni.2828. [DOI] [PMC free article] [PubMed] [Google Scholar]
- 37.Revilla IDR, et al. The B-cell identity factor Pax5 regulates distinct transcriptional programmes in early and late B lymphopoiesis. The EMBO journal. 2012;31:3130–3146. doi: 10.1038/emboj.2012.155. [DOI] [PMC free article] [PubMed] [Google Scholar]
- 38.Vilagos B, et al. Essential role of EBF1 in the generation and function of distinct mature B cell types. The Journal of experimental medicine. 2012;209:775–792. doi: 10.1084/jem.20112422. [DOI] [PMC free article] [PubMed] [Google Scholar]
- 39.Whyte WA, et al. Master transcription factors and mediator establish super-enhancers at key cell identity genes. Cell. 2013;153:307–319. doi: 10.1016/j.cell.2013.03.035. [DOI] [PMC free article] [PubMed] [Google Scholar]
- 40.Loven J, et al. Selective inhibition of tumor oncogenes by disruption of super-enhancers. Cell. 2013;153:320–334. doi: 10.1016/j.cell.2013.03.036. [DOI] [PMC free article] [PubMed] [Google Scholar]
- 41.Vahedi G, et al. Super-enhancers delineate disease-associated regulatory nodes in T cells. Nature. 2015;520:558–562. doi: 10.1038/nature14154. [DOI] [PMC free article] [PubMed] [Google Scholar]
- 42.Rayet B, Gelinas C. Aberrant rel/nfkb genes and activity in human cancer. Oncogene. 1999;18:6938–6947. doi: 10.1038/sj.onc.1203221. [DOI] [PubMed] [Google Scholar]
- 43.Nagel D, Vincendeau M, Eitelhuber AC, Krappmann D. Mechanisms and consequences of constitutive NF-kappaB activation in B-cell lymphoid malignancies. Oncogene. 2014;33:5655–5665. doi: 10.1038/onc.2013.565. [DOI] [PubMed] [Google Scholar]
- 44.Kordes U, Krappmann D, Heissmeyer V, Ludwig WD, Scheidereit C. Transcription factor NF-kappaB is constitutively activated in acute lymphoblastic leukemia cells. Leukemia. 2000;14:399–402. doi: 10.1038/sj.leu.2401705. [DOI] [PubMed] [Google Scholar]
- 45.Pinz S, Unser S, Rascle A. Signal transducer and activator of transcription STAT5 is recruited to c-Myc super-enhancer. BMC Mol Biol. 2016;17:10. doi: 10.1186/s12867-016-0063-y. [DOI] [PMC free article] [PubMed] [Google Scholar]
- 46.Sha WC, Liou HC, Tuomanen EI, Baltimore D. Targeted disruption of the p50 subunit of NF-kappa B leads to multifocal defects in immune responses. Cell. 1995;80:321–330. doi: 10.1016/0092-8674(95)90415-8. [DOI] [PubMed] [Google Scholar]
- 47.Leitges M, et al. Immunodeficiency in protein kinase cb-deficient mice. Science (New York, NY) 1996;273:788–791. doi: 10.1126/science.273.5276.788. [DOI] [PubMed] [Google Scholar]
- 48.Khan WN, et al. Defective B cell development and function in Btk-deficient mice. Immunity. 1995;3:283–299. doi: 10.1016/1074-7613(95)90114-0. [DOI] [PubMed] [Google Scholar]
- 49.Livak KJ, Schmittgen TD. Analysis of relative gene expression data using real-time quantitative PCR and the 2(-Delta Delta C(T)) Method. Methods (San Diego, Calif) 2001;25:402–408. doi: 10.1006/meth.2001.1262. [DOI] [PubMed] [Google Scholar]
- 50.Schjerven H, et al. Selective regulation of lymphopoiesis and leukemogenesis by individual zinc fingers of Ikaros. Nature immunology. 2013;14:1073–1083. doi: 10.1038/ni.2707. [DOI] [PMC free article] [PubMed] [Google Scholar]
- 51.Mahmud SA, et al. Costimulation via the tumor-necrosis factor receptor superfamily couples TCR signal strength to the thymic differentiation of regulatory T cells. Nature immunology. 2014;15:473–481. doi: 10.1038/ni.2849. [DOI] [PMC free article] [PubMed] [Google Scholar]
- 52.Kornblau SM, et al. Functional proteomic profiling of AML predicts response and survival. Blood. 2009;113:154–164. doi: 10.1182/blood-2007-10-119438. [DOI] [PMC free article] [PubMed] [Google Scholar]
Associated Data
This section collects any data citations, data availability statements, or supplementary materials included in this article.
Supplementary Materials
Data Availability Statement
The data that support the findings of this study are available from the corresponding author upon request.