

Abstract
Implantation of synthetic material, including vascular grafts, pacemakers, etc. results in the foreign body reaction and the formation of multinucleated giant cells (MGCs) at the exterior surface of the implant. Despite the long-standing premise that fusion of mononucleated macrophages results in the formation of MGCs, to date, no published study has shown fusion in context with living specimens. This is due to the fact that optical-quality glass, which is required for the majority of live imaging techniques, does not promote macrophage fusion. Consequently, the morphological changes that macrophages undergo during fusion as well as the mechanisms that govern this process remain ill-defined. In this study, we serendipitously identified a highly fusogenic glass surface and discovered that the capacity to promote fusion was due to oleamide contamination. When adsorbed on glass, oleamide and other molecules that contain long-chain hydrocarbons promoted high levels of macrophage fusion. Adhesion, an essential step for macrophage fusion, was apparently mediated by Mac-1 integrin (CD11b/CD18, αMβ2) as determined by single cell force spectroscopy and adhesion assays. Micropatterned glass further increased fusion and enabled a remarkable degree of spatiotemporal control over MGC formation. Using these surfaces, we reveal the kinetics that govern MGC formation in vitro. We anticipate that the spatiotemporal control afforded by these surfaces will expedite studies designed to identify the mechanism(s) of macrophage fusion and MGC formation with implication for the design of novel biomaterials.
Keywords: Macrophage fusion, multinucleated giant cells, foreign body reaction, microscopy, live imaging, Mac-1 integrin
Introduction
Implantation of synthetic materials, including vascular grafts, pacemakers and other medical devices results in the foreign body reaction at the exterior surface of the implant. Chronic inflammation during the end stages of the foreign body reaction causes macrophages to fuse and form MGCs. Once formed, MGCs make destructive cellular products that clear the foreign body (e.g. MMP-9, superoxide, cathepsin K, etc.). These potent cellular products etch surfaces and promote stress fractures that can eventually lead to failure of pacemakers [1] or synthetic implantable biomaterials [2, 3]. Thus, the existence of MGCs on the implant surface is thought to be detrimental to the long term function of the device [4-8].
In order for macrophages to fuse, monocytes recruited from peripheral blood to sites of inflammation differentiate into macrophages that subsequently fuse as inflammation progresses to the chronic state. The T helper 2 cytokine interleukin-4 (IL-4) promotes macrophages fusion in vivo [9] and when applied in cell culture can be used to study monocyte/macrophage fusion [10]. Although this in vitro cell system has proven invaluable to our understanding of the molecular mediators that orchestrate macrophage fusion, there is a surprising paucity of data regarding the morphological changes that macrophages undergo during fusion as well as the cellular mechanisms that govern this process. In fact, despite several long-standing predictions that purportedly account for the mechanisms of macrophage fusion, no published study to date has shown the formation of a MGC in context with living specimens.
This deficiency is primary due to the fact that most high resolution techniques in optical microscopy require glass as substrate. However, glass surfaces are known to support very low levels of macrophage fusion in the presence of IL-4 despite robust adhesion [11]. When macrophage fusion does occur on glass, it is impossible to predict where and at what time macrophages will fuse, since increased magnification decreases the field of view. Consequently, if the goal is to observe macrophage fusion with living specimens then low magnification objectives and long imaging durations are necessary in order to capture rare fusion events. On the other hand, plastic surfaces (e.g. Permanox) are known to support macrophage fusion in the presence of IL-4 [12], and currently serve as the gold standard for in vitro analysis of MGC formation [13]. However, the problem with most plastic substrates is that changes in refractive index lead to chromatic aberration which is accentuated by substrate thickness. Further, birefringent properties of most plastic substrates make techniques that exploit polarity of light impossible. Finally, most plastic is not compatible with the use of high numerical aperture objectives. If plastic is used, the only technique that can be successfully employed is low-resolution phase-contrast and only when long working distance or low magnification objectives are used. These barriers have restricted studies to fixed specimens and have thwarted our ability to utilize the large number of imaging techniques that rely on optical-quality glass for image formation.
Here we describe fabrication of optical-quality glass surfaces that exploit adsorption of molecules containing long-chain hydrocarbons. Glass surfaces adsorbed with these substances promote extraordinary rates of macrophage fusion and adhesion is mediated in part by Mac-1 integrin (αMβ2, CD11b/CD18, CR3). Micropatterning glass with the aforementioned substances leads to a further increase in macrophage fusion and enables a high degree of spatiotemporal control over the formation of MGCs. For the first time, we utilize living specimens to reveal the sequence of events that result in MGC formation via macrophage fusion. We show that MGC formation is a non-linear process that requires a lag-phase and involves three types of fusion events. Moreover, macrophage fusion occurs between intercellular margins, but not through the previously proposed “cellocytosis” mechanism. We anticipate that the spatiotemporal control afforded by this surface may expedite fundamental studies related to the mechanism of macrophage fusion. Furthermore, a better understanding of this process represents a significant step towards the design of biomaterials that are resistant to inflammatory responses evoked by MGCs.
Materials and Methods
Mice
C57BL/6J and Mac-1-/- (B6.129S4-Itgamtm1Myd/J) mice were purchased from The Jackson Laboratory (Bar Harbor, ME). LifeAct mice [14] were a generous gift from Dr. Janice K. Burkhardt and used with permission from Dr. Roland Wedlich-Söldner. Mac-1-/- mice were housed in sterile cages. All mice were given ad libitum access to food and water and colonies were maintained at a constant temperature of 22 °C on a 12 hr light/dark cycle. All procedures were performed in accordance with the animal protocols approved by the Institutional Animal Care and Use Committee at the Arizona State University and the Mayo Clinic.
Macrophage isolation and cell culture
Macrophages were isolated from the peritoneum 72 hr after injection of a 0.5 mL sterile 4% solution of Brewer's thioglycollate (Sigma Aldrich, St. Louis, MO). Mice were humanely sacrificed according protocols approved by Mayo Clinic and ASU Animal Care and Use Committees. Immediately following euthanasia, 5 mL of an ice-cold solution of phosphate-buffered saline (PBS, pH 7.4) supplemented with 5 mM ethylenediaminetetraacetate was injected aseptically into the peritoneum, the lavage containing cells were collected, and the cells were counted with a Neubauer hemocytometer. Low passage number (≤ 10) human embryonic kidney 293 cells (HEK293) stably expressing human Mac-1 integrin and wild-type HEK293 cells were previously described [15]. The cells were cultured in the complete DMEM:F12 medium and detached from the culture dish by incubation in Cellstripper™ (Cellgro, Manassas, VA). The cells were washed and then resuspended in the complete DMEM:F12 medium.
IL-4-induced macrophage fusion
Peritoneal lavage cells were applied at a concentration of 5×10⁵ cells/mL and spread evenly across the glass insert (23.5 mm) of a 35 mm Fluorodish (FluoroDish; World Precision Instruments, Sarasota, FL). Where applicable, cell number was scaled linearly to account for changes in surface area. Cells were incubated in 5% CO2 at 37 °C for 30 min and nonadherent cells were removed and adherent macrophages were washed 3-5 times with Hank's balanced salt solution (HBSS; Cellgro, Manassas, VA) containing 0.1% bovine serum albumin (BSA). Cells were incubated in DMEM:F12 (Cellgro, Manassas, VA) supplemented with 10% fetal bovine serum (FBS, Atlanta Biological, Atlanta, GA) and 100 I.U./mL penicillin, 100 μg/mL streptomycin (Cellgro, Manassas, VA). After 2 hr, the medium was removed and fresh medium supplemented with 10 ng/mL of interleukin-4 (IL-4; Genscript, Piscataway, NJ) was applied to the culture to induce fusion. In this study, the application of IL-4 is considered t=0. At the respective time points, cultures were washed 2 times with PBS and incubated with ice-cold methanol for 2 min. The fixed cultures were placed in an oven at 60 °C until dried. Wright's stain (Sigma Aldrich, St. Louis, MO) was applied for 8 minutes and the stain was removed and substituted with fresh buffered Wright's stain (pH 6.5) for an additional 8 minutes. The cover glass was placed under running deionized water to remove unbound stain and dried in an oven at 60 °C. The cover glass was mounted in Permount™ (Thermo Fischer Scientific, Waltham, MA), the mountant was air dry, and the specimens were imaged with bright field optics. The extent of MGCs formation was evaluated by determining the fusion index. The fusion index is defined as the number of nuclei present in fused macrophages divided by the total number of nuclei in both fused and non-fused macrophages. Three to 5 bright field images collected at 20× objective magnification were analyzed per specimen.
Adhesion assays
Cell adhesion was determined by plating 2.5 × 10⁵ cells in 35 mm dishes. Care was taken to ensure that cells spread evenly across the entire surface area of the dish for each experimental condition. After 25 min at 37 °C in 5% CO2, cell images were captured before washing in order to standardize the number of cells in the field of view. Three phase contrast images (20× objective magnification) corresponding to the center of the dish, the edge of the dish and the center-edge midpoint were collected for each sample. At 30 min, the specimens were washed gently 3 times with HBSS supplemented with 0.1% BSA and 3 images were collected as described above. Adhesion was calculated by dividing the average number of adherent cells after washing by the average number of total cells before washing. For inhibition experiments, Mac-1 HEK293 cells were mixed with function blocking mAb 44a (10 μg/mL per 106 cells) or an isotype IgG1 control for 15 min at 22 °C.
Surface characterization
Nanotopography of each surface was resolved using an atomic force microscope (AFM; Nanosurf, Woburn, MA). Scans (10 × 10 μm) were acquired in tapping mode with conical silicon AFM probes (Nanoscience, Phoenix, AZ). The nominal tip radius was 8 nm, and nominal resonant frequency was 300 kHz. Imaging was conducted in air at 22 °C. Surface roughness was calculated using Gwyddion 2.45 software and represents an average of 3-5 randomly selected scans from at least 2 different preparations. Water contact angle was determined using an EasyDrop goniometer (Krüss, Matthews, NC). Water droplets (4 μL) were deposited on the sample surfaces, and their profiles were captured and analyzed for contact angle by the Drop Shape Analysis software (Krüss, Hamburg, Germany). 10 droplets were measured per each surface from at least 3 separate experiments.
Liquid Chromatography/Mass Spectrometry
The composition of mixtures eluted from the FD dishes was determined by mass spectrometry. The LC/MS instrument consisted of a Dionex Ultimate 3000 Rapid Separation UPLC system equipped with a Dionex Ultimate 3000 autosampler and a Dionex Ultimate 3000 photodiode array detector coupled with a Bruker MicrOTOF-Q II quadrupole time-of-flight hybrid mass spectrometer using Hystar 3.2 software. The Bruker electrospray ionization source was operated in the positive ion mode with the following parameters: end plate offset voltage = −500 V, capillary voltage = 2000 V, and nitrogen as both a nebulizer (4 bar) and dry gas (7.0 L/min flow rate at 180 °C temperature). Mass spectra were accumulated over the mass range 50-3000 Da at an acquisition rate of 5,000 per second. Separations were performed on a Dionex Acclaim RSLC 120 C18 2.2 um 120 Å 2.1 × 100 mm column. The mobile phase (A = 0.1% formic acid in water; B = 0.1% formic acid in acetonitrile) gradient consisted of elution at 0.4 mL/min with 90% A/10% B for 2 min, followed by a 14-min linear gradient to 100% B, hold at 100% B for two minutes, then return to initial conditions for 2 minutes.
Single cell force spectroscopy
Tipless silicon nitride cantilevers (HYDRA, AppNano, Santa Clara, CA) were prepared as described previously [16]. Briefly, cantilevers were plasma-cleaned at 29.6W, 400 mTorr in O2 gas using a plasma cleaner (PDC-001, Harrick Plasma, Ithaca, NY). Tips were functionalized by incubation in 2 mM (3-Aminopropyl) triethoxysilane (APTES, Sigma Aldrich, St. Louis, MO) in chloroform solution followed by changes of ethanol and then deionized water. Cantilevers were incubated in 1.25 mM Bis(sulfosuccinimidyl) suberate sodium salt (BS3, Sigma Aldrich, St. Louis, MO) solution for 30 min and then placed into 0.5 mg/mL concanavalin A (Sigma Aldrich, St. Louis, MO) solution for 30 min at 22 °C. Cantilevers were then rinsed with PBS and stored in 1 M NaCl at 4 °C. Functionalized cantilevers were used in a MFP-3D AFM (Asylum Research) placed on an inverted microscope (IX71, Olympus). Cantilevers were brought into contact with target cells manually, and withdrawn from the surface. Cells were allowed to firmly attach for 1 minute. SCFS measurements were conducted at 37 °C in HBSS with 0.1% BSA as described previously [17]. Force curves were recorded on different spots of the surface with a 2 nN trigger force and a 120 s dwell time. Approach and retraction speeds were 2 μm/s. Three to five force curves were generated for each cell and 6-12 cells were used for each condition.
Surface fabrication
To prepare acid clean glass (AC), high stringency cover glass (Carolina Biological, Burlington, NC) was washed 3 times in hydrochloric acid, washed 10 times in copious volumes of nanopure water, washed 3 times in anhydrous acetone, washed an additional 10 times in nanopure water and stored in pure ethyl alcohol until use. Each washing step was 30 min and included either sonication or agitation. Plasma cleaned (PC) surfaces were prepared by exposing glass to vacuum gas plasma (Harricks, Ithaca, NY) for 60 s. PC preparations were stored in a vacuum desiccator until use.
Oleamide (Sigma Aldrich, St. Louis, MO) was dissolved in isopropyl alcohol at a concentration of 1 mg/mL and used immediately thereafter. The solution was adsorbed to AC glass for 30 s, the excess solution was removed, and the glass was allowed to air dry. Dimethylsulfoxide-free paraffin wax (Sigma Aldrich, St. Louis, MO) and tocopherol-free petrolatum (Sigma Aldrich, St. Louis, MO) were solubilized in toluene at 1 mg/mL and 10 mg/mL, respectively. Cover glass was rendered fusogenic by application of either solution for 30 s. Excess solution was removed and the surfaces were allowed to dry for 2 min. Prior to use, modified surfaces were polished by three strokes in the x- and y-axis using a lint-free cloth. The surfaces were sterilized by UV irradiation for 15-30 minutes and washed aseptically with sterile water. In preliminary experiments, the lowest concentrations of paraffin, oleamide, and petrolatum that made AC glass fusogenic were determined.
Surface micropatterning
In order to create a micropattern, a finder grid (Electron Microscopy Sciences, Hatfield, PA) was placed in a 5 μL drop of a 1 mg/mL solution of paraffin in toluene in the center of an acid cleaned cover glass. The cover glass was air dry and then cleaned by vacuum gas plasma to remove paraffin between grid bars. The mask was carefully removed with Dumont no. 5 forceps (Electron Microscopy Sciences, Hatfield, PA) which left a pattern on the glass surface. Macrophage fusion was induced by IL-4 as described above.
Videomicroscopy
Macrophages were applied to micropatterned glass and fusion was induced as described in the text above. The dish was transferred from the incubator to a stage-top incubation unit that was calibrated to consistently maintain a humified atmosphere of 5% CO2 in air at 37 °C. Phase contrast images (20× objective magnification) were collected every 30 s with an Evos FL Auto microscope (Thermo Scientific, Waltham, MA) and transferred to ImageJ to create videos.
Correlated light and scanning electron microscopy (CLEM)
CLEM was conducted as previously described [18], albeit with minor modification. Macrophages expressing enhanced green fluorescent protein (eGFP)- or monomeric red fluorescent protein LifeAct (mRFP) were mixed in equal number and applied to micropatterned surfaces. Twelve hours after the application of IL-4 the specimens were fixed with 2% formaldehyde for 30 minutes. The specimens were washed 3 times for 10 minutes each and incubated with Hoechst 33342 according to the manufacturer's recommendation. Images were collected with a 20× (0.7 N.A.) objective via a Leica SP5 laser scanning confocal microscope and subsequently fixed with 2% glutaraldehyde prepared in 100 mM cacodylate buffer (pH 7.2). The specimens were washed with copious volumes of cacodylate and post-fixed with 1% OsO4 for 45 min. After washing with water, the specimens were dehydrated through a graded series of ethanol. The specimen was dried through the CO2 critical point and sputtered with Pt/Au. Images were collected on a JOEL JSM 6300 scanning electron microscope.
Direct stochastic optical reconstruction microscopy (dSTORM)
dSTORM was conducted as described previously [19]. Macrophages were detergent extracted with a solution containing 0.1% Triton X-100, 100 mM KCl, 5 mM MgCl2, 2 mM EGTA, 20 mM 2-[4-(2-hydroxyethyl)piperazin-1-yl]ethanesulfonic acid (HEPES), pH 6.8 for 1 min at room temperature. Macrophages were fixed in 2% formaldehyde made in 100 mM PBS (pH 7.2) for 15 min. The samples were washed 3 times for 15 min with PBS supplemented with 1% BSA (PBS-BSA) and incubated with a mouse anti-vinculin mAb (V9264, Sigma Aldrich, St. Louis, MO) diluted in antibody dilution buffer at 4 °C overnight with gentle agitation. Antibody dilution buffer contains 100 mM KCl, 5 mM MgCl2, 2 mM EGTA, 0.01% Tween-20, 1% non-fat milk, 20 mM HEPES (pH 6.8). The specimens were washed 3 times for 15 min with PBS-BSA followed by incubation in buffer containing the full length Alexa-647 conjugated secondary antibody (Thermo Fischer Scientific, Waltham, MA) at 4 °C overnight. The samples were washed with PBS and imaged immediately thereafter. Vectashield diluted in Tris-glycerol [20], was used in combination with c.a. 12 mw laser excitation (measured at the objective) to achieve spatially separated single-molecule emitters. Emitters were collected in TIRF optics with a 100× 1.4 N.A. objective and recorded with an Andor electron-multiplying charge-coupled device operating in kinetic mode. Single-molecule localizations were reconstructed in RapidSTORM as described elsewhere [21].
Statistics
Unless stated otherwise, results from three independent experiments are shown as mean ± standard deviation (S.D.). Differences were determined by analysis of variance (ANOVA) followed by Tukey's or Dunn's post-test using GraphPad InStat software. Data were considered significantly different if post-tests indicated that p < 0.05.
Results
FluoroDish™ glass surfaces promote macrophage fusion
While performing direct stochastic optical reconstruction microscopy (dSTORM) for an independent investigation we observed serendipitously efficient IL-4-induced macrophage fusion on the FluoroDish™ (FD) glass surface (Figure 1A). The high level of macrophage fusion observed on this surface was surprising since clean glass surfaces are known to promote modest levels of fusion, even in the presence of robust adhesion [11, 22]. Indeed, 24 hr after the application of IL-4 there appeared very few MGCs on acid cleaned glass surfaces (AC) or FD surfaces treated with vacuum gas plasma (FD+PC), whereas a large number of MGCs decorated the FD surface (Figure 1A). Analysis of the fusion index confirmed this observation and demonstrated a significant increase in macrophage fusion when utilizing the FD (36 ± 13%), but neither AC (10 ± 7%) nor FD+PC (9 ± 3%) as substrates (Figure 1B). The low level of fusion observed after treating the FD surface with vacuum gas plasma indicated that it lost the capacity to promote macrophage fusion. It further suggested that the physicochemical properties of the FD+PC surface were altered and/or an unknown contaminant present on the FD surface was removed by vacuum gas plasma.
Figure 1. The FD surface promotes high levels of macrophage fusion in the presence of IL-4.

(A) Analysis of macrophages plated on three different surfaces 24 h after the application of IL-4. Macrophages were stained with Wright's stain. Outlined in black is a MGC formed on the FD surface. The scale bar is 50 μm. (B) Quantification of the fusion index. The histogram indicates that the FD surface, but not AC or FD + PC, supports a high degree of macrophage fusion. Results shown are means ± S.D. from three independent experiments each with three to five bright field images analyzed. **p<0.01 as determined by ANOVA.
Characterization of FD, AC and FD+PC surfaces
Interfacial processes driven by the physicochemical properties of the material are known to be important modulators of macrophage fusion [4, 23, 24]. In order to gain insight into the characteristics of the surface that might promote macrophage fusion, we employed atomic force microscopy (AFM) to directly visualize surface features. FD surfaces appeared heterogeneous and contained large and small globules (Figure 2A). In addition, there appeared patches of material raised from the surface (Figure 2A). In stark contrast, AC glass appeared uniform with very few surface features (Figure 2A). FD+PC surfaces contained a heterogeneous variety of surface globules (Figure 2A). Additional AFM analysis demonstrated that FD surfaces had a surface roughness (Ra) of 1.9 ± 0.7 nm, which was significantly greater than both AC glass (0.2 ± 0.02 nm) and FD + PC (1.3 ± 0.5 nm) surfaces (Figure 2B). Advancing water contact angles indicated that the FD surface was hydrophobic (θ = 92° ± 2.5) whereas AC glass and FD+PC surfaces were relatively hydrophilic at 23° ± 1.8 and 13° ± 9.2, respectively (Figure 2C).
Figure 2. Material characterization of various surfaces.

(A) AFM images show surface topography of the FD, AC and FD+PC surfaces. The z-scale is shown on the right side of each micrograph. (B) The surface roughness was measured from AFM scans (10 × 10 μm). (C) Advancing water contact angle analysis indicates the relative wettability of each surface. *p<0.05; **p<0.01. The scale bars in the lower right corner of the image correspond to 500 nm.
Cell adhesion to the FD surface is mediated by Mac-1 integrin
Before macrophages can fuse they must first adhere to the substrate [13]. Adhesion is mediated in part by integrins and in particular Mac-1 integrin is capable of mediating leukocyte adhesion to multiple ligands [25, 26]. In order to examine the possibility that Mac-1 might be involved in adhesion, macrophages isolated from the inflamed peritoneum of wild-type and Mac-1-/- mice were applied to FD and FD+PC surfaces and adhesion was assessed. Figure 3A and 3B show that macrophages adhered to both surfaces with no significant difference observed between wild-type and Mac-1-deficient cells. However, inspection of cells via laser scanning confocal microscopy indicated that wild-type, but not Mac-1-deficient macrophages spread on the FD surface (Figure 3A). Quantitative analyses confirmed a significant increase in spreading (∼3.5-fold) of wild-type compared to Mac-1-deficient macrophages on the FD surface (Figure 3C). Furthermore, although not significantly different, spreading of Mac-1-deficient macrophages on the FD+PC surface tended to decrease (Figure 3C). Single cell force spectroscopy (SCFS) demonstrated a significant decrease in the maximal adhesion force developed between Mac-1-deficient macrophages and the FD surface as compared to wild-types macrophages (3.0 ± 2.2 nN vs. 11.2 ± 6.7 nN; Figure 3D).
Figure 3. Adhesion and spreading of WT and Mac-1-deficient macrophages for the FD and FD+PC surfaces.

(A) Confocal micrographs of TG-elicited WT and Mac-1-deficient mouse macrophages applied for 30 min on the FD and FD + PC surfaces. Representative images are shown. (B) Quantification of adhesion of WT and Mac-1-deficient macrophages. (C) Quantification of spreading of WT and Mac-1-deficient macrophages. Results shown in (B) and (C) are means ± S.D. from 9 images with ∼200-400 cells per image from three independent experiments. *p<0.05 as determined by ANOVA. (D) Quantification by single cell force spectroscopy of adhesion forces developed between WT and Mac-1-deficient macrophages and the FD surfaces. The median maximum adhesion force value is shown in red and significance was determined from Wilcoxon rank sum test. ***p<0.001. Scale bars, 10 μm.
Macrophages are known to contain a variety of adhesion molecules, which makes the cell system complex. In order to substantiate the ability of Mac-1 to support cell adhesion to the FD surface, we employed a model system based on HEK293 cells genetically engineered to express Mac-1 (Mac-1 HEK293). Figure 4A and 4B show that wild-type HEK293 cells (WT) adhered poorly to the FD surface. However, application of Mac-1 HEK293 cells to the FD surface caused approximately a 4-fold increase in cell adhesion. The specificity of the interaction between Mac-1 and the FD surface was further assessed through the use of the function blocking mAb 44a, directed against the αM integrin subunit. Incubation of Mac-1 HEK293 cells with mAb 44a significantly decreased adhesion, whereas the IgG control did not (Figure 4B). No significant difference in adhesion was observed when HEK293 and Mac-1 HEK293 cells were applied to the FD+PC surface (Figure 4B). Consistent with the lack of involvement of Mac-1 in adhesion to the FD+PC surface, mAb 44a had no effect on adhesion of Mac-1 HEK293 cells (Figure 4B), suggesting that other structures supported adhesion. SCFS experiments demonstrated that the maximum adhesion force of Mac-1 HEK293 cells to the FD surface was ∼2-fold higher than the WT counterpart (1.7 ± 1.0 vs. 0.64 ± 0.35 nN; Figure 4 C). Together, these data indicate that Mac-1 contributes to adhesion and spreading to the FD surface.
Figure 4. Adhesion of cultured Mac-1 HEK293 cells to the FD surface is mediated by Mac-1 integrin.

(A) Confocal micrographs of Mac-1 HEK293 and WT HEK293 cells adhered to the FD and FD + PC surfaces. Representative images are shown. (B) Quantification of adhesion of Mac-1 HEK293 and HEK293 cells to FD and FD+PC surfaces. Pre-incubation of Mac-1 HEK293 cells with function-blocking anti-Mac-1 mAb 44A abolished adhesion, whereas pre-incubation with IgG isotype control did not affect adhesion. Results shown are means ± S.D. from 9 fields with ∼200-310 cells per image from three independent experiments. *p<0.05; ***p<0.001 as determined by ANOVA. (C) Quantification by single cell force spectroscopy of adhesion forces developed between Mac-1 HEK293 and HEK293 cells and the FD surfaces. The median maximum adhesion force value is shown in red and significance was determined from Wilcoxon rank-sum test. ***p<0.001. The scale bars in the lower right corner of each micrograph are 10 μm.
Oleamide contamination on the FD surface promotes fusion
The dramatic decrease in macrophage fusion on the AC and FD+PC surfaces suggested that, in addition to different physicochemical properties, a contaminant(s) present on the FD surface may contribute to the high fusion-promoting activity. To investigate this possibility, we sonicated the FD surface in isopropanol to remove the potential contaminant(s) and found that the treated surfaces lost the ability to support macrophage fusion. Further, collecting isopropanol eluate from the FD surface and applying it back onto non-fusogenic AC glass restored macrophage fusion to a level comparable to that of intact FD surfaces (not shown). To identify a substance(s) responsible for the fusion-promoting activity, we analyzed the chemical composition of isopropanol eluate by liquid chromatography/mass spectrometry (LC/MS). The LC analysis revealed seven major peaks (Figure S1-A), four of which corresponded to the solvent, isopropanol. MS analysis of the three LC peaks revealed triisopropanolamine (m/z 192.1481), oleamide (m/z 282.2756) and an unknown compound (m/z 387.1936) (Figure S1-B). Since both triisopropanolamine and oleamide are used as agents in adhesive cures, we hypothesized that during the curing process of the adhesive that bonds the glass bottom of FluoroDish to the plastic walls, the cure vapors formed a thin layer on the glass surface.
When applied to AC glass, triisopropanolamine promoted neither adhesion nor fusion at any concentration tested (data not shown). However, when we applied oleamide to AC glass we observed high levels of macrophage fusion that qualitatively resembled the FD surface (Figure 5A). Moreover, the fusion index observed on oleamide-adsorbed and FD surfaces were similar (29 ± 8% vs. 27± 8%; Figure 5B). Oleamide is an amide of oleic acid that contains a long-chain hydrocarbon (Figure 5A). We predicted that other molecules with similar hydrocarbon chains adsorbed to AC glass might also render AC glass fusogenic. To examine this possibility, we adsorbed paraffin wax and separately petrolatum, which both contain mixtures of hydrocarbon molecules, to AC glass. Figures 5A and 5B show that AC surfaces adsorbed with paraffin and petrolatum promoted effective macrophage fusion (Figure 5A) and quantitatively, paraffin significantly increased fusion compared to oleamide-adsorbed surfaces (46 ± 9% and 35 ± 6%, respectively; Figure 5B). No fusion was observed when AC glass was treated with toluene or isopropanol (Figure 5A and 5B). Under identical culture conditions, the level of macrophage fusion observed on paraffin-adsorbed glass was significantly greater than on Permanox (Figure 5B).
Figure 5. Adsorption of oleamide, paraffin and petrolatum make glass a fusogenic substrate.

(A) Analyses of macrophages fusion on glass adsorbed with various long-chain hydrocarbons or incubated with solvent. Fusion of TG-elicited macrophages was induced by IL-4 for 24 hr. Cells were stained with Wright's stain. Selected MGCs are outlined in black. Glass treated with isopropanol or toluene does not promote macrophage fusion. The scale bar in each of the micrographs is 50 μm. Representative images are shown. (B) Quantification of fusion indices for each surface. The fusion index on Permanox was determined under identical culture conditions. Results shown are means ± S.D from three independent experiments each with three to five bright field images analyzed. *p<0.05 as determined by ANOVA.
Physical, optical and adhesive properties of paraffin-adsorbed surfaces
Having established that the surfaces adsorbed with hydrocarbon chain molecules exhibit high fusion-promoting capacity, we proceeded to investigate physical, adhesive and optical properties of the surface. Since surfaces adsorbed with paraffin promoted the highest levels of macrophage fusion, we elected to utilize them to examine the surface topography, wettability and ability to support adhesion of Mac-1 HEK293 cells. Visualization of surface topography by AFM showed that paraffin-adsorbed glass (P surface) contained arrays of material that were raised from the surface by 10 nm (Figures 6A and 6B). However, despite the presence of these arrays, the P surface remained relatively flat (roughness 0.69 ± 0.15 nm; Figure 6A and 6B). Treatment of the P surfaces with vacuum gas plasma (P+PC) removed most, but not all, of the paraffin (Figure 6A) and slightly decreased surface roughness (0.52 ± 0.07 nm; Figure 6B). Advancing water contact angle indicated that adsorption of paraffin to AC glass strongly increased surface hydrophobicity of the P surface, whereas the P+PC surface was hydrophilic (Figure 6C).
Figure 6. Characterization of surfaces adsorbed with paraffin.
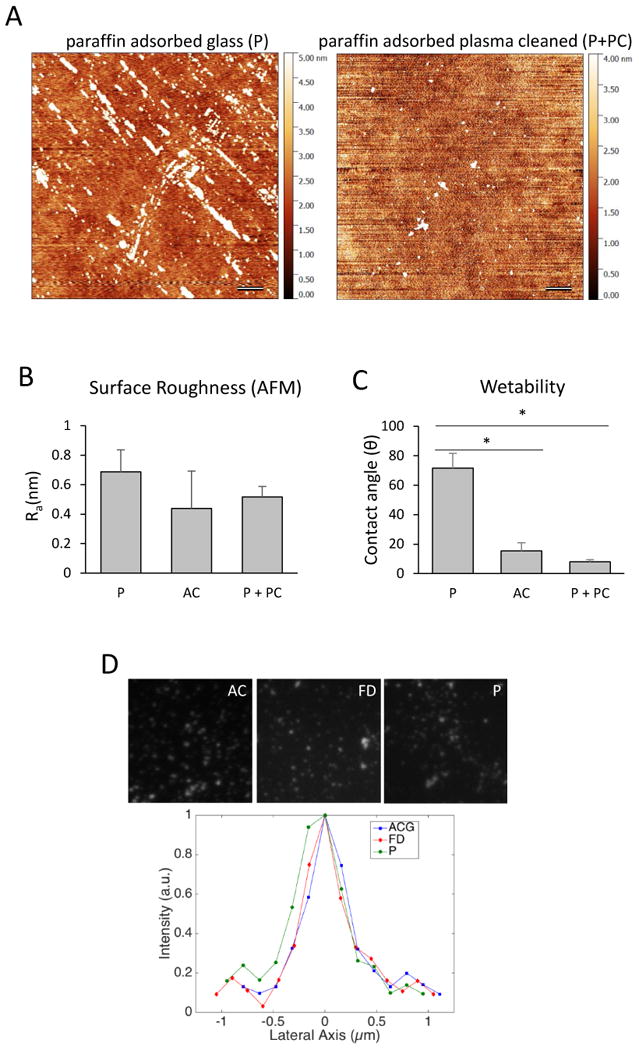
(A) AFM images of the nanotopography of paraffin-adsorbed and paraffin-adsorbed plasma cleaned surfaces. Scale bars are 500 nm. (B) Surface roughness as measured from 4-10 independent scans (10 × 10 μm). (C) Advancing water contact angle indicates that P surfaces are hydrophobic, whereas AC and P + PC surfaces are hydrophilic. (D) Representative intensity profiles for 100-nm TetraSpec beads on the AC, FD and P surfaces.
To examine the possibility that adsorption of paraffin influenced the optical properties of the P surfaces, we imaged 100 nm Tetraspec beads (488 nm excitation) with total internal reflection fluorescence (TIRF) microscopy. Qualitatively, the diameters of beads on the AC, FD and P surfaces did not appear to be different (Fig. 6D). Comparison of the lateral axis (i.e. bead diameters) showed that full width at half maximum obtained from line scans, which is a metric of the performance of the optical system, was 305 ± 28 nm, 313 ± 23 nm, and 308 ± 25 nm for the AC, FD and P surfaces, respectively. These data indicating that the P surface should be amenable to most imaging techniques, including single-molecule super resolution microscopy (Figure S2).
The P surface was able to support strong adhesion of Mac-1 HEK293, but not WT HEK293 cells (Figures 7A and 7B). Similar to the FD surface, adhesion was solely dependent on Mac-1 integrin, since pre-incubation of Mac-1 HEK293 cells with mAb 44a, but not control IgG, completely inhibited adhesion (Figure 7B). Furthermore, consistent with a role for Mac-1 in cell adhesion, maximum adhesion force was ∼3.5-fold greater for Mac-1 HEK293 compared to HEK293 cells (3.2 ± 1.3 vs. 1.4 ± 1.0 nN; Figure 7C). Two differences were identified between adhesion of Mac-1 HEK293 and HEK293 cells to the P- and FD surfaces. First, the maximal adhesion force required for detachment of Mac-1 HEK293 cells from the P-surface was ∼2-fold greater than that from the FD surface (Figures 4B and 7B). Second, while both FD+PC and P+PC surfaces supported adhesion of wild-type HEK293 and Mac-1 HEK293 cells, mAb 44a inhibited adhesion to the P+PC, but not to FD+PC surface (Figures 4B and 7B).
Figure 7. Adhesion of Mac-1 HEK293 cells to the P surface.

(A) Confocal micrographs illustrating the morphology and number of cells adhered after 30 minutes to the P and P+PC surfaces. Representative images are shown. (B) Quantification of adhesion of Mac-1 HEK293 and WT HEK293 cells to the P and P+PC surfaces. Pre-incubation of Mac-1 HEK293 cells with function-blocking anti-Mac-1 mAb 44A abolished adhesion to both P and P+PC surfaces, whereas pre-incubation with IgG isotype control did not affect adhesion. Results shown are means ± S.D. from 9 fields with ∼160-430 cells per image from three independent experiments. *p<0.05 as determined by ANOVA. (C) Quantification by single cell force spectroscopy of adhesion forces developed between Mac-1 HEK293 and HEK293 cells and the P surfaces. The median maximum adhesion force value is shown in red and significance was determined from Wilcoxon rank-sum test. *p<0.05. The scale bars in the lower right corner of each micrograph are 10 μm.
Micropatterned paraffin imparts spatiotemporal control over MGC formation
For the first time, the P surface enabled us to visualize sequential fusion events that led to the formation of MGCs (Supplemental Video 1). However, increasing magnification limited the total field of view. This in turn, decreased the probability of observing MGC formation since macrophage fusion is a spatially stochastic process. Based on previous studies using micropatterned plastic [27], we inferred that it might be possible to spatially confine the fusion process by micropatterning paraffin on optical-quality glass. Micropatterning paraffin in a grid-like pattern (Figure 8A) enabled us to obtain not only extraordinary rates of fusion (59 ± 10%) corresponding to an additional 10% increase in the fusion index compared to the P surface, but a high degree of spatial control over the formation of MGCs (Figure 8B and Supplemental Video 2). The grid system obtained by micropatterned paraffin (MP) enabled also visualization of mixed populations of macrophages expressing eGFP- and mRFP-LifeAct coupled with the ability to definitively show individual MGCs through SEM (Figure 8C).
Figure 8. Micropatterned P surfaces impart a high degree of spatiotemporal control over MGC formation.

(A) Schematic of the method used to create micropattered paraffin prints on glass. Five microliters of a 1 mg/mL solution of paraffin in toluene is dispensed onto the glass surface and a finder grid is placed on the drop. After the solution dries the cover glass is plasma cleaned and only surface covered by the print remains fusogenic. (B) Phase-contrast micrographs show the formation of MGCs on the micropattern. Time (hours:min:sec) is shown in the top right corner of each micrograph. The scale bars are 50 μm. In the final still frame, blue corresponds to Hoechst 33342, which labels nuclei. (C) Correlated light and scanning electron microscopy views of a micropatterned P surface show MGC formation from a mixture of eGFP- and mRFP-LifeAct cells. The scale bar corresponds to 25 μm. (D) Shown are the kinetics of fusion events for 8 hr on the micropatterned P and Permanox surfaces after the onset of fusion (i.e. 9.5 hr after the application of IL-4). Results shown are means ± S.D. from three independent experiments. (E) Quantification of the types of fusion events during MGC formation on the micropatterned P and Permanox surfaces for 8 hr after the onset of fusion. The data are expressed as percent of the total number of fusion events detected on each surface and are means ± S.D. from three experiments. (F) The kinetics of type 1, 2 and 3 fusion events on the micropatterned P surface for 8 hr after the onset of fusion. The data shown are means ± S.D. from three experiments. A 20× field corresponds to 578 × 433 μm.
The use of the MP surface enabled us to reveal the kinetics that govern the formation of MGCs (Figure 8D-F, Supplemental Video 2). Macrophage fusion began at 9.6 ± 0.8 hr after the application of IL-4, at which time a sudden “burst” of fusion was observed. The number of fusion events per hour within the 8 hour imaging window gradually decreased over time (Figure 8D). On average, we observed 125 ± 22 (n=3) fusion events from the onset of fusion over the next 8 hr of observation when sampled with 20× objective magnification (578 μm × 433 μm). After 24 hours in culture, 71 ± 17% of grid intersections contained MGCs. Since macrophage fusion and the formation of MGCs have never been observed, we refer to mononucleated macrophages that undergo fusion with one another as founders. The formation of MGCs followed three distinct patterns. During the initial phase, fusion occurred between founders and accounted for 25 ± 3% of total events (Figure 8E, Supplemental Video 2). We refer to these fusion events as type 1. Concurrent to type 1 fusion, mononucleated macrophages began to fuse with early multinucleated cells (type 2 fusion events) which accounted for 60 ± 1% of total events observed. Fusion between MGCs (type 3 events) accounted for 15 ± 9% of total events (Figure 8E, Supplemental Video 2). While type 1 fusion events ceased after the first 4 hours, type 2 fusion events continued through the entire period of observation. The greatest number of type 2 events occurred during the first 4 hours (Figure 8F), after which time, type 2 of fusion began to decline. Although rare, type 3 fusion events between two multinucleated cells were observed shortly after the initiation of the fusion burst. The peak of type 3 fusion was observed at ∼4 hour and then declined (Figure 8F).
We next investigated whether the pattern of macrophage fusion on the MP surface, as evidenced by the type of fusion events, was comparable to that induced on Permanox. Similar to the MP surface, fusion began 9.3 ± 0.3 hr after the application of IL-4. However, we observed markedly fewer total fusion events (58 ± 14, n=3; Supplemental Video 3) during the next 8 hours. Nevertheless, the relative ratio of the types of events on Permanox was similar (Figure 8E). In contrast to the MP surface, fusion on Permanox remained relatively constant over the 8 hr observation period (Figure 8F). Together, these data suggest that the MP and Permanox surfaces support similar types of fusion events.
Discussion
In this study we describe optical-quality glass surfaces that enabled us to observe macrophage fusion leading to the formation of MGCs in vitro. To our knowledge, no previous study utilized live cell imaging techniques to visualize directly the process of MGC formation. This deficiency is attributed mainly to two facts. First, the most commonly used surfaces that promote macrophage fusion are plastic (e.g. Permanox, polysterene, etc.). However, plastic is not amenable to most live imaging techniques. Second, although optical-quality glass is required for microscopy, it supports very low levels of macrophage fusion [11]. This obstacle makes visualizing rare fusion events nearly impossible. These limitations were overcome by modifying a glass surface to promote high rates of macrophage fusion that at the same time enables the use of advanced imaging techniques. We found that adsorption of oleamide, or other long-chain hydrocarbons, such as those present in paraffin or petrolatum, converted non-fusogenic glass into a fusogenic surface. Micropatterned glass surfaces further increased macrophage fusion and enabled a remarkable degree of spatiotemporal control over MGC formation.
Our fortuitous finding that the FluoroDish glass surface (FD) supported a high degree of macrophage fusion that was comparable to Permanox plastic led us to the discovery of oleamide contamination. The presence of oleamide contamination on the FD surface may not be surprising since oleamide is commonly used as an additive in the production of plasticware. Indeed, studies suggest that oleamide leaches from disposable plastic tubes exerting potent effects on protein activity [28]. However, the ability of oleamide to promote macrophage fusion has not been previously shown. We demonstrate that adsorption of oleamide onto clean glass increased fusion by ∼6-fold. Similar to oleamide, which contains 18 carbon atoms, long (20-40 C) hydrocarbon molecules present in paraffin and petrolatum were equally, if not more active. Characterization of the physicochemical properties of the FD and paraffin-adsorbed surfaces indicated that both surfaces are hydrophobic compared to clean glass (Figure 2C and 6C). In general, hydrophobic surfaces are known to promote macrophage fusion and have been reported in previous studies [4, 22, 29]. Surface roughness is also presumed to affect macrophage fusion [4]. Previous studies that investigated the effect s of surface topology in a foreign body reaction model demonstrated that there was a 500 nm threshold for linear, parallel gratings of poly(∈-caprolactone), poly(lactic acid) and poly(dimethylsiloxane), below which macrophages did not respond [30]. Furthermore, bulk metallic glass nanowhiskers [31] reduced macrophage fusion [23]. Our AFM imaging data revealed the existence of linear arrays of material on both the FD and paraffin-adsorbed surfaces (Figures 2A and 6A). However, the calculated roughness indicated that the surfaces were rather flat since adsorbed material was raised from the surface by ∼10 nm or less. Therefore, consistent with previous work [23, 30, 31], this study observed no clear connection between nanoscale (<100 nm) surface roughness and increased fusion. Although FD surface roughness was ∼2.5-fold higher than paraffin-adsorbed surfaces, the latter was significantly more active. These data suggest that although surface roughness is an important factor, surface chemistry or the pattern of adsorption of long-chain hydrocarbons may be more critical parameters that affect fusion.
In adhesion assays, we found that on the FD and paraffin-adsorbed surfaces Mac-1 integrin supported adhesion of Mac-1 HEK293 cells. Furthermore, Mac-1 apparently mediated spreading since WT, but not Mac-1-deficient macrophages spread rapidly. Mac-1 is a multiligand receptor capable of binding numerous structurally and functionally unrelated molecules and is involved in numerous leukocyte activities, including adhesion, migration, phagocytosis and others [32, 33]. Recently, we and others demonstrated that Mac-1 is essential also for macrophage fusion on Permanox [34-36]. Furthermore, spreading of Mac-1-deficient macrophages on Permanox, but not the integrin binding step was strongly reduced [36]. The latter observation is consistent with data obtained from macrophages plated on the FD surface (Figure 3C and 3C). The ability of Mac-1 to support adhesion to surface adsorbed with oleamide or other molecules containing long hydrocarbons suggests that Mac-1 may bind these molecules and thus directly links Mac-1-mediated recognition with fusion. The molecular basis for the interaction of Mac-1 with oleamide or other hydrocarbon chains is currently under investigation.
The capacity of paraffin-adsorbed glass to promote fusion and retain important optical properties necessary for imaging allowed us to derive insights into the kinetics and morphological features that govern MGC formation. It should be noted that although macrophage fusion on paraffin-adsorbed surfaces is efficient, fusion is spatially stochastic. The randomness associated with the location of fusion makes visualizing MGC formation with high magnification optics challenging. This barrier was mitigated by the use of a paraffin micropattern (MP) which localized fusion to defined regions smaller than the field of view of a high magnification objective. Using this cell system, we observed a “burst” in fusion that commenced ∼9.5 hours after the application of IL-4. This finding suggests that a latent “priming” period is necessary to attain fusion competence. Based on 8 hours of continuous observation after the onset of the “burst” we were able to distinguish three distinct types of fusion events that account for MGC formation. Initially, fusion occurred between mononucleated macrophages (founder events, type 1), which appears to be a prerequisite for the formation of early multinucleated cells. Fusion of mononucleated macrophages with multinucleated cells is defined as type 2 fusion (Figure 8E). Type 2 fusion events were by far the most abundant event that led to MGC formation. Similar to type 1, type 3 fusion events were less frequent. It is interesting to note that macrophage fusion on Permanox, the most fusogenic plastic currently used in the field, was similar in the event type, but not magnitude, to that observed on the MP surface. This indicates that the underlying mechanism responsible for MGC formation on both of these surfaces is similar and underscores the possibility that type 2 fusion is the predominant mechanism of MGC formation. The fact that ∼60% of plated macrophages participated in fusion on MP surface after 24 hours in culture indicates that this subset acquired fusion-competence. Although the transcriptional program required for macrophage “priming” leading to fusion competence is largely unknown, upregulation of several proteins has been detected [37]. The kinetics of fusion determined in the present study will be critical for future studies aimed at identifying key signaling, cytoskeletal and cell surface molecules involved in macrophage fusion.
Despite the long history of research on MGCs there have been no systematic studies to directly visualize fusion using living macrophages [4, 8, 12, 13, 24, 38]. Furthermore, no studies reported to date detected clear ultrastructural features in fusing macrophages that could have provided clues as to how two external plasma membranes fuse [39-41]. Consequently, unlike phagocytosis which has been extensively characterized [42, 43], the cellular and molecular mechanisms involved in macrophage fusion remain elusive. Based on a limited number of electron microscopy data, a model has been proposed that macrophage fusion may involve the phenomenon referred to as “cellocytosis” [44]. According to this model, after attachment of one macrophage to the surface of another, the surface bound macrophage internalizes by sinking. During this process, the internalized cell is enveloped by two plasma membranes, one from the internalizer cell and one being its own plasma membrane. The two membranes then fuse and might be recycled to form the outer plasma membrane of the MGC while the cytoplasm and organelles of both cells are integrated. Thus, the main feature of the “cellocytosis” model is that two external membranes fuse after one cell has been internalized by the other cell. In the present investigation, the fusion process appears to be phenotypically distinct from the “cellocytosis” model. Although we observed mononucleated macrophages shrouded by MGCs, out of >750 fusion events detected on the MP and Permanox surfaces, we observed only two events that may be described as “cellocytosis.” In these rare instances, fusion occurred exclusively on ventral surfaces of the MGC. In the vast majority of events, fusion occurred between intercellular margins with obvious phase-dark protrusions emanating between cells (Supplemental Video 2). Thus, macrophage fusion on Permanox and the MP surfaces in vitro with living specimens does not seems to support the “cellocytosis” model and suggests that the process involves other mechanisms. For example, the formation of a fusion pore between two cells, as proposed in other fusion systems may be a tenable model [45, 46]. We observed also that macrophages were highly motile. This finding lends further support to a view that macrophage migration is essential for fusion [13]. Future analyses of the interface between live macrophages undergoing fusion using the method described in the present study as well advanced live imaging techniques may reveal specific cellular structures that govern fusion between apposing membranes. This, in turn, may lead to a better understanding of the molecular mediators that orchestrate fusion and the materials properties that promote the formation of destructive MGCs.
Conclusions
This study discovered that adsorption of several long-chain hydrocarbons converted nonfusogenic glass into a highly fusogenic substrate amenable to advanced imaging techniques. These surfaces were hydrophobic compared to clean glass and exhibited nanoscale surface roughness. Macrophage adhesion to surfaces adsorbed with long-chain hydrocarbons was more robust compared to clean glass and was dependent on Mac-1 integrin. Micropatterns further increased fusion and imparted a remarkable degree of spatiotemporal control over MGC formation. Using these surfaces and Permanox plastic we show macrophage interaction leading to fusion was initiated between intercellular margins, but not by “cellocytosis.” MGC formation was initiated between founders (type 1), then these multinucleated cells acquired new mononucleated macrophages (type 2) and finally MGCs fused with neighboring MGCs (type 3). We expect the high degree of spatiotemporal control afforded by these modified glass substrates will expedite fundamental studies related to macrophage fusion with implications for the design of materials that prevent the formation of destructive MGCs.
Supplementary Material
Figure S1. Mass spectra of (A) unknown peak from eluate and (B) oleamide standard. Both samples contain identical (within 0.01 m/z) peaks for oleamide and its derivatives.
Figure S2. The P surface supports single-molecule super resolution microscopy (e.g. dSTORM; Figure S2). We observed a dramatic increase in image clarity compared to TIRF when localizations where reconstructed. The scale bar in the lower right corner is 2.5 μm.
Acknowledgments
The authors wish to thank Mr. Tim Karcher for help with materials analysis. We also wish to thank Dr. Page Baluch for use of the EVOS FL Auto housed in the W.M. Keck Bioimaging Facility at ASU. The authors wish to thank members of the Ugarova Laboratory, and folks in the Center for Metabolic and Vascular Biology at Mayo Clinic for helpful discussion of this work. J.F. thanks the instructors at EMBL for teaching photoswitching photophysics (Dr. Mike Heilemann) and the technical aspects of GSDIM (Dr. Marko Lampe) and STED (Dr. Ulf Schwarz). This work was supported by NIH grant HL63199 to T.P.U.
Footnotes
Conflict of interest: The authors report no conflict of interest in this work.
References
- 1.Zhao Q, Topham N, Anderson JM, Hiltner A, Lodoen G, Payet C. Foreign body giant cells and polyurethane biostability: In vivo correlation of cell adhesion and surface cracking. Journal of biomedical materials research. 1991;25:177–83. doi: 10.1002/jbm.820250205. [DOI] [PubMed] [Google Scholar]
- 2.Matheson LA, Santerre JP, Labow RS. Changes in macrophage function and morphology due to biomedical polyurethane surfaces undergoing biodegradation. Journal of cellular physiology. 2004;199:8–19. doi: 10.1002/jcp.10412. [DOI] [PubMed] [Google Scholar]
- 3.Santerre J, Woodhouse K, Laroche G, Labow R. Understanding the biodegradation of polyurethanes: from classical implants to tissue engineering materials. Biomaterials. 2005;26:7457–70. doi: 10.1016/j.biomaterials.2005.05.079. [DOI] [PubMed] [Google Scholar]
- 4.Anderson JM, Rodriguez A, Chang DT. Seminars in immunology. Elsevier; 2008. Foreign body reaction to biomaterials; pp. 86–100. [DOI] [PMC free article] [PubMed] [Google Scholar]
- 5.Brown BN, Sicari BM, Badylak SF. Rethinking regenerative medicine: a macrophage-centered approach. 2014 doi: 10.3389/fimmu.2014.00510. [DOI] [PMC free article] [PubMed] [Google Scholar]
- 6.Ratner BD. Healing with medical implants: The body battles back. Science Translational Medicine. 2015;7:272fs4. doi: 10.1126/scitranslmed.aaa5371. [DOI] [PubMed] [Google Scholar]
- 7.Scatena M, Eaton KV, Jackson MF, Lund SA, Giachelli CM. The Immune Response to Implanted Materials and Devices. Springer; 2017. Macrophages: The Bad, the Ugly, and the Good in the Inflammatory Response to Biomaterials; pp. 37–62. [Google Scholar]
- 8.Anderson JM, Jiang S. The Immune Response to Implanted Materials and Devices. Springer; 2017. Implications of the Acute and Chronic Inflammatory Response and the Foreign Body Reaction to the Immune Response of Implanted Biomaterials; pp. 15–36. [Google Scholar]
- 9.McInnes A, Rennick DM. Interleukin 4 induces cultured monocytes/macrophages to form giant multinucleated cells. The Journal of experimental medicine. 1988;167:598–611. doi: 10.1084/jem.167.2.598. [DOI] [PMC free article] [PubMed] [Google Scholar]
- 10.McNally AK, Anderson JM. Interleukin-4 induces foreign body giant cells from human monocytes/macrophages. Differential lymphokine regulation of macrophage fusion leads to morphological variants of multinucleated giant cells. The American journal of pathology. 1995;147:1487. [PMC free article] [PubMed] [Google Scholar]
- 11.Jenney CR, DeFife KM, Colton E, Anderson JM. Human monocyte/macrophage adhesion, macrophage motility, and IL-4-induced foreign body giant cell formation on silane-modified surfaces in vitro. Journal of biomedical materials research. 1998;41:171–84. doi: 10.1002/(sici)1097-4636(199808)41:2<171::aid-jbm1>3.0.co;2-f. [DOI] [PubMed] [Google Scholar]
- 12.Helming L, Gordon S. The molecular basis of macrophage fusion. Immunobiology. 2008;212:785–93. doi: 10.1016/j.imbio.2007.09.012. [DOI] [PubMed] [Google Scholar]
- 13.Helming L, Gordon S. Molecular mediators of macrophage fusion. Trends in cell biology. 2009;19:514–22. doi: 10.1016/j.tcb.2009.07.005. [DOI] [PubMed] [Google Scholar]
- 14.Riedl J, Flynn KC, Raducanu A, Gärtner F, Beck G, Bösl M, et al. Lifeact mice for studying F-actin dynamics. Nature methods. 2010;7:168–9. doi: 10.1038/nmeth0310-168. [DOI] [PubMed] [Google Scholar]
- 15.Lishko VK, Yakubenko VP, Ugarova TP. The interplay between integrins α M β 2 and α 5 β 1 during cell migration to fibronectin. Experimental cell research. 2003;283:116–26. doi: 10.1016/s0014-4827(02)00024-1. [DOI] [PubMed] [Google Scholar]
- 16.Safiullin R, Christenson W, Owaynat H, Yermolenko IS, Kadirov MK, Ros R, et al. Fibrinogen matrix deposited on the surface of biomaterials acts as a natural anti-adhesive coating. Biomaterials. 2015;67:151–9. doi: 10.1016/j.biomaterials.2015.07.007. [DOI] [PMC free article] [PubMed] [Google Scholar]
- 17.Christenson W, Yermolenko I, Plochberger B, Camacho-Alanis F, Ros A, Ugarova T, et al. Combined single cell AFM manipulation and TIRFM for probing the molecular stability of multilayer fibrinogen matrices. Ultramicroscopy. 2014;136:211–5. doi: 10.1016/j.ultramic.2013.10.009. [DOI] [PMC free article] [PubMed] [Google Scholar]
- 18.Faust JJ, Doudrick K, Yang Y, Westerhoff P, Capco DG. Food grade titanium dioxide disrupts intestinal brush border microvilli in vitro independent of sedimentation. Cell biology and toxicology. 2014;30:169–88. doi: 10.1007/s10565-014-9278-1. [DOI] [PubMed] [Google Scholar]
- 19.van de Linde S, Löschberger A, Klein T, Heidbreder M, Wolter S, Heilemann M, et al. Direct stochastic optical reconstruction microscopy with standard fluorescent probes. Nature protocols. 2011;6:991–1009. doi: 10.1038/nprot.2011.336. [DOI] [PubMed] [Google Scholar]
- 20.Olivier N, Keller D, Rajan VS, Gönczy P, Manley S. Simple buffers for 3D STORM microscopy. Biomedical optics express. 2013;4:885–99. doi: 10.1364/BOE.4.000885. [DOI] [PMC free article] [PubMed] [Google Scholar]
- 21.Wolter S, Löschberger A, Holm T, Aufmkolk S, Dabauvalle MC, van de Linde S, et al. rapidSTORM: accurate, fast open-source software for localization microscopy. Nature methods. 2012;9:1040–1. doi: 10.1038/nmeth.2224. [DOI] [PubMed] [Google Scholar]
- 22.Jenney CR, Anderson JM. Alkylsilane-modified surfaces: Inhibition of human macrophage adhesion and foreign body giant cell formation. Journal of biomedical materials research. 1999;46:11–21. doi: 10.1002/(sici)1097-4636(199907)46:1<11::aid-jbm2>3.0.co;2-y. [DOI] [PubMed] [Google Scholar]
- 23.Padmanabhan J, Augelli MJ, Cheung B, Kinser ER, Cleary B, Kumar P, et al. Regulation of cell-cell fusion by nanotopography. Scientific Reports. 2016;6 doi: 10.1038/srep33277. [DOI] [PMC free article] [PubMed] [Google Scholar]
- 24.Saltzman WM, Kyriakides TR. Cell interactions with polymers. Principles of tissue engineering. 1997:3. [Google Scholar]
- 25.Yakubenko VP, Lishko VK, Lam SCT, Ugarova TP. A molecular basis for integrin αMβ2 ligand binding promiscuity. Journal of Biological Chemistry. 2002;277:48635–42. doi: 10.1074/jbc.M208877200. [DOI] [PubMed] [Google Scholar]
- 26.Podolnikova NP, Podolnikov AV, Haas TA, Lishko VK, Ugarova TP. Ligand Recognition Specificity of Leukocyte Integrin αMβ2 (Mac-1, CD11b/CD18) and Its Functional Consequences. Biochemistry. 2015;54:1408–20. doi: 10.1021/bi5013782. [DOI] [PMC free article] [PubMed] [Google Scholar]
- 27.DeFife KM, Colton E, Nakayama Y, Matsuda T, Anderson JM. Spatial regulation and surface chemistry control of monocyte/macrophage adhesion and foreign body giant cell formation by photochemically micropatterned surfaces. Journal of biomedical materials research. 1999;45:148–54. doi: 10.1002/(sici)1097-4636(199905)45:2<148::aid-jbm10>3.0.co;2-u. [DOI] [PubMed] [Google Scholar]
- 28.McDonald GR, Hudson AL, Dunn SM, You H, Baker GB, Whittal RM, et al. Bioactive contaminants leach from disposable laboratory plasticware. Science. 2008;322:917. doi: 10.1126/science.1162395. [DOI] [PubMed] [Google Scholar]
- 29.Jenney CR, Anderson JM. Effects of surface-coupled polyethylene oxide on human macrophage adhesion and foreign body giant cell formation in vitro. Journal of biomedical materials research. 1999;44:206–16. doi: 10.1002/(sici)1097-4636(199902)44:2<206::aid-jbm11>3.0.co;2-d. [DOI] [PubMed] [Google Scholar]
- 30.Chen S, Jones JA, Xu Y, Low HY, Anderson JM, Leong KW. Characterization of topographical effects on macrophage behavior in a foreign body response model. Biomaterials. 2010;31:3479–91. doi: 10.1016/j.biomaterials.2010.01.074. [DOI] [PMC free article] [PubMed] [Google Scholar]
- 31.Padmanabhan J, Kinser ER, Stalter MA, Duncan-Lewis C, Balestrini JL, Sawyer AJ, et al. Engineering cellular response using nanopatterned bulk metallic glass. ACS nano. 2014;8:4366–75. doi: 10.1021/nn501874q. [DOI] [PMC free article] [PubMed] [Google Scholar]
- 32.Coxon A, Rieu P, Barkalow FJ, Askari S, Sharpe AH, von Andrian UH, et al. A novel role for the β2 integrin CD11b/CD18 in neutrophil apoptosis: a homeostatic mechanism in inflammation. Immunity. 1996;5:653–66. doi: 10.1016/s1074-7613(00)80278-2. [DOI] [PubMed] [Google Scholar]
- 33.Lu H, Smith CW, Perrard J, Bullard D, Tang L, Shappell SB, et al. LFA-1 is sufficient in mediating neutrophil emigration in Mac-1-deficient mice. Journal of Clinical Investigation. 1997;99:1340. doi: 10.1172/JCI119293. [DOI] [PMC free article] [PubMed] [Google Scholar]
- 34.McNally AK, Anderson JM. β1 and β2 integrins mediate adhesion during macrophage fusion and multinucleated foreign body giant cell formation. The American journal of pathology. 2002;160:621–30. doi: 10.1016/s0002-9440(10)64882-1. [DOI] [PMC free article] [PubMed] [Google Scholar]
- 35.Milde R, Ritter J, Tennent GA, Loesch A, Martinez FO, Gordon S, et al. Multinucleated giant cells are specialized for complement-mediated phagocytosis and large target destruction. Cell reports. 2015;13:1937–48. doi: 10.1016/j.celrep.2015.10.065. [DOI] [PMC free article] [PubMed] [Google Scholar]
- 36.Podolnikova NP, Kushchayeva YS, Wu Y, Faust J, Ugarova TP. The Role of Integrins α M β 2 (Mac-1, CD11b/CD18) and α D β 2 (CD11d/CD18) in Macrophage Fusion. The American journal of pathology. 2016;186:2105–16. doi: 10.1016/j.ajpath.2016.04.001. [DOI] [PMC free article] [PubMed] [Google Scholar]
- 37.Martinez FO, Helming L, Milde R, Varin A, Melgert BN, Draijer C, et al. Genetic programs expressed in resting and IL-4 alternatively activated mouse and human macrophages: similarities and differences. Blood. 2013;121:e57–e69. doi: 10.1182/blood-2012-06-436212. [DOI] [PubMed] [Google Scholar]
- 38.Vignery A. Macrophage fusion the making of osteoclasts and giant cells. The Journal of experimental medicine. 2005;202:337–40. doi: 10.1084/jem.20051123. [DOI] [PMC free article] [PubMed] [Google Scholar]
- 39.Papadimitriou J, Ashman R. Macrophages: current views on their differentiation, structure, and function. Ultrastructural pathology. 1989;13:343–72. doi: 10.3109/01913128909048488. [DOI] [PubMed] [Google Scholar]
- 40.Papadimitriou J, Kingston KJ. The locomotory behaviour of the multinucleate giant cells of foreign body reactions. The Journal of pathology. 1977;121:27–36. doi: 10.1002/path.1711210105. [DOI] [PubMed] [Google Scholar]
- 41.Murch A, Grounds MD, Marshall C, Papadimitriou J. Direct evidence that inflammatory multinucleate giant cells form by fusion. The Journal of pathology. 1982;137:177–80. doi: 10.1002/path.1711370302. [DOI] [PubMed] [Google Scholar]
- 42.Aderem A. Phagocytosis and the inflammatory response. Journal of Infectious Diseases. 2003;187:S340–5. doi: 10.1086/374747. [DOI] [PubMed] [Google Scholar]
- 43.Niedergang F. Phagocytosis. Encyclopedia of Cell Biology. 2016;2:751–7. [Google Scholar]
- 44.Vignery A. Macrophage fusion: are somatic and cancer cells possible partners? Trends in cell biology. 2005;15:188–93. doi: 10.1016/j.tcb.2005.02.008. [DOI] [PubMed] [Google Scholar]
- 45.Chen EH. Invasive podosomes and myoblast fusion. Current topics in membranes. 2011;68:235. doi: 10.1016/B978-0-12-385891-7.00010-6. [DOI] [PMC free article] [PubMed] [Google Scholar]
- 46.Sens KL, Zhang S, Jin P, Duan R, Zhang G, Luo F, et al. An invasive podosome-like structure promotes fusion pore formation during myoblast fusion. The Journal of cell biology. 2010;191:1013–27. doi: 10.1083/jcb.201006006. [DOI] [PMC free article] [PubMed] [Google Scholar]
Associated Data
This section collects any data citations, data availability statements, or supplementary materials included in this article.
Supplementary Materials
Figure S1. Mass spectra of (A) unknown peak from eluate and (B) oleamide standard. Both samples contain identical (within 0.01 m/z) peaks for oleamide and its derivatives.
Figure S2. The P surface supports single-molecule super resolution microscopy (e.g. dSTORM; Figure S2). We observed a dramatic increase in image clarity compared to TIRF when localizations where reconstructed. The scale bar in the lower right corner is 2.5 μm.