

Summary
The transition from castration resistant prostate adenocarcinoma (CRPC) to neuroendocrine prostate cancer (NEPC) has emerged as an important mechanism of treatment resistance. NEPC is associated with over-expression and gene amplification of MYCN (encoding N-Myc). N-Myc is an established oncogene in several rare pediatric tumors, but its role in prostate cancer progression is not well established. Integrating a genetically engineered mouse model and human prostate cancer transcriptome data, we show that N-Myc over-expression leads to the development of poorly differentiated, invasive prostate cancer that is molecularly similar to human NEPC. This includes an abrogation of AR signaling and induction of Polycomb Repressive Complex 2 signaling. Altogether, our data establishes N-Myc as an oncogenic driver of NEPC.
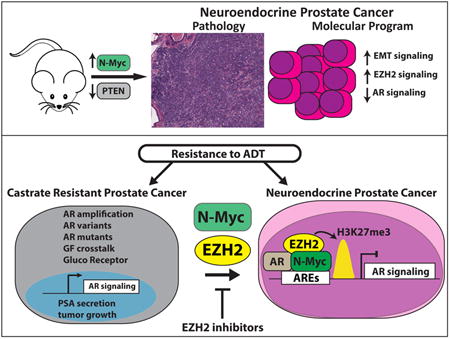
Graphical abstract
Dardenne et al. demonstrate that N-Myc overexpression in pre-clinical models drives aggressive prostate cancer that mimics human neuroengocrine prostate cancer, including reduced AR signaling and enhanced PRC2 target gene repression, and sensitizes cells to an Aurora-A inhibitor and EZH2 SET domain inhibitors.
Introduction
Neuroendocrine prostate cancer (NEPC) is a subtype of castration resistant prostate cancer associated with aggressive clinical features and poor overall survival (Wang et al., 2014). Mounting evidence suggests that NEPC evolves from prostate adenocarcinoma as one mechanism of resistance to androgen receptor (AR)-directed therapies (e.g. abiraterone or enzalutamide). Data from metastatic biopsies obtained from patients progressing on abiraterone or enzalutamide suggests that at least 10% of patients with late stage castrate resistant prostate adenocarcinoma (CRPC) eventually develop small cell NEPC (Small et al., 2016). NEPC tumors share common genomic alterations with CRPC. ERG rearrangements and PTEN deletions are present in about 50% (Cancer Genome Atlas Research, 2015; Lotan et al., 2011) and 63% (Mosquera et al., 2013; Tan et al., 2014) of NEPC, respectively, and comparable to CRPC (Robinson et al., 2015). The cell plasticity associated with NEPC is associated with decreased or absent expression of the AR and downstream androgen-regulated genes such as prostate specific antigen (PSA). NEPC typically express markers of the neuroendocrine lineage (e.g., neuronal specific enolase (NSE), chromogranin A (CGA) or synaptophysin (SYP)) and is associated with the acquisition of distinct genomic alterations (e.g., RB1 loss and mutation (Tan et al., 2014) or deletion of TP53), epigenomic alterations, dysregulation of specific pathways including neuronal and stem cell programs and epithelial-mesenchymal transition (EMT) (Beltran et al., 2016).
We previously reported significant co-overexpression and gene amplification of AURKA (Aurora A) and MYCN (N-Myc) in NEPC tumors (Beltran et al., 2011; Mosquera et al., 2013). Independent of its catalytic activity, Aurora-A forms a complex with and stabilizes with N-Myc (Otto et al., 2009), which can be targeted using allosteric Aurora-A inhibitors (Brockmann et al., 2013; Gustafson et al., 2014). In neuroblastoma, the most common extracranial solid cancer in childhood, MYCN amplification is an important clinical biomarker, and is associated with poor prognosis (Grimmer and Weiss, 2006). We have shown that over-expression of N-Myc in prostate adenocarcinoma cells is associated with the development of neuroendocrine features (Beltran et al., 2011).
To further characterize the functional role of N-Myc as a potential driver of prostate cancer and its role in NEPC, we developed pre-clinical models including isogenic cell lines, xenografts, genetically engineered mice (GEM) and tumor organoids cultures over-expressing N-Myc.
Results
N-Myc is expressed in NEPC and a subset of CRPC clinical samples
We previously reported significant overexpression and gene amplification of MYCN in 7 NEPC compared to 30 localized prostate adenocarcinoma (PCa) tumors (Beltran et al., 2011). Based on an extended next-generation RNA sequencing (RNA-seq) dataset (n = 155), we observed that N-Myc is also over-expressed in NEPC (n = 21) compared to CRPC (n = 32) samples (Figure 1A). However, there is a spectrum of N-Myc expression in CRPC samples with 20% (n = 6) of CRPC tumors demonstrating transcript levels in the range of NEPC. We evaluated AR signaling status (based on a previously described AR signature (Hieronymus et al., 2006)) and NEPC biomarkers across our clinical cohorts including castration resistant adenocarcinoma (CRPC) and NEPC. In our dataset, high N-Myc expression was associated with, on average, decreased AR and suppressed AR target gene expression (e.g., KLK3, NKX3.1) in NEPC as well as in CRPC samples (Figure 1B, S1A, B). We found a consistent difference in the correlation between N-Myc expression and NEPC biomarkers in NEPC compared to that observed in CRPC; Figure 1B shows higher Pearson correlation coefficients in NEPC for NEPC biomarkers (chromogranin A (CHGA, p value = 0.04), neuronal specific enolase (ENO2, p-value = 0.005), neural cell adhesion molecule (NCAM1, p-value = 0.04), Aurora Kinase A (AURKA, p-value = 0.03)) and lower coefficients for AR-regulated genes (e.g. Prostate Specific Antigen (KLK3, p-value = 0.02)) and RB1, as expected. In addition, we found that N-Myc expression is also highly correlated with a recently described molecular classifier of NEPC (r = 0.63, p-value < 1e-20) (Beltran et al., 2016).
Figure 1. MYCN expression in prostate cancer.
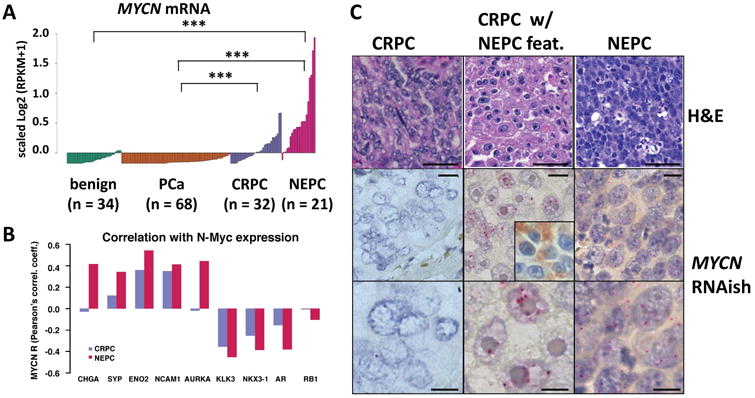
A. MYCN mRNA level in 34 benign prostate, 68 prostate adenocarcinoma (PCa), 32 castrate resistant prostate adenocarcinoma (CRPC) and 21 neuroendocrine prostate cancer (NEPC) clinical samples. (*** p-value < 2.17e-05, Wilcoxon test) B. Pearson's correlation coefficients between the gene expression level of MYCN and AR target genes or NE marker genes in CRPC or NEPC samples; * p-value < 0.05. C. RNA in situ hybridization (RNAish, red chromogen) of MYCN RNA in representative CRPC, CRPC with neuroendocrine features (inset: chromogranin A IHC), and NEPC case. (Original magnification: 20× for H&E (scale bar = 50 um, top), and 40× (scale bar = 25 um, center) and 100× scale bar = 10 um, bottom) for RNAish. See also Figure S1.
To better understand the relationship between N-Myc and the NEPC phenotype at the cellular level, we performed immunohistochemistry for N-Myc protein expression in CRPC and NEPC human tissue samples using multiple commercially available N-Myc antibodies. However, none of these antibodies demonstrated sufficient specificity in prostate tissue (data not shown). To overcome this, we developed an in situ hybridization (RNAish) probe for MYCN mRNA expression (Mosquera, Rubin, unpublished). We confirmed abundant levels of MYCN mRNA in NEPC tumor cells and in CRPC tumors with focal neuroendocrine differentiation (representative cases are shown in Figure 1C and Figure S1C). Together, these data confirm that N-Myc is abundantly expressed in clinical samples that display a NEPC phenotype. Based on these and earlier pre-clinical findings (Beltran et al., 2011), we hypothesized that N-Myc over-expression is a driver of the aggressive neuroendocrine phenotype in prostate cancer.
N-Myc over-expression is associated with highly proliferative, invasive prostate cancer with NE features
High-grade neuroendocrine carcinomas (e.g. neuroblastoma, NEPC and small cell carcinomas of lung and bladder) are aggressive and highly proliferative tumors. To determine if N-Myc increases tumor growth rate, we generated xenografts from 22Rv1 cells with and without N-Myc overexpression. 22Rv1-N-Myc xenografts grew at a significantly higher rate as compared to control 22Rv1 xenografts based on cell viability (p-value = 0.02, Student's T Test) and, in a larger cohort of mice, based on tumor size (p-value = 1e-9, Student's T Test Figure S2A). To further determine if N-Myc plays a causal role in driving the NEPC phenotype, we generated GEM mice that carry a CAG-driven lox-stop-lox human MYCN gene integrated into the ROSA26 (LSL-MYCN) locus (Althoff et al., 2015) and a Tmprss2 driven tamoxifen-activated Cre recombinase (T2-Cre (Gao et al., 2016)). Within the prostate, T2-Cre specifically mediates Cre recombination in luminal cells (Gao et al., 2016). Since PTEN deletion is a frequent alteration in CRPC (50% (Robinson et al., 2015)) and PI3K/AKT signaling can enhance N-Myc protein stability (Chesler et al., 2006), we also engineered the mice to harbor a Pten conditional knockout allele (Chen et al., 2013).
In T2-Cre+/+; Ptenf/+; LSL-MYCN+/+ mice, N-Myc was over-expressed in the prostate at 5 weeks after Cre induction by tamoxifen compared to non-induced littermates (Figure S2B), and this was maintained at 3 months post-induction (Figure S2C, S3B). N-Myc over-expression in the context of Ptenf/+ led to focal mouse high-grade prostatic intraepithelial neoplasia (mHGPIN) at 3 and 6 months post-induction (Figure S2D). Non-induced mice or induced littermates that harbor Ptenf/+ alone did not demonstrate mouse PIN at up to 1 year post-induction. In the context of Pten null (Ptenf/f), N-Myc expression was associated with diffuse mHGPIN in the ventral and dorsolateral prostate lobes at 3 months post-induction (Figure S3A). The mHGPIN was characterized by the proliferation of cells with nuclear atypia and mitotic figures, expanding throughout the glands, imparting irregular borders and inducing a mild stromal response, and incipient necrosis. Littermates that harbor Ptenf/f alone also displayed diffuse mHGPIN but were less expansive with more well-defined gland borders and less nuclear atypia. As expected, all Ptenf/f mice displayed high levels of AKT pathway activity based on phosphorylation of AKT at amino acid S473 (pAKT, Figure S3D). At 9 months post-induction (T2-Cre+/+; Ptenf/f; LSL-MYCN+/+), N-Myc over-expression resulted in large, invasive tumors with a variety of morphologies including foci of AR-positive adenocarcinoma (Figure S3E) and foci of poorly differentiated carcinoma with divergent differentiation (e.g., intestinal (20% of the tumor), squamous (5%) or sarcomatoid (35%)). The foci of sarcomatoid differentiation were characterized by the presence of atypical spindle cells as well as pleomorphic epithelioid cells, consistent with an aggressive behavior. By IHC, these areas of sarcomatoid differentiation, exhibited overexpression of the mesenchymal marker vimentin, an absence of pan-cytokeratin expression, and variable levels of AR expression, suggesting an EMT phenotype. These features have been described in a reconstitution model of NEPC using forward engineered benign human prostate cells (Lee et al., 2016) and of lethal prostate cancer undergoing EMT (Martin et al., 2011), and are rare histologic subtypes in prostate cancer that can arise alone or in the context of classic adenocarcinoma, associated with resistance to hormonal therapy, and carry poor prognosis (Humphrey, 2012; Mott, 1979; Parwani et al., 2004).
Tmprss2 is expressed at low levels in mouse liver (Figure S2B) and starting at 6 months post-tamoxifen induction, T2-Cre+/+; Ptenf/f; LSL-MYCN+/+ and T2-Cre+/+; Ptenf/+; LSL-MYCN+/+ mice became moribund with massive, multi-focal liver tumors, resulting in a median survival of 117 and 243 days, respectively. Interestingly, these tumors contained small cell neuroendocrine carcinoma foci in T2-Cre+/+; Ptenf/f; LSL-MYCN+/+ liver (Figure S3C). As an alternative, we generated additional N-Myc GEM using the Pb-Cre4 allele (Pb-Cre) (Wu et al., 2001). N-Myc over-expression alone resulted in focal mHGPIN at 12 months of age (Table S1). However, in the context of Pten null, N-Myc over-expression (Pb-Cre+/-; Ptenf/f; LSL-MYCN+/+), large, intracystic prostatic adenocarcinomas with a variety of morphologies were observed by 3 months of age including foci of AR-positive adenocarcinoma (Figure 2A), foci of poorly differentiated carcinoma with divergent differentiation (i.e., intestinal, squamous or sarcomatoid), and foci of more crowded, basophilic cells with more condensed nuclei and less cytoplasm (Figure 2A). In the context of Pten heterozygous loss (Pb-Cre+/-; Ptenf/+; LSL-MYCN+/+), N-Myc over-expression resulted in large invasive carcinomas with foci containing AR-positive adenocarcinoma, divergent differentiation, or AR-negative NEPC tumor cells at 14 months of age, one of which, was observed to have invaded the bladder (Figure 2B). The NEPC foci displayed high levels of MYCN RNA based on MYCN RNAish at levels similar to what is observed in MYCN-amplified neuroblastoma cases (Figure S2F). Age-matched (14-month Pb-Cre+/-; Ptenf/+; LSL-MYCN-/- and 3-month Pb-Cre; Ptenf/f; LSL-MYCN-/-) littermates display focal and diffuse mHGPIN, respectively, without divergent differentiation or NEPC features (Figure S2G) consistent with previous studies (Chen et al., 2013), suggesting a role for N-Myc in driving sarcomatoid, intestinal and neuroendocrine differentiation (Figure S2H-K). Interestingly, the foci of intestinal differentiation within the invasive carcinoma demonstrated scattered chromogranin A positive cells, which has been reported in a minority (30-40%) of colon cancers but is seen in all foci of intestinal differentiation in the N-Myc mice (Figure S2K). We did not observe colon cancer at any age in any of the Pb-Cre, N-Myc overexpressing mice. Compared to the roughly 100-week average survival time for Pb-Cre+/-; Ptenf/f previously reported (Chen et al., 2013), average survival time for Pb-Cre+/-; Ptenf/f; LSL-MYCN+/+ mice was 32 weeks (Figure S2H).
Figure 2. N-Myc over-expression is associated with aggressive, NEPC-like prostate cancer.
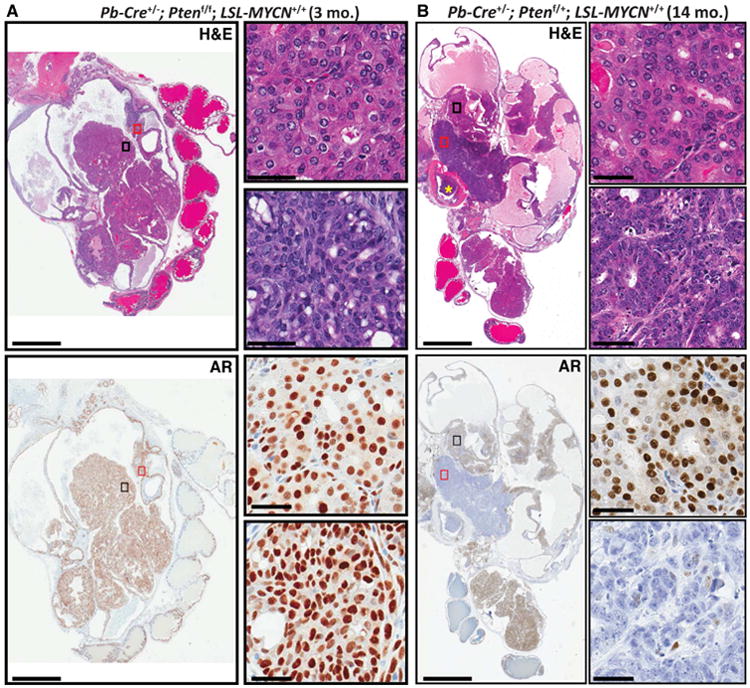
A Photomicrograph images of H&E stained (top) or AR IHC (bottom) prostate tissue showing AR-positive intracystic carcinoma foci (black rectangle) and AR-positive basophilic foci (red rectangle), at low magnification (left, original magnification 4×, scale bar = 5 mm) and at high magnification (right, original magnification 40×, scale bar = 50 um); from a 3-month old Pb-Cre+/-; Ptenf/f; LSL-MYCN+/+. B. Photomicrograph images of H&E stained (top) or AR IHC (bottom) prostate tissue showing invasive, AR-positive adenocarcinoma foci (black rectangle) and AR-negative NEPC foci (red rectangle), at low magnification (left, original magnification 4×, scale bar = 5 mm) with bladder invasion (yellow asterisk) and at high magnification (right, original magnification 40×, scale bar = 50 um); from a 3-month old Pb-Cre+/-; Ptenf/f; LSL-MYCN+/+. See also Figures S2 S3 and Table S1, S2, S3.
N-Myc signatures derived from the N-Myc mouse and human models are clinically representative of NEPC
To determine the clinical relevance of the N-Myc mouse models, we performed RNA-seq from frozen mHGPIN lesions from 3 month post-induction, T2-Cre+/+; Ptenf/f; LSL-MYCN+/+ or control T2-Cre+/+; Ptenf/f; LSL-MYCN-/- mice. Differential expression analysis identified a set of 918 genes associated with N-Myc expression (779 of those map to human homologue genes, Table S2). Since N-Myc is also over-expressed in a subset of CRPC and to address the clinical relevance of the mouse model, we used the mouse N-Myc signature to query a combined cohort of 203 well-characterized CRPC and NEPC samples from two published studies (Beltran et al., 2016; Robinson et al., 2015). Hierarchal clustering of the 203 human samples based on the 779 genes segregated the samples into 2 groups, one of which was significantly enriched with NEPC samples based on pathological criteria, low AR signaling, and high Integrated NEPC score from a recently defined multi-gene molecular classifier of NEPC (Beltran et al., 2016) (Figure 3A and Figure S2E, hypergeometric test and Fisher Exact Test). To determine the generalizability of prostate N-Myc driven features, we queried neuroblastoma (NB) transcriptomes for the prostate N-Myc signature. Neuroblastoma is a high grade neuroendocrine tumor, where only a subset of tumors demonstrate high MYCN amplification. Based on principal component analysis that included 498 NB samples, the mouse N-Myc signature segregated the neuroblastoma samples according to their MYCN amplification status and the NEPC samples were clustered closer to the MYCN amplified NB samples compared to the non-MYCN amplified NB samples (MYCN WT, Figure 3B). These findings support N-Myc as a potentially shared driving event in a subset of neuroendocrine cancers.
Figure 3. Mouse N-Myc signature is clinically relevant.
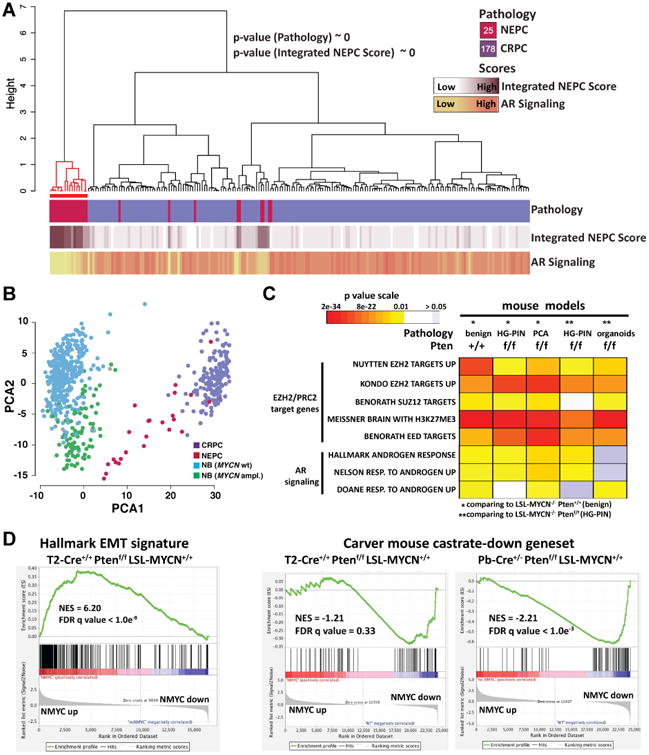
A Ward's hierarchical clustering of the normalized FPKM values of the 779 prioritized genes across 203 CRPCs samples from two independent cohorts (IPM Cornell 2011-15, SU2C-PCF 2015). Shown p-values results from the hyper-geometric test on CRPC-NE enriched cluster (red color). Pearson's correlation was used as distance measure for samples. Annotation tracks report pathology classification (top), values of Integrated NEPC Score (middle) and AR Signaling (bottom) (Darker colors indicate higher scores). The number of samples for each pathology classification is reported inside the square symbols of the corresponding legend. Red line indicates a subgroup enriched with pathology and NEPC score compared to rest of samples (hypergeometric mean p values are shown). The mouse N-Myc signature segregated the human samples into 2 groups, one significantly enriched with CRPC-NE samples based on pathological criteria (p value <10-20, hypergeometric test) that have high NEPC scores (p value ∼ 0, hypergeometric test). B. Projection of the expression levels of the 779 signature genes onto the first and second principal components analysis (PCA) of the 701 tumor samples RNA-seq data including 498 neuroblastoma (NB) samples (Zhang et al., 2015). Colors indicate tumor classes (CRPC, NEPC, NB with amplified MYCN, NB with WT MYCN). C. Heatmap of GSEA FDR q-values of AR induced genes and multiple PRC2 target gene sets that are significantly enriched in the N-Myc down-regulated genes identified in the indicated N-Myc expressing mouse genotypes compared to their non-N-Myc expressing counterparts. D. Right: GSEA enrichment plot of the hallmark EMT gene set with the corresponding statistical metrics shown; Left: GSEA enrichment plot of the Carver mouse gene set that represent genes that are down-regulated in mouse prostates cancer following castration (Carver et al., 2011). See also Figures S3 and Tables S2, S3.
To determine if N-Myc regulates specific NEPC-associated molecular programs in the mouse model, we performed Gene Set Enrichment Analysis (GSEA) using the mouse N-Myc gene expression profile. Importantly, we found that N-Myc over-expression was associated with an induction of EMT genes (FDR q-value < 1.0e-08, e.g. vimentin, Figure 3D, Figures S2K, S3E and Table S3) and a down-regulation of AR signaling (FDR q-value < 1.0e-06, e.g. Fkbp5 (Figure 3C, D) and of PRC2 target genes (FDR q-value < 1.0e-06, Figure 3C and Table S3)). We also found that the N-Myc signature was enriched with genes associated with RB1 and TP53 loss (FDR q-value < 4.4e-07, Table S3), which are also features of the NEPC molecular program (Beltran et al., 2016; Chen et al., 2012; Tan et al., 2014; Zhou et al., 2006). To determine the robustness of these findings, we generated RNAseq data from Pb-Cre mouse prostate tissue samples that differ in terms of Pten status (2 copies, 1 copy or null) and that varied in terms the degree of prostate pathology, from benign prostate (Pb-Cre+/-; Pten+/+; LSL-MYCN+/+) to invasive prostate cancer (Pb-Cre+/-; Ptenf/f; LSL-MYCN+/+). We found that N-Myc drives a molecular signature that is associated with enrichment of PRC2/EZH2 targets, suppression of AR signaling (based on both human AR gene sets and a mouse-defined AR signaling gene set (Carver et al., 2011)), and up-regulation of EMT genes (Figure 3C, D and Table S3) across all N-Myc mouse models.
To test these findings in human prostate cancer models, we performed RNA-seq from multiple stable LNCaP or 22Rv1 cell populations over-expressing N-Myc or an empty vector control (Figure S4A). We identified 277 genes for LNCaP+/-N-Myc cells and 1,997 genes for 22Rv1+/-N-Myc cells that were differentially expressed in the context of N-Myc expression and, as with the mouse RNAseq data, that were clinically representative (Figure 4A, Table S4, Figure S4B, C). GSEA of the LNCaP-N-Myc gene expression profile showed an enrichment of AR-induced genes (e.g. TMPRSS2, FKBP5, PSA, GSEA FDR q-value = 2.60e-19, Table S3), and PRC2 repressed genes (e.g. EZH2 targets, FDR q-value = 5.01e-09) among the N-Myc down-regulated genes. Based on our RNAseq analysis, we defined a 22Rv1-N-Myc signature that, like the LNCaP N-Myc signature, the 22Rv1-N-Myc down-regulated genes were significantly enriched with EZH2/PRC2 target genes (FDR q-value < 1.4E-12) and AR induced genes (FDR q-value < 1.4E-03, Figure 4A, Table S2) while the N-Myc up-regulated genes were enriched with N-Myc target genes in neuroblastoma (FDR q-value = 8.97E-82), EMT gene sets (FDR q-value = 3.9E-05, Table S3), embryonic stem cell gene sets (FDR q-value = 5.15E-38), and genes induced following RB1 loss (FDR q-value = 6.01E-21), all of which are molecular features associated with NEPC (Beltran et al., 2016; Beltran et al., 2011; Lee et al., 2016). Taken together, N-Myc regulates a molecular program that is consistent between NEPC human tissue samples and our N-Myc prostate cancer mouse model.
Figure 4. N-Myc signature in LNCaP cells is clinically relevant and exhibits a dramatic down-regulation of AR signaling.
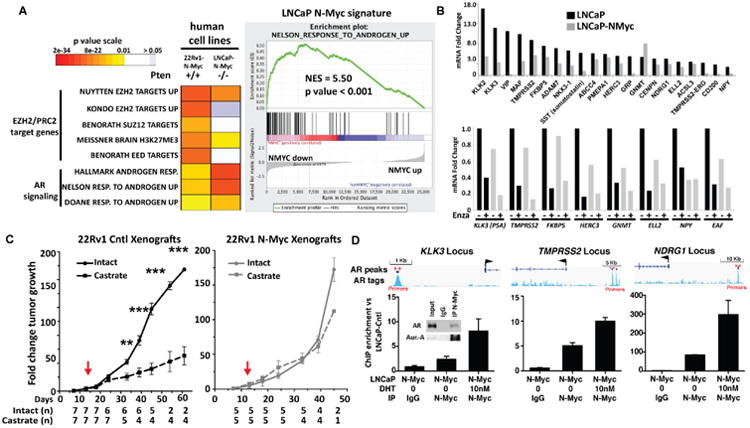
A Left: Heatmap of GSEA FDR q-values as shown in (Fig. 3) of AR induced genes and multiple PRC2 target gene sets that are significantly enriched in the N-Myc de-regulated genes identified in the indicated N-Myc expressing human prostate cancer cell types with the indicated PTEN status compared to their non-N-Myc expressing counterparts. Right: GSEA enrichment plot of the Nelson Response to Androgen geneset (Nelson et al., 2002) in the ranked N-Myc signature showing the most significantly enriched gene sets. B. Nanostring data of AR target gene expression fold induction by androgen (24 hours, 10 nM DHT) in the indicated cell line. C. The fold change in growth rate of 22Rv1 control (Cntl, left) or N-Myc (right) xenografts (average +/- standard error mean (SEM)) in castrate (dashed lines) or intact (solid lines) mice. Each tumor size at each time point was normalized to values obtained at 1 week before the day of castration (p-value < 0.0002, Student's T test). D. ChIP-PCR for N-Myc at known AR enhancers for indicated genes following 48 hours growth in charcoal stripped serum with or without 24 hours of 10 nM DHT (inset: Co-IP of N-Myc from LNCaP-N-Myc cells showing the interaction between N-Myc and AR and Aurora-A as a positive control). See also Figure S4 and Tables S3, S4, S5.
N-Myc reduces AR signaling
To further characterize the association between N-Myc expression and AR signaling, we generated mouse prostate cancer in vitro models. We adapted a recently reported protocol (Gao et al., 2014; Karthaus et al., 2014) to generate mouse prostate cancer (MPC) organoid cultures from prostates resected from the T2-CreERT2 inducible or Pb-Cre, Pten-null, +/- MYCN GEM mice. Before tamoxifen induction, MPC organoids derived from T2-Cre+/+; Ptenf/f; LSL-MYCN+/+ mice were morphologically similar to benign human prostate glands with a luminal and basal cell layer surrounding an empty lumen (Figure S5A). Two weeks after induction, organoids expressed high levels of N-Myc (Figure 5A) and developed a histopathology that resembled tumors observed in the mice (i.e. low number of CK5 positive basal cells, abundant Ki67 and AR positive luminal cells, some of which are also positive for vimentin (Figure 5B and Figure S5A)). Similar to their in vivo tumor counterpart, these organoids also showed lower levels of AR target gene expression (e.g. Tmprss2 and Psca, Figure S5B). T2-Cre+/+; Ptenf/f; LSL-MYCN-/- organoids were also highly proliferative but unlike T2-Cre+/+; Ptenf/f; LSL-MYCN+/+ organoids, they consisted of abundant basal cells. To further test the molecular similarities, we performed RNAseq analyses on MPC organoids developed from 1.5-month old Pb-Cre+/+; Ptenf/f; LSL-MYCN+/+ and Pb-Cre+/+; Ptenf/f; LSL-MYCN-/- mice and found that, as with the GEM prostate tissue, N-Myc drives a molecular signature that is enriched in PRC2/EZH2 targets and suppression of AR signaling (Figure 3C). To determine if Pb-Cre+/-; Ptenf/f; LSL-MYCN+/+ organoids display a similar in vivo phenotype as seen in the mouse prostates, we generated organoid allografts by subcutaneously injecting Pb-Cre+/-; Ptenf/f; LSL-MYCN+/+ or Pb-Cre+/-; Ptenf/f; LSL-MYCN-/- organoids into immunocompromised mice (n = 17 mice per genotype). We observed bioluminescent-positive tumors in the majority (12 out 17) of Pb-Cre+/-; Ptenf/f; LSL-MYCN+/+ 3 months post-injection. As with the GEM tissue, the N-Myc expressing organoid tumors contained adenocarcinoma foci and foci with divergent differentiation (Figure S5C). None of the 17 mice injected with Pb-Cre+/-; Ptenf/f; LSL-MYCN-/- organoids developed tumors up to 3 months post-injection.
Figure 5. MPC organoids culture mimic in vivo mouse features.
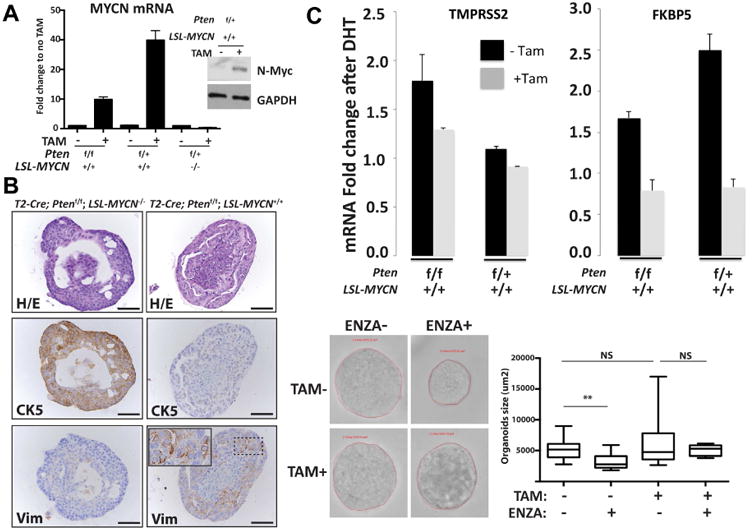
A RT-QPCR and Western blot analysis from MPC organoids showing N-Myc mRNA and protein expression with or without 2 weeks of tamoxifen induction. B Photomicrographs (scale bar = 50 um) of representative mouse prostate organoids from indicated genotype mouse following H/E staining, cytokeratin 5 (CK5), and vimentin (Vim) IHC staining. C. QRT-PCR data of mRNA levels of the indicated AR target genes from organoids 3 weeks with or without tamoxifen and following 1 day stimulation with 10 nM DHT. Shown are average and standard deviation fold change compared to vehicle treated organoid cultures (n = 3 independent organoid cultures). Below: T2-Cre+/+; Ptenf/f; LSL-MYCN+/+ derived prostate organoids with and without tamoxifen organoids culture were seeded for 48 hours and then treated with enzalutamide (1uM) for 72 hours and the surface area of each organoid was calculated. Box-plot representation of the organoids surface area distribution (n > 15 organoids per condition). Enzalutamide reduced the surfaced area of the control organoids but did not have a significant effect in N-Myc expressed organoids. (p-value = 0.0021, Student's T test). See also Figure S5 and Tables S2, S3.
To directly test the impact of N-Myc on AR signaling, we treated the in vitro models with either androgen (dihydrotestosterone, DHT) or an AR inhibitor (enzalutamide) and measured AR target gene expression changes. N-Myc over-expressing MPC organoids showed lower levels of androgen-induced AR target gene induction and were less responsive to enzalutamide (p-value = 0.002, Student's T test, Figure 5C). These findings were confirmed in the LNCaP-N-Myc cells. Using a targeted multiplex quantitative RT-PCR assay (Mosquera and Beltran, in preparation and (Beltran et al., 2016)) that assesses AR signaling we found that LNCaP-N-Myc cells displayed a dramatic abrogation of AR signaling following DHT treatment compared to LNCaP-cntl cells (Figure 4B, top). As observed in the organoids, LNCaP-N-Myc cells treated with enzalutamide show a further reduction of some AR target genes compared to LNCaP-cntl cells (Figure 4B, bottom). To determine if the overexpression of N-Myc induces a faster recurrence in the context of castration we compared 22Rv1 xenograft tumor growth rate in the context of intact or castrated mice. 22Rv1 control cells, which are derived from a CRPC metastatic lesion, grew at a slower rate as xenografts in castrated mice compared to intact mice beginning 20 days post-castration (p-value = 0.0002, Student's T test) and continued until the end of the experiment (p-value = 1E-22, Student's T test). 22Rv1-NMyc xenografts grew at the same rate in intact and in castrate mice throughout the experiment (Figure 4C) with the majority of tumors reaching maximal acceptable size as per WCM-IACUC standards.
From the mouse and human cell line data, N-Myc overexpression was associated with decreased AR signaling. Given the tendency for lower AR levels in N-Myc CRPC samples, we queried AR levels in the mouse models. We observed robust nuclear expression of AR throughout the mHGPIN lesions that displayed high levels of MYCN mRNA as determined by IHC, similar to N-Myc negative control prostate tissue (Figure S3 and Figure S2). This suggests that N-Myc may impact AR signaling not by altering AR levels in the nucleus but rather by binding directly at the sites of target genes to repress transcription and/or blocking AR binding at AR enhancers. Based on targeted ChIP-PCR, we did not observe a significant change in androgen-induced AR binding at specific AR enhancer sites in the context of N-Myc over-expression (Figure S4D). However, we found that N-Myc and AR physically interact and that N-Myc also binds at these AR enhancers (Figure 4D). Interestingly, N-Myc binding at AR enhancers was observed in the absence of DHT and was enhanced by the presence of DHT suggesting that N-Myc binding at the enhancers occurs in the absence of AR and is stabilized by its interaction with AR or another interacting cofactor. No N-Myc binding was observed at a control region in the CDH5 locus (Figure S4C). nMotif analysis at these 175 base pair AR enhancer regions shows that 2 out of the 3 enhancers contain N-Myc binding motifs, defined by reported N-Myc motifs in MotifDB or non-canonical E-Boxes CANNTG motifs (Table S5).
One N-Myc down-regulated AR target is FKBP5, a scaffolding protein for AKT and PHLPP that promotes PHLPP dephosphorylation of AKT at amino acid S473 (Brognard et al., 2007; Ratajczak et al., 2003) and mediates AR-AKT pathway crosstalk (Carver et al., 2011; Mulholland et al., 2011). We found that N-Myc expression is associated with enhanced AKT signaling based on pAKT protein levels in LNCaP cells (Figure 6A, Figure S6), transgenic mouse prostates (pAKT IHC in mHGPIN lesions Figure S2), and mouse-derived organoids (Figure 6B). Further, N-Myc expression sensitizes cells and organoids to the PI3K-AKT pathway inhibitors BKM120 and BEZ235 (Figure 6A, B). PI3K/AKT signaling has previously been shown to enhance N-Myc protein stability in neuroblastoma by blocking GSK3β phosphorylation of N-Myc at T58 (Chesler et al., 2006). Therefore, we reasoned that AKT pathway inhibition with different inhibitors (Figure S6B) should also lower N-Myc levels in our model systems. Treatment of LNCaP-N-Myc cells with BEZ235, BKM120, RAD001, or MK2206 resulted in decreased N-Myc levels after six hours (Figure S6C). To further define the mechanism involved in N-Myc and PI3K/AKT regulation, we determined FKBP5 levels and the ratio of T58 phosphorylated N-Myc to total N-Myc (T58-N-Myc/N-Myc) following PI3K pathway inhibition. BEZ235 treatment resulted in a decrease in steady state levels N-Myc, an increase in T58-N-Myc/N-Myc ratio, and a concomitant restoration of FKBP5 protein levels (Figure S6C) in LNCaP-N-Myc arguing that this pathway is intact in N-Myc over-expressing prostate cancer.
Figure 6. N-MYC increases AKT signaling in cell line and organoids.
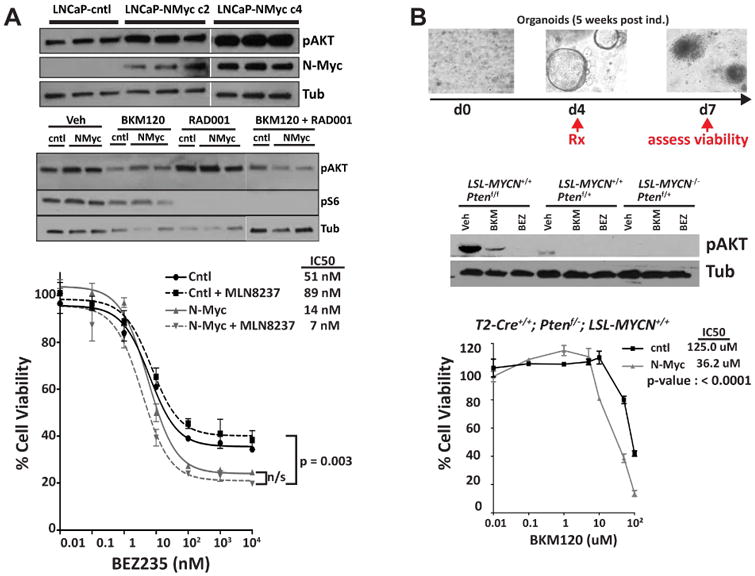
A Western blot analysis of p-AKT in LNCaP-NMYC cells compare to LNCaP-cntl (upper panel). Western blot analysis of p-AKT and Phospho-S6 Ribosomal Protein (Ser235/236) in LNCaP-NMYC cells compare to LNCaP-cntl, 24 hours after treatment with BKM120 (1 μM) and RAD001 (100 nM) alone or in combination (middle panel). Dose-response following 72-hour incubation with the indicated dose of BEZ235 obtained for LNCaP-NMYC cells and LNCaP-cntl and in the presence or absence of MLN8237 (100 nM) (lower panel). B. Drug treatment in prostate organoids culture. Top: Experiment design and below: Western blot analysis of p-AKT after 48 hours of BKM120 (1 μM) and BEZ235 (100 nM) treatment. Bottom: Dose response of BKM120 for T2-Cre+/+; Ptenf/+; LSL-MYCN+/+ organoid culture compare to the non-induced organoids. See also Figure S6.
N-Myc forms a complex with EZH2
EZH2 and N-Myc are both over-expressed in a subset of CRPC and in the vast majority of NEPC (Figure S7A)(Beltran et al., 2016). In addition, the N-Myc signatures in the mouse and LNCaP model systems are enriched with PRC2 target genes. N-Myc interacts with AR, and EZH2 has also been shown to interact with AR (Xu et al., 2012). Therefore, we sought to determine if there is relationship between N-Myc and EZH2 signaling. We observed high levels of EZH2 protein and EZH2 activity (based on histone 3, lysine 27 tri-methylation (H3K27me3) IHC) in Pb-Cre+/-; Ptenf/f; LSL-MYCN+/+ mice at 6 months compared to the low levels observed in control mouse prostates (Figure 7A, Figure S7B). In addition and based on co-immunoprecipitation assays, we found that N-Myc interacts with EZH2 and the PRC2 component SUZ12 (Figure 7B). Interestingly, we also found that the N-Myc/AR interaction depends on the presence of EZH2 based on siRNA directed knock-down of EZH2. In order to test if the catalytic activity of EZH2 is essential for complex formation, we performed N-Myc co-immunoprecipitation following the introduction of a previously described SET domain deletion EZH2 mutant (Xu et al., 2012). Although N-Myc interacts with the mutant EZH2 (Figure S7C), treatment with the catalytic inhibitors GSK126 or GSK343 reduced the interaction between N-Myc and EZH2 and between N-Myc and AR (Figure 7B). Moreover, consistent with the SUZ12-EZH2 interaction (Kim et al., 2015), we found that the N-Myc interaction with SUZ12 is also sensitive to EZH2 catalytic inhibition. Altogether, these results suggest that the catalytic activity of EZH2 enhances N-Myc/AR/EZH2-PRC2 complex formation.
Figure 7. N-Myc interacts with EZH2 to drive transcriptional program.
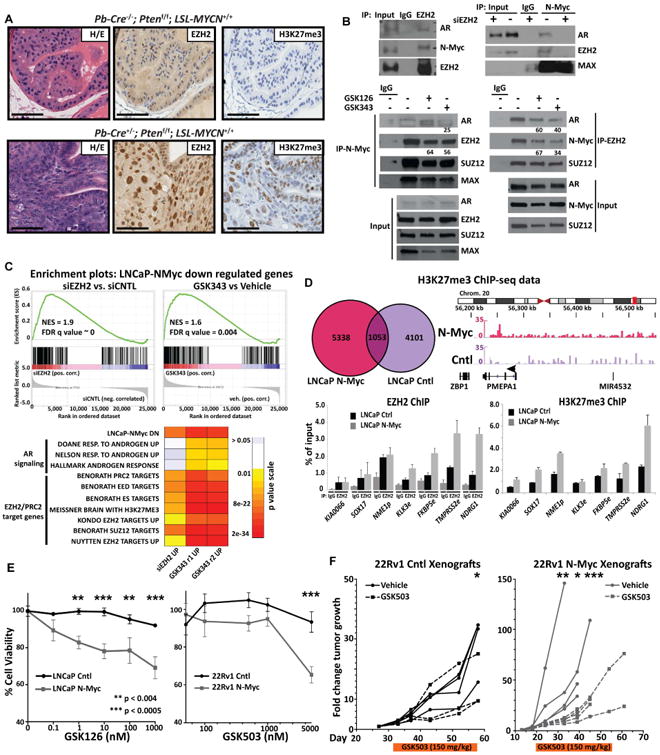
A Photomicrographs of representative mouse prostates from indicated genotype following H/E staining, EZH2, and H3K27 tri-methylation (H3K27me3) IHC staining (scale bar = 50 um). B. Co-immunoprecipitation of N-Myc, EZH2, SUZ12 and AR upon EZH2 or N-Myc pull down in LNCaP-N-Myc cells and in LNCaP-N-Myc cells following knock-down of EZH2 with siRNA targeting EZH2 mRNA (top center), transfection of the Myc-tagged SET domain-deletion EZH2 mutant (top right) or 6-day treatment of either the EZH2 inhibitors GSK126 or GSK343 (bottom). Values below indicate the percent of interaction compared to vehicle if below 70% C. Top: GSEA enrichment plot of the N-Myc down-regulated geneset in genes ranked in terms of comparison of LNCaP-N-Myc cells treated with siRNA targeting EZH2 versus control siRNA or GSK343 versus vehicle treatment; Bottom: heatmap of GSEA FDR q-values as shown in (Fig. 3) of AR induced genes and multiple PRC2 target gene sets that are significantly enriched in the N-Myc down-regulated genes that were significantly up-regulated after either siRNA-mediated EZH2 knock-down (48 hours) or treatment with GSK343 (7 days, 5 μM) in replicate. D. Top left: Venn diagram showing the overlap between H3K27me3 ChIP-seq reads enriched at promoters either in LNCaP-N-Myc or control (Cntl) cells; top right: H3K27me3 ChIP-seq reads in the indicated cells that were localized at the chromosome loci housing the AR-regulated gene PMEPA1; bottom: EZH2 ChIP-PCR at known EZH2 binding sites for the indicated EZH2 target gene or negative control gene (KIA0066). E. Left: Percent cell viability of either LNCaP control (Cntl) or LNCaP-N-Myc (N-Myc) cells following 6 days incubation of the indicated dose of the EZH2 inhibitor GSK126. F. The fold change in growth rate of individual 22Rv1 control (Cntl, left) or N-Myc (right) xenografts before, during (orange bar below) and after 31 or 35 days (respectively) treatment with 150 mg/kg of the EZH2 inhibitor GSK503 (dashed lines) or vehicle (solid lines). Each tumor size at each time point was normalized to values obtained at day 1 of treatment. See also Figure S7.
Since EZH2 is a histone methyltransferase and acts as part of the PRC2 to repress gene transcription, we hypothesized that EZH2 cooperates with N-Myc in down-regulating the expression of N-Myc target genes. To address this, we performed RNAseq analyses in LNCaP-N-Myc cells following either siRNA-mediated EZH2 knock-down or treatment with GSK343 in replicate (correlation between replicates is r = 0.95) and monitored the impact of either condition on N-Myc target gene expression compared to siRNA control or vehicle treatment, respectively. Plotting the rank order of the genes upon EZH2 knock-down or GSK343 treatment, we found that N-Myc down-regulated N-Myc target genes were significantly upregulated (Figure 7C). Further GSEA analysis and hypergeometric tests of the N-Myc down-regulated genes that are up-regulated (log2(fold change) < 0.5) upon either EZH2 knock-down or GSK343 treatment compared to control conditions revealed a significant enrichment of AR-induced genes and PRC2/EZH2 target genes (Figure 7C, Figure S7D) suggesting that EZH2 inhibition reverses N-Myc gene regulation. To test this, we assessed the histone methytransferase activity of EZH2 in LNCaP cells +/- N-Myc over-expression by performing H3K27me3 ChIP-seq. We found a statistically significant difference (p-value = 0.047) between the relative levels of H3K27me3 marks at the promoters of the N-Myc down-regulated genes between LNCaP-NMyc cells compared to control cells. GSEA hypergeometric tests of N-Myc specific H3K27me3 peaks revealed a significant enrichment AR signaling genes (genesets: Hallmark AR response, q-value = 1.02E-11; Nelson response to AR up, q-value = 4.61E-8) and EZH2 targets (genesets: Nuytten EZH2 targets up, q-value = 1.24E-6). Targeted EZH2 and H3K27me3 ChIP-PCR at specific AR binding sites confirmed the increased EZH2 binding and catalytic activity in the context of N-Myc over-expression (Figure 7D). Altogether, our RNAseq and ChIPseq data support a model of EZH2 acting as a co-repressor with N-Myc to drive the NEPC molecular program.
Treatment of LNCaP cell lines with EZH2 inhibitors lowered H3K27 global methylation irrespective of N-Myc status (Figure S7C). However, N-Myc over-expression resulted in a higher sensitivity to EZH2 inhibitors GSK126 or GSK503 in LNCaP or 22Rv1 isogenic cells, respectively, compared to control cells lacking N-Myc (Figure 7E). To determine if the N-Myc associated enhanced sensitivity to EZH2 inhibitors is observed in vivo, we treated mice harboring isogenic 22Rv1 xenografts (+/- N-Myc over-expression) with the EZH2 catalytic SET domain inhibitor GSK503 at 150 mg/kg daily or vehicle for 32 days. Mice harboring control 22Rv1 xenografts showed little to no response to treatment compared to vehicle up to day 25 post-treatment (average tumor size: 29.6 cm3 (vehicle) vs 14.9 cm3 (GSK503), p-value = 1.0E-6, Student T-test) and were sacrificed at day 31 due to reaching maximal tumor size as per WCM-IACUC standards (Figure 7F). On the other hand, the N-Myc over-expressing xenografts showed a statistically significant 5-fold difference of tumor growth in the treatment group compared to vehicle as early as day 11 post-treatment (average tumor size: 57.6 cm3 (vehicle) vs 10.1 cm3 (GSK503), p-value = 5.8E-4, Student T-test) and which was maintained until the end of the treatment (32 days post treatment, average tumor size: 109.0 cm3 (vehicle) vs 26 cm3 (GSK503), p-value = 3.0E-4, Student T-test). No weight loss was noted for any of the GSK503 treat mice over the course of the experiment.
N-Myc forms a targetable complex with Aurora-A that facilitates N-Myc target gene expression
Consistent with neuroblastoma, N-Myc and Aurora-A interact to form a complex that results in N-Myc and Aurora-A stabilization in NEPC (Beltran et al., 2011). Although the catalytic activity of Aurora-A is not required for stabilizing N-Myc (Otto et al., 2009), the interaction of N-Myc with Aurora-A is disrupted by a class of allosteric Aurora-A inhibitors (e.g.MLN8237, (Brockmann et al., 2013; Gustafson et al., 2014)). In LNCaP-N-Myc cells, treatment with MLN8237 led to a rapid dissociation of N-Myc from Aurora-A and promoted degradation of N-Myc based on measurements of steady–state levels and a fluorescent protein-protein proximity ligation assay that assesses N-Myc/Aurora-A complex in isogenic cell lines (Figure 8A,B). Moreover, N-Myc over-expressing cells displayed an enhanced sensitivity to MLN8237 in terms of cell viability in cell lines (LNCaP-N-Myc IC50 = 24.3 nM; LNCaP-cntl IC50 = 2,015 nM, Figure 8C) and in organoids (T2-Cre+/+; Ptenf/f; LSL-MYCN+/+ IC50 = 25.6 uM; T2-Cre+/+; Ptenf/f; LSL-MYCN-/- IC50 = 47.5 uM, Figure 8D). Since the organoids are grown in 3-dimensional cultures that include matrigel, higher overall doses are needed. MLN8237 also leads to a decrease in N-Myc target gene expression (e.g., PEG10 and vimentin, Figure 8E). Based on our finding that N-Myc over-expressing cells are more sensitive to PI3K-AKT pathway inhibitors, we combined an AKT inhibitor with MLN8237. Although it did not reach statistical significance, the combination of MLN8237 with BEZ235 yielded the lowest IC50 (Figure 6).
Figure 8. N-Myc/Aurora-A complex is targetable with allosteric Aurora-A inhibitors (e.g. MLN8237).
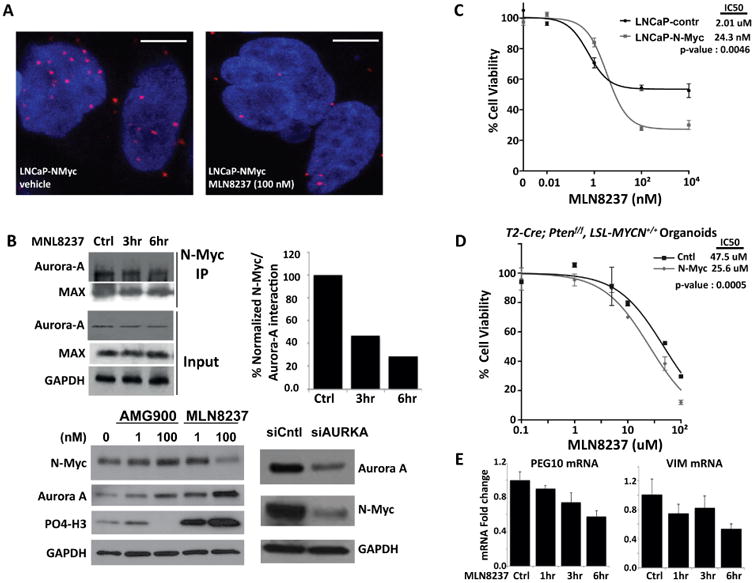
A PLA for the N-Myc/Aurora-A complex. Each red dot represents an interaction (scale bar = 5 um). Below: representative images of PLA assay in LNaP-N-Myc cells treated with either vehicle or 100 nM MLN8237 for 48 hours. B. Western blot analysis of N-Myc in LNCaP-NMyc cells following treatment with the indicated Aurora-A inhibitors at the indicated dose or siRNA targeting AURKA mRNA for 48 hours. C. Dose response data is shown for the same cells shown in the Western blot. D. Organoids culture viability assay after increasing doses of Aurora-A inhibitor MLN8237. Shown are average and standard deviation fold change compared to vehicle treated organoid cultures (n = 3 independent organoid cultures). E. RT-QPCR of PEG10 and vimentin (VIM) mRNA after a time course of MLN8237 (1 μM) treatment.
Discussion
NEPC rarely arises de novo, and is most commonly diagnosed in later stages of prostate cancer progression. In these cases, the clonal evolution of NEPC from prostate adenocarcinoma distinguishes it from small cell neuroendocrine carcinomas arising from other primary sites (Lotan et al., 2011; Scheble et al., 2010; Williamson et al., 2011). Since transformation of NEPC is thought to develop as a mechanism of resistance to hormonal therapy (Ito et al., 2001; Shen et al., 1997; Wright et al., 2003; Yuan et al., 2006), there is concern that with the clinical development of more potent and earlier AR targeted therapeutic strategies, the incidence of NEPC could escalate. We previously reported that MYCN amplification and over-expression are common in NEPC (Beltran et al., 2011; Mosquera et al., 2013).
To characterize the functional role of N-Myc as a driver of prostate cancer, we developed unique N-Myc transgenic mouse lines, MPC organoids, and cell lines models. Based on histopathological and molecular data, N-Myc over-expression was associated with an induction of the NEPC histological phenotype and molecular program. While this study was in review, Lee et al. reported highly complementary results using a forward engineering approach of benign human prostate cell that over express N-Myc in the context of myristoylated AKT (Lee et al., 2016). In that study, Lee et al. provided compelling data showing that N-Myc over-expression resulted in castrate resistant tumors with NEPC or adenocarcinoma histology foci. Foci showing divergent differentiation were also observed. These complementary results solidify N-Myc as a driver of the NEPC phenotype.
In our models, N-Myc abrogates AR signaling and enhances PRC2 target gene repression irrespective of Pten status or the degree of prostate pathology. We found that N-Myc over-expression desensitizes MPC organoids and xenografts to AR antagonist therapy or castration, respectively. The N-Myc transcriptional program also included an enrichment of up-regulated gene sets associated with stem cells (FDR q-values = 1.02e-02), cell migration (FDR q-values = 2.64e-03), and neural programs (FDR q-values = 4.69e-03). It was also enriched with signaling signatures associated with RB1 and TP53 loss, genomic alterations enriched in NEPC (Beltran et al., 2016; Chen et al., 2012; Tan et al., 2014; Zhou et al., 2006). Interestingly, expression of N-Myc in the liver of T2-Cre+/-; Ptenf/f; LSL-MYCN+/+ mice displayed hepatocellular carcinoma foci (similar to what has been observed in c-Myc amplified human and mouse models of liver cancer (Schlaeger et al., 2008; Shachaf et al., 2004)) but also small cell neuroendocrine carcinoma, which had not been reported in c-Myc models. Small-cell liver carcinoma has been described but is extremely rare (Khaw et al., 2011) and to date has not been linked to N-Myc over-expression. Therefore, T2-Cre+/-; Ptenf/f; LSL-MYCN+/+ mice provide a potential model to study this rare liver tumor type. Altogether, these data reinforce the idea that N-Myc can drive a neuroendocrine phenotype.
In neuroblastoma, N-Myc, like c-Myc is degraded via the ubiquitin-proteasome system upon phosphorylation at both S62 and T58 (Sjostrom et al., 2005). It has been previously shown that Aurora-A and N-Myc form a complex that results in N-Myc stabilization (Otto et al., 2009). Interestingly, this complex formation does not require Aurora-A catalytic activity (Otto et al., 2009). Most recently, it has been shown that Aurora-A also mediates c-Myc stability in TP53-altered hepatocellular carcinoma (Dauch et al., 2016). In our prostate cancer models, knock-down of Aurora-A using siRNA or treatment with the allosteric Aurora-A inhibitor MLN8237 resulted in decreased steady-state levels of N-Myc protein, decreased N-Myc target gene expression, and decreased cell viability. Altogether, our data shows the feasibility of exploiting the mutual dependence of N-Myc and Aurora-A to revert their oncogenic functions. Moreover, our data suggests that combination treatment targeting pathways associated with N-Myc expressing prostate cancer (e.g. PI3K/AKT pathway inhibitors and EZH2 inhibitors) may provide synergy with allosteric Aurora-A inhibitors. Further in vivo validation for this is now warranted and may provide rationale for the clinical development of co-targeting approaches. Development of effective treatment strategies for patients with NEPC is a clinical unmet need.
One important finding from our study is that N-Myc represses AR signaling. One of the N-Myc down-regulated AR targets is FKBP5, a member of the cis-trans prolyl isomerase or immunophilin family of proteins (Ratajczak et al., 2015; Ratajczak et al., 2003). FKBP5 serves as a scaffolding protein for AKT and PHLPP promoting PHLPP dephosphorylation of AKT at amino acid S473 (pAKT). Mullholland et al. have shown that, in a mouse model of CRPC, FKBP5 is immediately suppressed after castration but up-regulated upon hormone replacement in mouse prostates; down-regulation of FKBP5 leads to activation of AKT by releasing FKBP5-PHLPP-mediated suppression of AKT (Mulholland et al., 2011). This was consistent with a previous report of crosstalk between androgen signaling and the PI3K pathway by Carver et al. (Carver et al., 2011). Interestingly, we found that in the mouse model, MPC organoids and LNCaP models, N-Myc protein levels were highly correlated with increased pAKT protein levels and that N-Myc over-expressing cells are more sensitive to PI3K-AKT pathway inhibitors.
We found that N-Myc binds to AR enhancers and forms an interaction with the AR that is dependent on its interaction with EZH2. Further, the catalytic activity of EZH2 enhances N-Myc/AR/EZH2-PRC2 complex formation. We observed high levels of EZH2 protein levels and EZH2 activity in mouse models over-expressing N-Myc and in human prostate cancer cells, N-Myc re-directs EZH2 activity to N-Myc target gene promoters which results in transcription repression while EZH2 inhibition reverses N-Myc gene regulation. Moreover, N-Myc sensitizes cells to EZH2 inhibitors in vitro and in vivo. EZH2 has been implicated as a direct target gene of c-Myc in prostate cancer initiation (Koh et al., 2011). Whether N-Myc directly regulates EZH2 expression in late stage prostate cancer remains to be determined. Moreover, there are likely other mechanisms involved as EZH2 is expressed in a higher frequency of CRPC cases than N-Myc. Nonetheless, our data suggests that N-Myc and EZH2 signaling are tightly linked in driving the NEPC molecular program. The interaction between N-Myc, AR and EZH2 results in the abrogation of AR signaling despite abundant levels of AR suggesting that the amplification of MYCN and loss of AR observed in NEPC tumor samples could be two independent events. The full extent of the role of N-Myc/EZH2 complex in regulating the AR pathway and other N-Myc target genes, the overlap between N-Myc and EZH2 genome occupancy, and the role of N-Myc and EZH2-mediated gene regulation through H3K27 methylation requires further characterization. Interestingly, based on available ChIP-seq data from LNCaP cells we noted that 85% (p < 0.001, permutation test) and 55% (p = 0.03, permutation test) of EZH2 and AR binding, respectively, contain N-Myc binding motifs suggesting a genome-wide overlap between N-Myc and these other interacting proteins (Table S5). ChIP-seq for each of the proteins in the presence and absence of N-Myc binding will provide a more complete picture of genome-wide co-occupancy. Given the availability of EZH2 inhibitors that are now in Phase 1 clinical trials for advanced solid tumors (e.g. NCT02082977) this characterization will potentially provide a rationale for further clinical development for patients with N-Myc over-expressed NEPC and CRPC. Our data suggests that N-Myc expression and cooperation with EZH2 in CRPC might provide a selective advantage in the face of AR-directed therapy by shutting down AR signaling and establishing other pro-survival signaling pathways.
In summary, we shows that N-Myc cooperates with EZH2 to drive the neuroendocrine phenotype in prostate cancer and provides rationale for targeted or co-targeting strategies for N-Myc-driven CRPC and the NEPC aggressive subgroup of late-stage prostate cancer.
Experimental Procedures
Clinical sample RNA-seq data processing
The dataset included including 178 CRPC and 25 NEPC. 34 CRPC and 20 NEPC of these tumor specimens were obtained and sequenced prospectively through clinical protocols approved by the Weill Cornell Medicine Institutional Review Board (IRB) with informed consent (IRB #1305013903, #1210013164) (Beltran et al., 2016). RNA-Seq data for the remaining 144 CRPC and 5 NEPC cases was obtained through the SU2C-PCF clinical trial (Robinson et al., 2015) and data was accessed for this study through cBioPortal (Cerami et al., 2012).
Genetically engineered mouse lines
All experimental procedures were carried out according to protocols approved by the Institutional Animal Care and Use Committees at the Weill Cornell Medicine of Cornell University (Protocol # 2008-0019).
Statistical Analysis
A Wilcoxon test was applied for mRNA differential analysis, followed by Benjamini–Hochberg correction for multiple hypothesis testing. Pearson correlation and Fisher exact test were implemented for gene-gene expression correlation and genomic aberration association analysis, respectively. A Student t test method was used to determine differences in tumor volumes in xenograft studies, with the criterion for significance < 0.05.
Accession number
All RNA-seq and ChIP-seq data reported in this paper is GSE86532 (GEO).
Other details for the above and other experimental procedures are described in fully in Supplemental Experimental Procedures.
Supplementary Material
Significance.
NEPC is an emerging variant of CRPC associated with androgen independence and a lack of effective therapeutic options. We demonstrate that N-Myc over-expression in multiple pre-clinical models drives aggressive prostate cancer that molecularly mimics clinical NEPC and sensitizes cells to the allosteric Aurora-A inhibitor MLN8237 and EZH2 SET domain inhibitors. Since transformation to NEPC is thought to develop as a resistance mechanism to AR-directed therapies, there is concern that with the clinical development of more potent and earlier AR targeted therapeutic strategies, the incidence of NEPC may rise. Therefore, findings from this study will impact significantly more prostate cancer patients than previously appreciated and provide rationale for the development of therapeutic strategies for treating this aggressive subtype of prostate cancer.
Highlights.
N-Myc drives the NEPC phenotype and associated molecular program.
N-Myc abrogates AR signaling which results in enhanced AKT activity.
N-Myc redirects EZH2 activity and sensitizes cells to EZH2 inhibitors.
N-Myc interacts with Aurora-A that facilitates N-Myc target gene expression.
Acknowledgments
We would thank Chantal Pauli, Mirjam Blattner-Johnson, Jaclyn A. Croyle, and Sadia Mirza for their technical assistance and helpful comments and insights on data presented in the manuscript. We thank the follow WCM core Facilities: The Translational Research Program at WCM Pathology and Laboratory Medicine (Bing He, Yifang Liu, Leticia Dizon), the WCM-epigenomic core (Dr. Alicia Alonzo), the WCM-genomics resources core (Dr. Jenny Xiang) facilities and the IPM-WCM. This study was supported by the Prostate Cancer Foundation (PCF) Challenge award (D.S.R., M.E., H.B., M.R., O.E.), the National Institutes of Health (1R01CA179100-01A1) (D.S.R., O.E., J.M.M., H.B.). This study was also supported in part by the Damon Runyon Cancer Research Foundation Clinical Investigator Award CI-67-13 (H.B.), Department of Defense PC121341 (H.B.), Early Detection Research Network NCI U01 CA111275 (J.M.M. and M.A.R.), European Research Council ERCCoG648670 (F.D.), R01 CA116337 (H.B., F.D., M.A.R.) and by the Translational Research Program at WCM Pathology and Laboratory Medicine and a fellowship from the PhRMA Foundation (K.G.). L.P. is supported by American-Italian Cancer Foundation Post-Doctoral Research Fellowship and PCF Young Investigator Award. Enzalutamide was provided by Astellas Pharma Inc., (Northbrook, IL) and Medivation, Inc., (San Francisco, CA). All EZH2 inhibitors were provided by GlaxoSmithKline (Newark, NJ). M.A.R. is listed as a co-inventor on a patent application for testing EZH2 in clinical samples (University of Michigan), which has been licensed to Ventana/Roche.
Footnotes
Author Contributions: E.D. H.B. and D.S.R. designed, performed and analyzed experiments. M.B., K.G., A.S., O.E. and F.D. performed bioinformatics analysis. H.B., M.A.R. and F.D. generated clinical RNseq data and annotated patient samples. A.B. and L.P. performed and analyzed cell line experiments. C.C. generated all cell lines and performed experiments. J.C., Z.N., T.M. M.A.R and J.M.M. designed and performed RNAish experiments in GEM lines and clinical samples. J.C., J.M.M., B.D.R. and M.A.R. performed pathology evaluations of all GEMs and clinical samples. D. O. and Y.C. developed mouse prostate organoid technology and worked with the Englander Institute for Precision Medicine, Weill Cornell Medicine (IPM-WCM) organoid platform and E.D. to establish GEM organoids for this manuscript. M.E. provided essential reagents. E.D., H.B. and D.S.R. wrote the manuscript. E.D., H. B., J.C., M.E., J.M.M., B.D.R., O.E., M.A.R., F.D. and D.S.R. edited the manuscript. E.D. and H. B. share equal authorship.
Publisher's Disclaimer: This is a PDF file of an unedited manuscript that has been accepted for publication. As a service to our customers we are providing this early version of the manuscript. The manuscript will undergo copyediting, typesetting, and review of the resulting proof before it is published in its final citable form. Please note that during the production process errors may be discovered which could affect the content, and all legal disclaimers that apply to the journal pertain.
References
- Althoff K, Beckers A, Bell E, Nortmeyer M, Thor T, Sprussel A, Lindner S, De Preter K, Florin A, Heukamp LC, et al. A Cre-conditional MYCN-driven neuroblastoma mouse model as an improved tool for preclinical studies. Oncogene. 2015;34:3357–3368. doi: 10.1038/onc.2014.269. [DOI] [PMC free article] [PubMed] [Google Scholar]
- Beltran H, Prandi D, Mosquera JM, Benelli M, Puca L, Cyrta J, Marotz C, Giannopoulou E, Chakravarthi BV, Varambally S, et al. Divergent clonal evolution of castration-resistant neuroendocrine prostate cancer. Nat Med. 2016;22:298–305. doi: 10.1038/nm.4045. [DOI] [PMC free article] [PubMed] [Google Scholar]
- Beltran H, Rickman DS, Park K, Chae SS, Sboner A, MacDonald TY, Wang Y, Sheikh KL, Terry S, Tagawa ST, et al. Molecular characterization of neuroendocrine prostate cancer and identification of new drug targets. Cancer Discov. 2011;1:487–495. doi: 10.1158/2159-8290.CD-11-0130. [DOI] [PMC free article] [PubMed] [Google Scholar]
- Brockmann M, Poon E, Berry T, Carstensen A, Deubzer HE, Rycak L, Jamin Y, Thway K, Robinson SP, Roels F, et al. Small molecule inhibitors of aurora-a induce proteasomal degradation of N-myc in childhood neuroblastoma. Cancer Cell. 2013;24:75–89. doi: 10.1016/j.ccr.2013.05.005. [DOI] [PMC free article] [PubMed] [Google Scholar]
- Brognard J, Sierecki E, Gao T, Newton AC. PHLPP and a second isoform, PHLPP2, differentially attenuate the amplitude of Akt signaling by regulating distinct Akt isoforms. Mol Cell. 2007;25:917–931. doi: 10.1016/j.molcel.2007.02.017. [DOI] [PubMed] [Google Scholar]
- Cancer Genome Atlas Research, N. The Molecular Taxonomy of Primary Prostate Cancer. Cell. 2015;163:1011–1025. doi: 10.1016/j.cell.2015.10.025. [DOI] [PMC free article] [PubMed] [Google Scholar]
- Carver BS, Chapinski C, Wongvipat J, Hieronymus H, Chen Y, Chandarlapaty S, Arora VK, Le C, Koutcher J, Scher H, et al. Reciprocal feedback regulation of PI3K and androgen receptor signaling in PTEN-deficient prostate cancer. Cancer Cell. 2011;19:575–586. doi: 10.1016/j.ccr.2011.04.008. [DOI] [PMC free article] [PubMed] [Google Scholar]
- Cerami E, Gao J, Dogrusoz U, Gross BE, Sumer SO, Aksoy BA, Jacobsen A, Byrne CJ, Heuer ML, Larsson E, et al. The cBio cancer genomics portal: an open platform for exploring multidimensional cancer genomics data. Cancer discovery. 2012;2:401–404. doi: 10.1158/2159-8290.CD-12-0095. [DOI] [PMC free article] [PubMed] [Google Scholar]
- Chen H, Sun Y, Wu C, Magyar CE, Li X, Cheng L, Yao JL, Shen S, Osunkoya AO, Liang C, Huang J. Pathogenesis of prostatic small cell carcinoma involves the inactivation of the P53 pathway. Endocr Relat Cancer. 2012;19:321–331. doi: 10.1530/ERC-11-0368. [DOI] [PMC free article] [PubMed] [Google Scholar]
- Chen Y, Chi P, Rockowitz S, Iaquinta PJ, Shamu T, Shukla S, Gao D, Sirota I, Carver BS, Wongvipat J, et al. ETS factors reprogram the androgen receptor cistrome and prime prostate tumorigenesis in response to PTEN loss. Nat Med. 2013;19:1023–1029. doi: 10.1038/nm.3216. [DOI] [PMC free article] [PubMed] [Google Scholar]
- Chesler L, Schlieve C, Goldenberg DD, Kenney A, Kim G, McMillan A, Matthay KK, Rowitch D, Weiss WA. Inhibition of phosphatidylinositol 3-kinase destabilizes Mycn protein and blocks malignant progression in neuroblastoma. Cancer Res. 2006;66:8139–8146. doi: 10.1158/0008-5472.CAN-05-2769. [DOI] [PMC free article] [PubMed] [Google Scholar]
- Dauch D, Rudalska R, Cossa G, Nault JC, Kang TW, Wuestefeld T, Hohmeyer A, Imbeaud S, Yevsa T, Hoenicke L, et al. A MYC-aurorakinase A protein complex represents an actionable drug target in p53-altered liver cancer. Nat Med. 2016 doi: 10.1038/nm.4107. [DOI] [PubMed] [Google Scholar]
- Gao D, Vela I, Sboner A, Iaquinta PJ, Karthaus WR, Gopalan A, Dowling C, Wanjala JN, Undvall EA, Arora VK, et al. Organoid cultures derived from patients with advanced prostate cancer. Cell. 2014;159:176–187. doi: 10.1016/j.cell.2014.08.016. [DOI] [PMC free article] [PubMed] [Google Scholar]
- Gao D, Zhan Y, Di W, Moore AR, Sher JJ, Guan Y, Wang S, Zhang Z, Murphy DA, Sawyers CL, et al. A Tmprss2-CreERT2 Knock-In Mouse Model for Cancer Genetic Studies on Prostate and Colon. PLoS One. 2016;11:e0161084. doi: 10.1371/journal.pone.0161084. [DOI] [PMC free article] [PubMed] [Google Scholar]
- Grimmer MR, Weiss WA. Childhood tumors of the nervous system as disorders of normal development. Current opinion in pediatrics. 2006;18:634–638. doi: 10.1097/MOP.0b013e32801080fe. [DOI] [PubMed] [Google Scholar]
- Gustafson WC, Meyerowitz JG, Nekritz EA, Chen J, Benes C, Charron E, Simonds EF, Seeger R, Matthay KK, Hertz NT, et al. Drugging MYCN through an allosteric transition in Aurora kinase A. Cancer Cell. 2014;26:414–427. doi: 10.1016/j.ccr.2014.07.015. [DOI] [PMC free article] [PubMed] [Google Scholar]
- Hieronymus H, Lamb J, Ross KN, Peng XP, Clement C, Rodina A, Nieto M, Du J, Stegmaier K, Raj SM, et al. Gene expression signature-based chemical genomic prediction identifies a novel class of HSP90 pathway modulators. Cancer Cell. 2006;10:321–330. doi: 10.1016/j.ccr.2006.09.005. [DOI] [PubMed] [Google Scholar]
- Humphrey PA. Histological variants of prostatic carcinoma and their significance. Histopathology. 2012;60:59–74. doi: 10.1111/j.1365-2559.2011.04039.x. [DOI] [PubMed] [Google Scholar]
- Ito T, Yamamoto S, Ohno Y, Namiki K, Aizawa T, Akiyama A, Tachibana M. Up-regulation of neuroendocrine differentiation in prostate cancer after androgen deprivation therapy, degree and androgen independence. Oncol Rep. 2001;8:1221–1224. doi: 10.3892/or.8.6.1221. [DOI] [PubMed] [Google Scholar]
- Karthaus WR, Iaquinta PJ, Drost J, Gracanin A, van Boxtel R, Wongvipat J, Dowling CM, Gao D, Begthel H, Sachs N, et al. Identification of multipotent luminal progenitor cells in human prostate organoid cultures. Cell. 2014;159:163–175. doi: 10.1016/j.cell.2014.08.017. [DOI] [PMC free article] [PubMed] [Google Scholar]
- Khaw YL, Nolan N, Heaslip I, McCormick PA, Sheahan K. Primary intrahepatic small-cell carcinoma arising from combined hepatocellular and cholangiocarcinomas. J Clin Oncol. 2011;29:e630–633. doi: 10.1200/JCO.2011.35.2757. [DOI] [PubMed] [Google Scholar]
- Kim KH, Kim W, Howard TP, Vazquez F, Tsherniak A, Wu JN, Wang W, Haswell JR, Walensky LD, Hahn WC, et al. SWI/SNF-mutant cancers depend on catalytic and non-catalytic activity of EZH2. Nat Med. 2015;21:1491–1496. doi: 10.1038/nm.3968. [DOI] [PMC free article] [PubMed] [Google Scholar]
- Koh CM, Iwata T, Zheng Q, Bethel C, Yegnasubramanian S, De Marzo AM. Myc enforces overexpression of EZH2 in early prostatic neoplasia via transcriptional and post-transcriptional mechanisms. Oncotarget. 2011;2:669–683. doi: 10.18632/oncotarget.327. [DOI] [PMC free article] [PubMed] [Google Scholar]
- Lee JK, Phillips JW, Smith BA, Park JW, Stoyanova T, McCaffrey EF, Baertsch R, Sokolov A, Meyerowitz JG, Mathis C, et al. N-Myc Drives Neuroendocrine Prostate Cancer Initiated from Human Prostate Epithelial Cells. Cancer Cell. 2016;29:536–547. doi: 10.1016/j.ccell.2016.03.001. [DOI] [PMC free article] [PubMed] [Google Scholar]
- Lotan TL, Gupta NS, Wang W, Toubaji A, Haffner MC, Chaux A, Hicks JL, Meeker AK, Bieberich CJ, De Marzo AM, et al. ERG gene rearrangements are common in prostatic small cell carcinomas. Mod Pathol. 2011;24:820–828. doi: 10.1038/modpathol.2011.7. [DOI] [PMC free article] [PubMed] [Google Scholar]
- Martin P, Liu YN, Pierce R, Abou-Kheir W, Casey O, Seng V, Camacho D, Simpson RM, Kelly K. Prostate epithelial Pten/TP53 loss leads to transformation of multipotential progenitors and epithelial to mesenchymal transition. Am J Pathol. 2011;179:422–435. doi: 10.1016/j.ajpath.2011.03.035. [DOI] [PMC free article] [PubMed] [Google Scholar]
- Mosquera JM, Beltran H, Park K, MacDonald TY, Robinson BD, Tagawa ST, Perner S, Bismar TA, Erbersdobler A, Dhir R, et al. Concurrent AURKA and MYCN gene amplifications are harbingers of lethal treatment-related neuroendocrine prostate cancer. Neoplasia. 2013;15:1–10. doi: 10.1593/neo.121550. [DOI] [PMC free article] [PubMed] [Google Scholar]
- Mott LJ. Squamous cell carcinoma of the prostate: report of 2 cases and review of the literature. J Urol. 1979;121:833–835. doi: 10.1016/s0022-5347(17)57013-5. [DOI] [PubMed] [Google Scholar]
- Mulholland DJ, Tran LM, Li Y, Cai H, Morim A, Wang S, Plaisier S, Garraway IP, Huang J, Graeber TG, Wu H. Cell autonomous role of PTEN in regulating castration-resistant prostate cancer growth. Cancer Cell. 2011;19:792–804. doi: 10.1016/j.ccr.2011.05.006. [DOI] [PMC free article] [PubMed] [Google Scholar]
- Nelson PS, Clegg N, Arnold H, Ferguson C, Bonham M, White J, Hood L, Lin B. The program of androgen-responsive genes in neoplastic prostate epithelium. Proc Natl Acad Sci U S A. 2002;99:11890–11895. doi: 10.1073/pnas.182376299. [DOI] [PMC free article] [PubMed] [Google Scholar]
- Otto T, Horn S, Brockmann M, Eilers U, Schuttrumpf L, Popov N, Kenney AM, Schulte JH, Beijersbergen R, Christiansen H, et al. Stabilization of N-Myc is a critical function of Aurora A in human neuroblastoma. Cancer Cell. 2009;15:67–78. doi: 10.1016/j.ccr.2008.12.005. [DOI] [PubMed] [Google Scholar]
- Parwani AV, Kronz JD, Genega EM, Gaudin P, Chang S, Epstein JI. Prostate carcinoma with squamous differentiation: an analysis of 33 cases. Am J Surg Pathol. 2004;28:651–657. doi: 10.1097/00000478-200405000-00014. [DOI] [PubMed] [Google Scholar]
- Ratajczak T, Cluning C, Ward BK. Steroid Receptor-Associated Immunophilins: A Gateway to Steroid Signalling. Clin Biochem Rev. 2015;36:31–52. [PMC free article] [PubMed] [Google Scholar]
- Ratajczak T, Ward BK, Minchin RF. Immunophilin chaperones in steroid receptor signalling. Curr Top Med Chem. 2003;3:1348–1357. doi: 10.2174/1568026033451934. [DOI] [PubMed] [Google Scholar]
- Robinson D, Van Allen EM, Wu YM, Schultz N, Lonigro RJ, Mosquera JM, Montgomery B, Taplin ME, Pritchard CC, Attard G, et al. Integrative clinical genomics of advanced prostate cancer. Cell. 2015;161:1215–1228. doi: 10.1016/j.cell.2015.05.001. [DOI] [PMC free article] [PubMed] [Google Scholar]
- Scheble VJ, Braun M, Beroukhim R, Mermel CH, Ruiz C, Wilbertz T, Stiedl AC, Petersen K, Reischl M, Kuefer R, et al. ERG rearrangement is specific to prostate cancer and does not occur in any other common tumor. Mod Pathol. 2010;23:1061–1067. doi: 10.1038/modpathol.2010.87. [DOI] [PMC free article] [PubMed] [Google Scholar]
- Schlaeger C, Longerich T, Schiller C, Bewerunge P, Mehrabi A, Toedt G, Kleeff J, Ehemann V, Eils R, Lichter P, et al. Etiology-dependent molecular mechanisms in human hepatocarcinogenesis. Hepatology. 2008;47:511–520. doi: 10.1002/hep.22033. [DOI] [PubMed] [Google Scholar]
- Shachaf CM, Kopelman AM, Arvanitis C, Karlsson A, Beer S, Mandl S, Bachmann MH, Borowsky AD, Ruebner B, Cardiff RD, et al. MYC inactivation uncovers pluripotent differentiation and tumour dormancy in hepatocellular cancer. Nature. 2004;431:1112–1117. doi: 10.1038/nature03043. [DOI] [PubMed] [Google Scholar]
- Shen R, Dorai T, Szaboles M, Katz AE, Olsson CA, Buttyan R. Transdifferentiation of cultured human prostate cancer cells to a neuroendocrine cell phenotype in a hormone-depleted medium. Urol Oncol. 1997;3:67–75. doi: 10.1016/s1078-1439(97)00039-2. [DOI] [PubMed] [Google Scholar]
- Sjostrom SK, Finn G, Hahn WC, Rowitch DH, Kenney AM. The Cdk1 complex plays a prime role in regulating N-myc phosphorylation and turnover in neural precursors. Developmental cell. 2005;9:327–338. doi: 10.1016/j.devcel.2005.07.014. [DOI] [PubMed] [Google Scholar]
- Small EJ, Aggarwal RR, Huang J, Sokolov A, Zhang L, Alumkal JJ, Youngren J, Ryan CJ, Foye A, Reiter RE, et al. Clinical and genomic characterization of metastatic small cell/neuroendocrine prostate cancer (SCNC) and intermediate atypical prostate cancer (IAC): Results from the SU2C/PCF/AACRWest Coast Prostate Cancer Dream Team (WCDT) J Clin Oncol. 2016;34(suppl; abstr 5019) [Google Scholar]
- Tan HL, Sood A, Rahimi HA, Wang W, Gupta N, Hicks J, Mosier S, Gocke CD, Epstein JI, Netto GJ, et al. Rb loss is characteristic of prostatic small cell neuroendocrine carcinoma. Clin Cancer Res. 2014;20:890–903. doi: 10.1158/1078-0432.CCR-13-1982. [DOI] [PMC free article] [PubMed] [Google Scholar]
- Wang HT, Yao YH, Li BG, Tang Y, Chang JW, Zhang J. Neuroendocrine Prostate Cancer (NEPC) Progressing From Conventional Prostatic Adenocarcinoma: Factors Associated With Time to Development of NEPC and Survival From NEPC Diagnosis-A Systematic Review and Pooled Analysis. J Clin Oncol. 2014 doi: 10.1200/JCO.2013.54.3553. [DOI] [PubMed] [Google Scholar]
- Williamson SR, Zhang S, Yao JL, Huang J, Lopez-Beltran A, Shen S, Osunkoya AO, MacLennan GT, Montironi R, Cheng L. ERG-TMPRSS2 rearrangement is shared by concurrent prostatic adenocarcinoma and prostatic small cell carcinoma and absent in small cell carcinoma of the urinary bladder: evidence supporting monoclonal origin. Mod Pathol. 2011;24:1120–1127. doi: 10.1038/modpathol.2011.56. [DOI] [PMC free article] [PubMed] [Google Scholar]
- Wright ME, Tsai MJ, Aebersold R. Androgen receptor represses the neuroendocrine transdifferentiation process in prostate cancer cells. Mol Endocrinol. 2003;17:1726–1737. doi: 10.1210/me.2003-0031. [DOI] [PubMed] [Google Scholar]
- Wu X, Wu J, Huang J, Powell WC, Zhang J, Matusik RJ, Sangiorgi FO, Maxson RE, Sucov HM, Roy-Burman P. Generation of a prostate epithelial cell-specific Cre transgenic mouse model for tissue-specific gene ablation. Mechanisms of development. 2001;101:61–69. doi: 10.1016/s0925-4773(00)00551-7. [DOI] [PubMed] [Google Scholar]
- Xu K, Wu ZJ, Groner AC, He HH, Cai C, Lis RT, Wu X, Stack EC, Loda M, Liu T, et al. EZH2 oncogenic activity in castration-resistant prostate cancer cells is Polycomb-independent. Science. 2012;338:1465–1469. doi: 10.1126/science.1227604. [DOI] [PMC free article] [PubMed] [Google Scholar]
- Yuan TC, Veeramani S, Lin FF, Kondrikou D, Zelivianski S, Igawa T, Karan D, Batra SK, Lin MF. Androgen deprivation induces human prostate epithelial neuroendocrine differentiation of androgen-sensitive LNCaP cells. Endocr Relat Cancer. 2006;13:151–167. doi: 10.1677/erc.1.01043. [DOI] [PubMed] [Google Scholar]
- Zhang W, Yu Y, Hertwig F, Thierry-Mieg J, Zhang W, Thierry-Mieg D, Wang J, Furlanello C, Devanarayan V, Cheng J, et al. Comparison of RNA-seq and microarray-based models for clinical endpoint prediction. Genome Biol. 2015;16:133. doi: 10.1186/s13059-015-0694-1. [DOI] [PMC free article] [PubMed] [Google Scholar]
- Zhou Z, Flesken-Nikitin A, Corney DC, Wang W, Goodrich DW, Roy-Burman P, Nikitin AY. Synergy of p53 and Rb deficiency in a conditional mouse model for metastatic prostate cancer. Cancer Res. 2006;66:7889–7898. doi: 10.1158/0008-5472.CAN-06-0486. [DOI] [PubMed] [Google Scholar]
Associated Data
This section collects any data citations, data availability statements, or supplementary materials included in this article.