Supplemental digital content is available in the text.
Abstract
Background
Nonadherence to immunosuppressants is associated with rejection and allograft loss. Intrapatient variability (IPV) of immunosuppression levels is a marker of nonadherence. This study describes the impact of IPV of tacrolimus levels in patients receiving a tacrolimus monotherapy immunosuppression protocol.
Methods
We retrospectively analyzed the outpatient tacrolimus levels of kidney-only transplant patients taken between 6 and 12 months posttransplant. IPV was determined using the coefficient of variance.
Results
Six hundred twenty-eight patients with a mean number of 8.98 ± 3.81 tacrolimus levels and a mean follow-up of 4.72 ± 2.19 years were included. Multivariate analysis showed death was associated with increasing age (1.04 [1.01-1.07], P = 0.0055), diabetes at time of transplant (2.79 [1.44-5.41], P = 0.0024), and rejection (2.34 [1.06-5.19], P = 0.036). Variables associated with graft loss included the highest variability group (2.51 [1.01-6.27], P = 0.048), mean tacrolimus level less than 5 ng/mL (4.32 [1.94-9.63], P = 0.0003), a high clinic nonattendance rate (1.10 [1.01-1.20], P = 0.03), and rejection (9.83 [4.62-20.94], P < 0.0001). Independent risk factors for rejection were de novo donor-specific antibody (3.15 [1.84-5.39], P < 0.0001), mean tacrolimus level less than 5 ng/mL (2.57 [1.27-5.19], P = 0.00860, and a high clinic nonattendance rate (1.11 [1.05-1.18], P = 0.0005).
Conclusions
This study shows that high tacrolimus IPV and clinic nonattendance are associated with inferior allograft survival. Interventions to minimize the causes of high variability, particularly nonadherence are essential to improve long-term allograft outcomes.
Nonadherence to immunosuppressive medication is associated with transplant rejection and allograft loss.1,2 Nonadherence can start at any time after transplantation, sometimes within weeks but also after many months or years.3-5 A prospective cohort study by Massey and colleagues5 identified that self-reported nonadherence to immunosuppression medication increased significantly between 6 weeks, 6 months and 18 months posttransplant from 17% at 6 weeks to 27% at 6 months and to 31% at 18 months. Therefore, it is likely that nonadherence to immunosuppression is identified too late in many cases, especially given its often-insidious onset and difficulty in measurement.
There are many methods of assessing patient adherence to prescribed immunosuppressive medications, and in clinical practice, a combination of different methods need to be used to accurately determine adherence.3,6-8 The method most commonly used is the monitoring of immunosuppression trough levels. The variability of serial trough levels in any 1 patient, defined as intrapatient variability (IPV), can be affected by a number of factors including nonadherence; therefore, it may allow the assessment of adherence over a given period with more accuracy.9-14 Objectively measuring outpatient clinic nonattendance in addition to the variability of a patient’s immunosuppression levels could provide 2 simple, cheap and effective tools easily used by transplant clinicians to identify a patient at risk of nonadherence. Immunosuppression levels are usually maintained within a transplant unit's protocol range; however, patients’ levels may lie outside of this range for various reasons, including clinician nonadherence to protocol. The variability of levels in association with the protocol range may allow assessment of clinician nonadherence in addition to patient nonadherence.
Tacrolimus monotherapy regimens have been used as simple and cheap immunosuppression regimens to improve patient adherence and reduce the incidence of adverse effects associated with more complex dual or triple immunosuppression regimens. However, it could make patients more vulnerable to the adverse outcomes of nonadherence because they are not offered any protection by other immunosuppressants if a dose of tacrolimus is missed. To our knowledge, there are no previously reported studies analyzing the clinical impact of IPV of tacrolimus in patients receiving tacrolimus monotherapy regimens. Thus, the aim of this study is to determine the effect of IPV, mean tacrolimus levels, and outpatient clinic nonattendance on allograft outcomes in a cohort of patients receiving a tacrolimus monotherapy maintenance immunosuppression protocol.
MATERIALS AND METHODS
We retrospectively analyzed patients who received a kidney only transplant between November 2005 and December 2012. All patients included in this study received their kidney transplant and maintained their regular follow-up outpatient appointments at the Imperial College Renal and Transplant Centre. Antibody incompatible, early technical failures and patients who received induction with an interleukin-2 receptor blocker were excluded. Patients had to be transplanted for at least 1 year to be included in the analysis. Clinical data were extracted from a prospectively collected transplant database. Data on clinic nonattendance were obtained from the integrated computerised hospital information system. Patients were followed up until graft loss, patient death, or time of data analysis up to a maximum of 8 years.
Seven hundred twenty-nine patients were included in the preliminary analysis. The patient cohort was then further refined, and the following patients were excluded: patients who died or lost their graft within the first 6 months and patients who transferred out of the unit or had no outpatient levels in 6 to 12 months posttransplant (16 patients); patients who developed rejection in the first 6 months (85 patients). Six hundred twenty-eight patients remained for the final analysis.
All patients received alemtuzumab induction (30 mg postoperatively) and tacrolimus monotherapy (Prograf or Adoport) with a steroid sparing protocol. Methylprednisolone 500 mg intravenously was administered before surgery and tacrolimus was started at a dose of 0.05 mg/kg twice a day to achieve a target level of 5 to 8 ng/mL. Tacrolimus levels were measured by the Imperial College Renal and Transplant Centre therapeutic drug monitoring laboratory using the liquid chromatography with tandem mass-spectrometric detection technique. Patients received steroids for 1 week only (hydrocortisone 100 mg twice a day intravenously until able to swallow then prednisolone 30 mg twice a day until day 4, reduced to 30 mg once a day until day 7, then stopped). Patients maintained on oral prednisolone before the transplant reverted to their original maintenance dose at day 7.
All out-patient tacrolimus trough levels measured between 6 and 12 months posttransplant were included in the analysis. Patients who developed rejection during the 6- to 12-month period of analysis only had their tacrolimus levels before the rejection episode included in the analysis (they were censored at this point as tacrolimus levels are increased to achieve a target level of 8 to 12 ng/ml with the addition of mycophenolate to treat the rejection). IPV was determined using the coefficient of variance (COV) which is defined as9:

When comparing the IPV of tacrolimus trough levels to allograft outcomes, the “highest variability” (HHV) patients, “high variability” (HV) patients, “low variability” (LV) patients, and “lowest variability” (LLV) patients were determined by the median COV and corresponding interquartile range (IQR) where HHV > third quartile of COV, HV > median COV < third quartile of COV, LV was ≤ median COV > first quartile of COV, and LLV < first quartile of COV, as shown below:

When analyzing the effect of IPV and mean tacrolimus trough levels or outpatient clinic nonattendance on allograft outcomes, HV was defined as COV > median of the overall cohort, and LV was defined as COV ≤ median of the overall cohort.
All rejection episodes were biopsy proven and were classified by Banff '07 criteria.15 Transplant glomerulopathy (TG) was defined as the presence of double contours by LM in the absence of immune complex deposition by immunofluorescence and/or electron microscopy. De novo donor-specific antibodies (DSA) were tested for on both routine screening and at times of allograft dysfunction. A de novo DSA with an MFI greater than 500 on 2 separate occasions was considered positive. Graft loss was defined as a loss of kidney function requiring dialysis or retransplantation.
Statistical Analysis
All statistics were performed using the MedCalc statistical software package version 14.10.2 (Medcalc software, Belgium). Comparisons of means and frequencies of normally distributed variables were calculated using t tests and the χ2 test; nonparametric variables were analyzed by the Mann-Whitney U test. Kaplan-Meier survival analysis was used to calculate time of event from transplant, and significance was determined by log rank testing. Multivariate analyses were performed using Cox regression methods. A P value less than 0.05 was deemed statistically significant.
RESULTS
Six hundred twenty-eight patients with a combined total of 5638 outpatient tacrolimus levels were used for the final analysis. The mean number of tacrolimus levels for each patient studied was 8.98 ± 3.81, with an overall mean trough tacrolimus level of 6.95 ± 1.53 ng/mL. The mean follow-up of all patients included in the study was 4.72 ± 2.19 years.
The median COV of the trough tacrolimus levels for the whole group was 18.15% (IQR, 13.45-25.27%). Patients in the upper quartile with a COV greater than 25.27%, were defined as having the HHV, whereas patients whose COV fell between the median and the upper quartile with a COV between 18.15% and 25.27% were defined as having a HV. Patients whose COV fell between the median and the lower quartile with a COV between 13.45% and 18.15% were defined as having LV and patients in the lower quartile with a COV less than 13.45% were defined as having the LLV. Table 1 shows the patient demographics of the 4 different COV groups. There were no differences between the HHV, HV, LV, and LLV groups. There was a higher percentage of patients in the LV and LLV groups compared with those in the HV and HHV groups who received a preemptive transplant (LLV, 28.03%; LV, 29.30% vs HV, 17.20%; HHV, 16.56%; P = 0.02). Table 2 shows the minimum, maximum, and mean tacrolimus levels for each of the groups. Similar mismatch scores at HLA A, B, Cw, DR, and DQ were found between the HHV, HV, LV, and LLV groups, and there was no significant difference in the overall DQ DSA-free survival of those patients with 1 or more DQ antigen mismatch between the variability groups (P = 0.47). Tables showing the HLA mismatch scores and DQ DSA-free survival can be found in the SDC, http://links.lww.com/TXD/A48.
TABLE 1.
Patient demographics by COV group
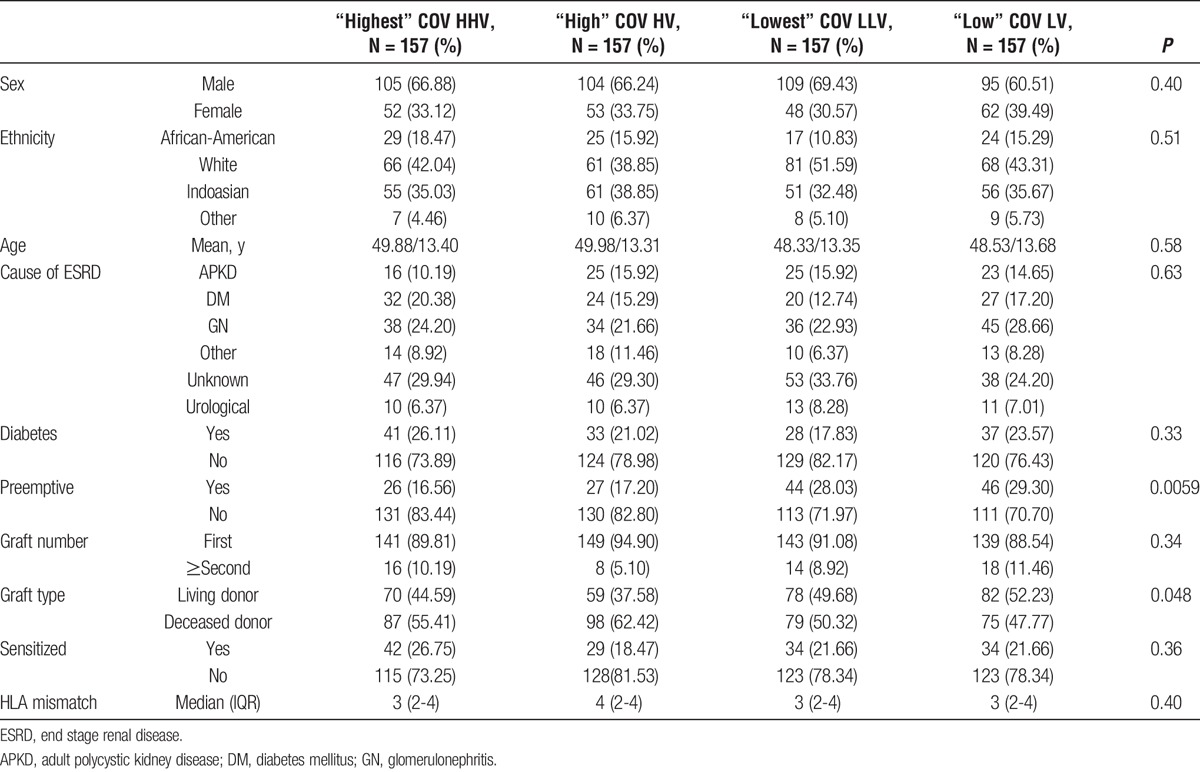
TABLE 2.
Mean tacrolimus levels for the HHV, HV, LLV and LV groups

Patient and Allograft Outcomes by COV
Patient survival was inferior in the HHV group compared with those in the LV group at 83.2% and 92.7%, respectively (P = 0.017), with a trend to inferior survival compared with both the HV and LLV groups with a survival of 93.2% (P = 0.053) and 91.6% (P = 0.08), respectively, as shown in Figure 1. There were no significant differences in the causes of death between the 4 groups. Censored allograft survival was significantly reduced in patients in the HHV group. Figure 2 shows that allograft survival was 77.2% in the HHV group, 89.5% in the HV group (P = 0.011), 89.4% in the LV group (P = 0.051), and 93.4% in the LLV group (P = 0.042). There were no significant differences in the causes of allograft loss between the 4 groups. Detailed tables showing the causes of death and allograft failure are shown in the SDC, http://links.lww.com/TXD/A48.
FIGURE 1.
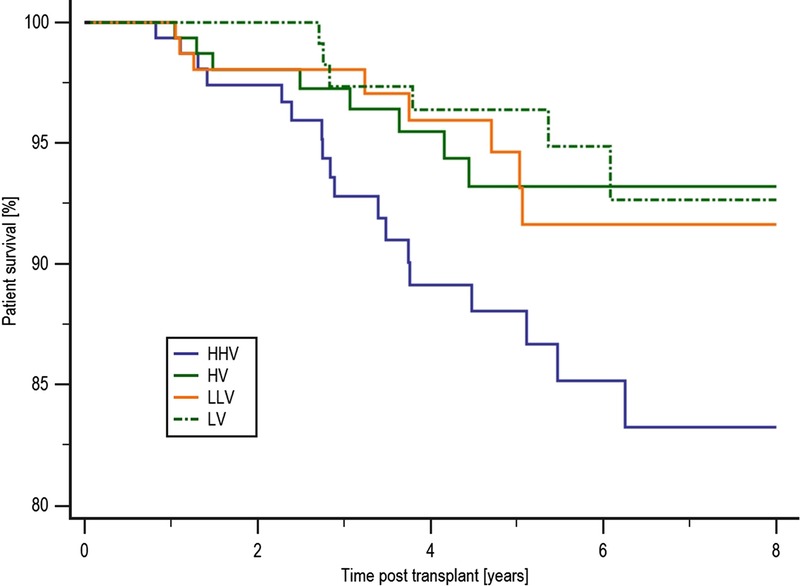
Patient survival by COV group. Patient survival was inferior in the HHV group compared with those in the LV group at 83.2% and 92.7%, respectively (P = 0.017), with a trend to inferior survival compared with both the HV and LLV groups with a survival of 93.2% (P = 0.053) and 91.6% (P = 0.08), respectively.
FIGURE 2.
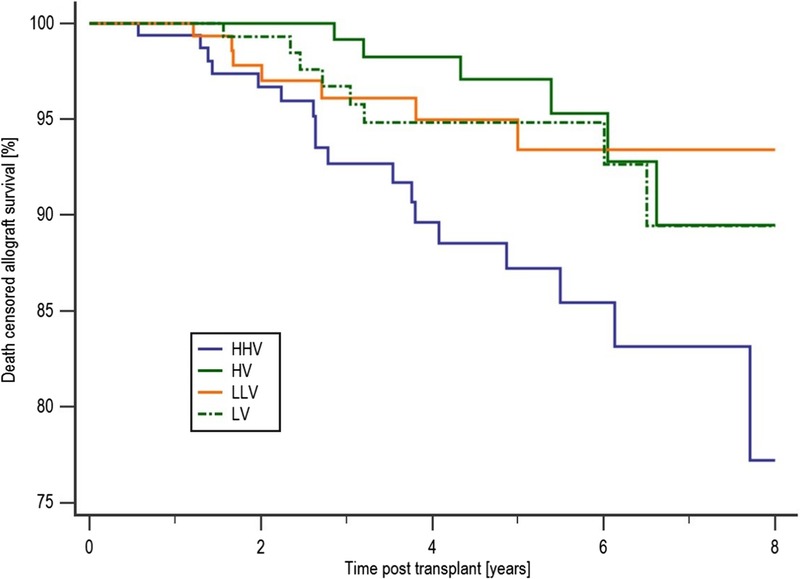
Death-censored allograft survival by COV group. Censored allograft survival was significantly reduced in patients in the HHV group. Compared with an allograft survival of 77.2% in the HHV group, patients in the HV group had an 89.5% survival (P = 0.011) and in the LV and LLV group allograft survival was 89.4%, P = 0.051 and 93.4%, respectively (P = 0.042).
Overall rejection-free survival was inferior in the HHV group compared with the LLV group at 77.7% and 89.7%, respectively (P = 0.023) as shown in Figure 3. Antibody-mediated rejection (AMR)-free survival was no different between the groups. However, acute cellular rejection (ACR)-free survival was inferior in the HHV group at 80.4% compared with either the HV group at 89.6% (P = 0.057) and the LLV group at 92.6% (P = 0.01). HHV patients were more likely to develop a de novo DSA than LLV patients, with a de novo DSA-free survival of 73.0% and 88.3%, respectively (P = 0.042).
FIGURE 3.
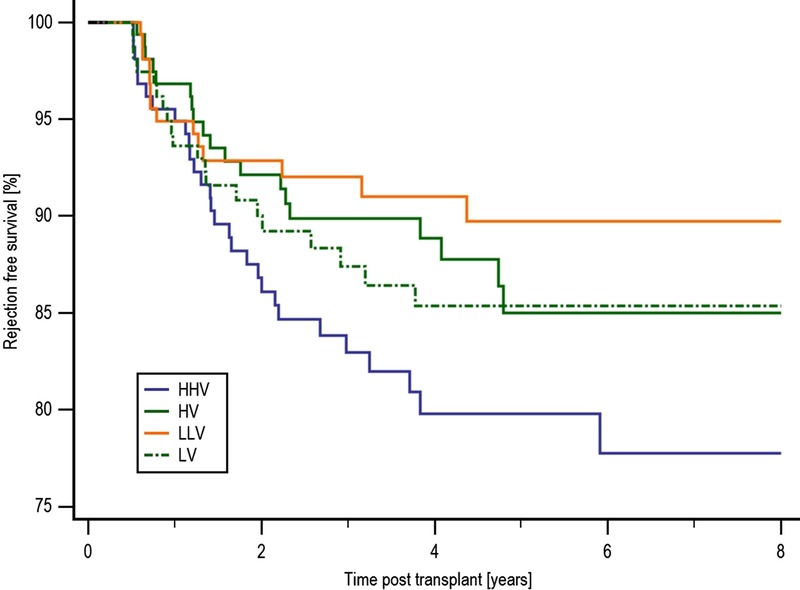
Rejection-free survival by COV group. Overall rejection-free survival was inferior in the HHV group compared with the LLV group at 77.7% and 89.7%, respectively (P = 0.023). There was no statistical difference in rejection-free survival between the HHV group and either of the HV or LV groups at 85.0% (P = 0.11) and 85.4% (P = 0.22), respectively.
Effect of IPV and Mean Tacrolimus Levels on Allograft Outcomes
The impact of mean tacrolimus level in conjunction with variability was subsequently analyzed. Five hundred twenty-eight (84.1%) of 628 patients had a mean tacrolimus level within our target range of 5-8 ng/mL, 248 (47.0%) of these 528 patients were classified as having HV, as shown in Table 3. Fifty-two (8.3%) of 628 patients had a mean tacrolimus level less than 5 ng/mL and 34 (65.3%) of these 52 patients were classified as HV. Forty-eight (7.6%) of 628 patients had a mean tacrolimus level greater than 9 ng/mL, of which 32 (66.7%) 48 were HV. There were no differences between the less than 5 ng/mL, 5 to 8 ng/mL, and greater than 9 ng/mL groups, with the exception that there were more patients who had diabetes at the time of transplant in the greater than 9 ng/mL group compared with the other 2 groups. The analysis is shown in the SDC, http://links.lww.com/TXD/A48.
TABLE 3.
Number of patients by mean tacrolimus (FK) level group

Allograft outcomes by mean tacrolimus level and variability are shown in Tables 4 and 5. There was no difference in overall patient survival between the groups. A detailed table showing the cause of death in each group is shown in the SDC, http://links.lww.com/TXD/A48.
TABLE 4.
Comparison of allograft outcomes by variability (HV/LV) and mean FK (<5, 5-8, >9 ng/mL) groups

TABLE 5.
Comparison of allograft outcomes by variability (HV/LV) and mean FK (<5, 5-8, >9 ng/mL) groups
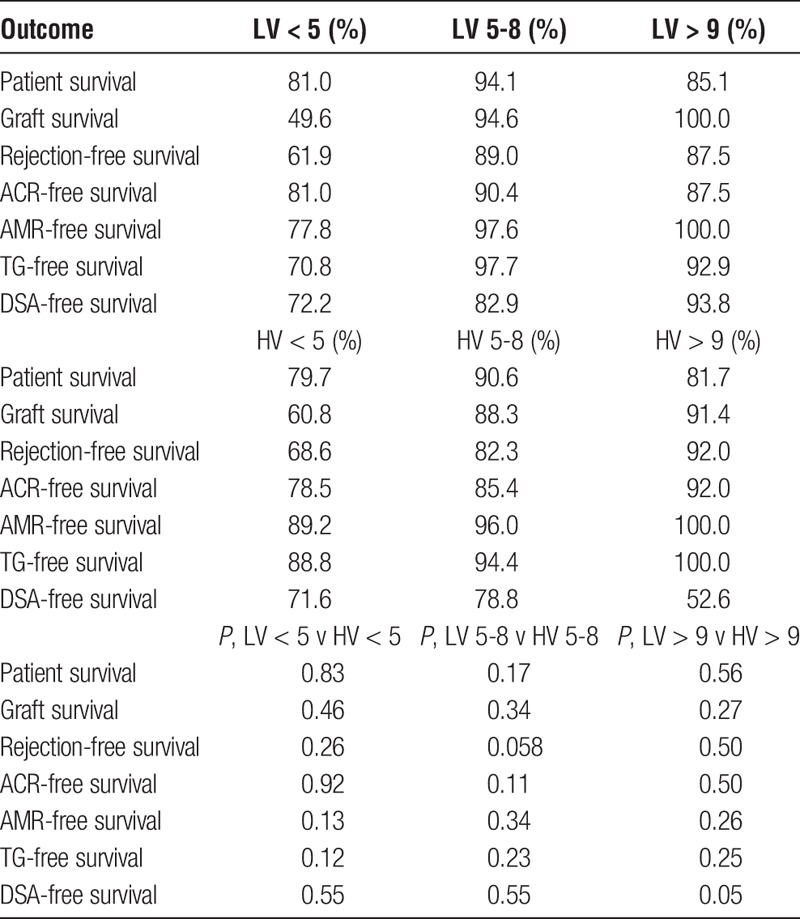
Allograft survival in the LV less than 5 ng/ml was significantly lower than the LV 5 to 8 ng/mL group, 49.6% compared with 94.6% (P < 0.0001) and independently lower than allograft survival in the LV greater than 9 ng/mL group at 100.0% (P = 0.019), as shown in Figure 4. A significant majority of patients in the less than 5 ng/mL group lost their graft due to rejection at 9 (17.31%) of 52, compared with 12 (2.27%) of 528 of the 5- to 8-ng/mL group, P < 0.0001 and 1 (2.08%) of 48 of the greater than 9 ng/mL group (P = 0.017). Allograft survival was also significantly lower in the HV less than 5 ng/mL group at 60.8% compared with HV 5 to 8 ng/mL group at 88.3% (P = 0.0032). Details of the causes of allograft failure in each of the subgroups are shown in the SDC, http://links.lww.com/TXD/A48.
FIGURE 4.
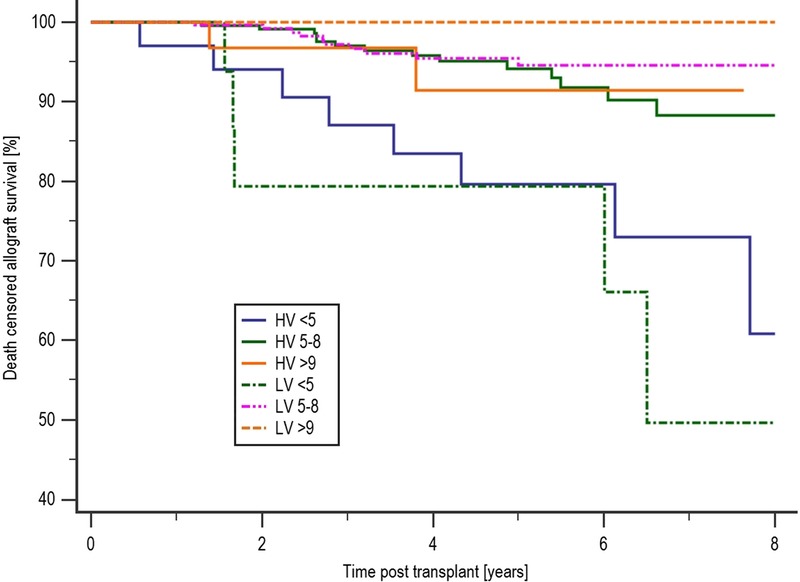
Allograft survival by mean tacrolimus and variability level. Allograft survival in the LV less than 5 was significantly lower than the LV 5 to 8 ng/mL group, 49.6% compared with 94.6% (P < 0.0001), and independently lower than allograft survival in the LV greater than 9 ng/mL group at 100.0% (P = 0.019).
Rejection-free survival in the LV less than 5 ng/mL group at 61.9% was inferior compared with the LV 5 to 8 ng/mL group at 89.0% (P = 0.0003). AMR-free survival was also inferior in the LV less than 5 ng/mL group compared with the LV 5 to 8 ng/mL group, with an AMR-free survival of 77.8% and 97.6%, respectively (P < 0.0001) and independently inferior to AMR-free survival in the LV greater than 9 ng/mL group at 100% (P = 0.049), as shown in Figure 5. In de novo DSA-free survival, the HV greater than 9 ng/ml group were more likely to develop DSA compared with the LV greater than 9 ng/mL group, with a DSA-free survival of 52.6% and 93.8%, respectively (P = 0.0499). There also appeared to be a higher risk of DSA development in the HV greater than 9 ng/mL group compared with the HV 5 to 8 ng/mL group, with a DSA-free survival of 52.6% and 78.8%, respectively (P = 0.041) as shown in Table 4. TG-free survival in the LV less than 5 ng/mL group at 70.8% was inferior to the LV 5 to 8 ng/mL group at 97.7% (P < 0.0001) as shown in Table 4.
FIGURE 5.
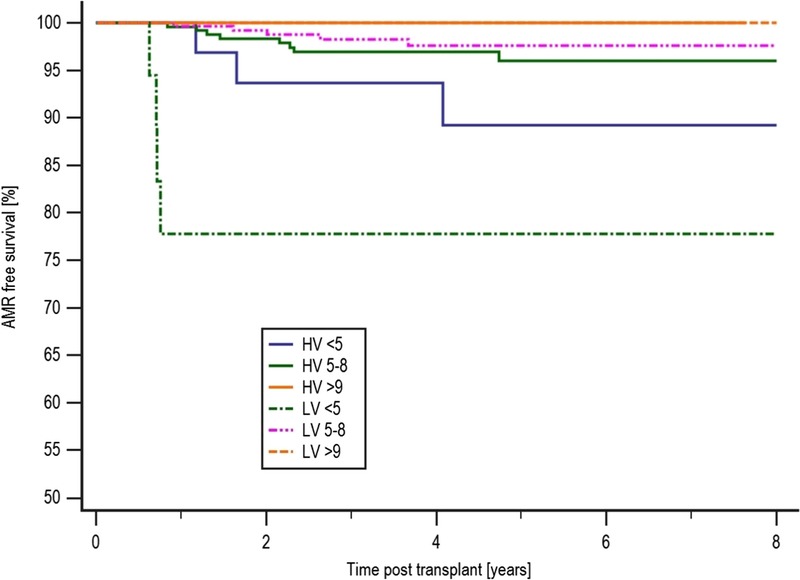
AMR-free survival by mean tacrolimus and variability level. AMR-free survival was also inferior in the LV less than 5 ng/mL group compared with the LV 5 to 8 ng/mL group, with an AMR-free survival of 77.8% and 97.6%, respectively (P < 0.0001).
Multivariate Analysis of Factors Associated With Patient Death, Allograft Failure and Rejection
To determine if mean tacrolimus levels and COV were independent risk factors for death and allograft loss, a multivariate analysis was performed. Variables considered in the model included: age, ethnicity, gender, diabetes at time of transplant, transplant type, preemptive status, the total mismatch (ABDR), degree of presensitization, de novo DSA, rejection, mean tacrolimus levels, COV and frequency of clinic nonattendance. Donor-related factors were not included in the analysis because our exclusion criterion of allograft failure and rejection in the first 6 months posttransplant appeared to diminish their impact on allograft survival, as shown in the SDC, http://links.lww.com/TXD/A48.
The independent variables shown to be associated with death were increasing age (1.04 [1.01-1.07], P = 0.0055), diabetes at time of transplant (2.79 [1.44-5.41], P = 0.0024), and rejection (2.34 [1.06-5.19], P = 0.036), whereas mean tacrolimus level greater than 9 ng/mL (2.29 [0.95-5.48], P = 0.06) and sensitized patients (2.07 [0.94-4.54], P = 0.069) showed a trend toward an increased risk of death.
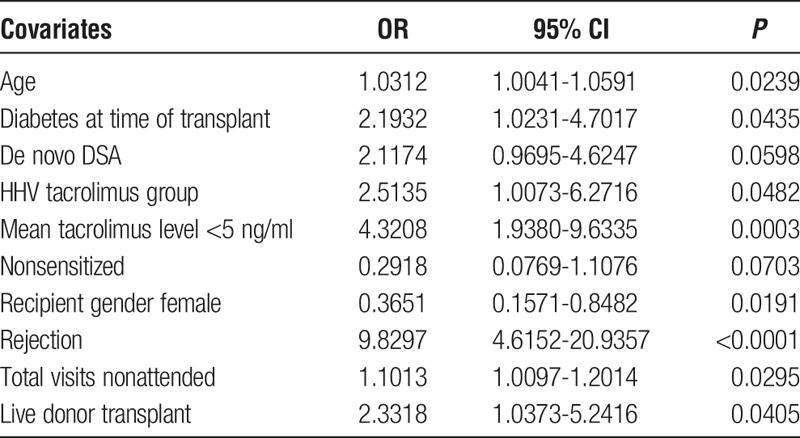
The factors which were retained in the model and significantly associated with graft loss are shown in Table 6 and include: the HHV group (2.51 [1.01-6.27], P = 0.048), mean tacrolimus level less than 5 ng/mL (4.32 [1.94-9.63], P = 0.0003), a high clinic nonattendance rate (1.10 [1.01-1.20], P = 0.03), rejection (9.83 [4.62-20.94], P < 0.0001), increasing age (1.03 [1.00-1.06], P = 0.024), live donor transplant (2.33 [1.04-5.24], P = 0.04), and diabetes at the time of transplant (2.19 [1.02-4.70], P = 0.044), whereas female sex (0.37 [0.16-0.85], P = 0.019) appeared to be protective. Presence of de novo DSA (2.12 [0.97-4.62], P = 0.0598) showed a trend towards an increased risk of graft loss and being nonsensitized [0.29(0.08-1.11), P = 0.0703] showed a trend toward protecting against the risk of graft loss.
TABLE 6.
Multivariate analysis of factors associated with allograft failure
A further multivariate analysis was performed to determine independent risk factors for rejection. Variables considered in the analysis are as described for the allograft loss model. We subsequently found that the factors associated with allograft rejection included: presence of a de novo DSA (3.15 [1.84-5.39], P < 0.0001), mean tacrolimus level less than 5 ng/mL (2.57 [1.27-5.19], P = 0.0086) and a high clinic nonattendance rate (1.11 [1.05-1.18], P = 0.0005).
Outpatient Clinic Attendance
The mean number of clinic nonattendances was 3.79 ± 3.61, and the median was 3 (range, 0-22). Patients with a HV of tacrolimus levels were significantly more likely not to attend their outpatient appointments as shown in Figure 6; the median number of nonattendances was 4 (range, 0-22) in the HV group and 2 (range, 0-17) in the LV group (P < 0.0001).
FIGURE 6.
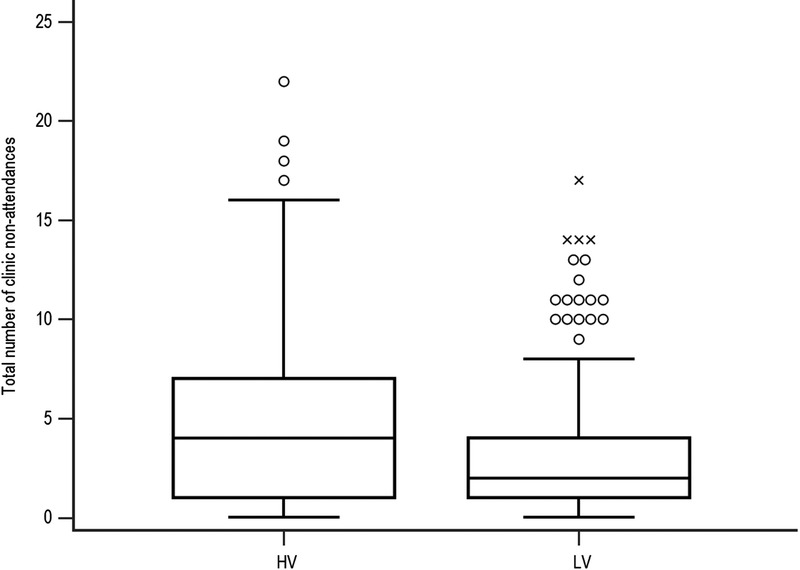
Comparison of clinic nonattendances by HV and LV. Patients with a HV of tacrolimus levels were significantly more likely not to attend their outpatient appointments; the median number of nonattendances was 4 (range, 0-22) in the HV group and 2 (range, 0-17) in the LV group (P < 0.0001).
Patients who developed rejection, a DSA, or lost their graft had a significantly higher number of outpatient nonattendances than those patients who did not develop rejection, a DSA or lose their graft as shown in Table 7.
TABLE 7.
Allograft outcomes by frequency of clinic nonattendance

DISCUSSION
This study shows that patients with HV of tacrolimus trough levels and clinic nonattendance are at increased risk of rejection and graft loss when maintained on a tacrolimus monotherapy immunosuppressive regimen after kidney transplantation. This adds to the now significant evidence that high IPVs, regardless of etiology, are associated with adverse outcomes in both cyclosporin and tacrolimus treated patients.9,11-14,16 In a study using cyclosporin, Kahan et al13 found the incidence of chronic rejection was less in patients with a low IPV at 24% compared with 40% in patients with a high IPV. Waiser et al12 found that patients with a higher cyclosporin IPV experienced a greater incidence of acute rejection, reduced 5-year graft survival and worse serum creatinine levels. In addition, patients with low cyclosporin levels experienced higher rates of acute rejection and inferior 5-year allograft survival, and they suggested that improving long-term allograft survival required a sufficiently high mean cyclosporin level in conjunction with a low IPV. Studies on the IPV of tacrolimus levels have also been published in renal transplantation, with Borra et al9 showing that high IPV of tacrolimus levels was associated with graft failure and Whalen et al14 showing that high IPV of tacrolimus levels was associated with increased risk of rejection and graft loss. Patients in the Borra study also received long term mycophenolate and 3 months of prednisolone, whereas patients in the Whalen study received long-term mycophenolate and prednisolone. As both studies reported inferior graft survival in association with a HV of tacrolimus levels, mycophenolate does not confer significant protection in the presence of high tacrolimus variability. High IPV has also been shown to be associated with late acute rejection and allograft loss in the paediatric literature.10,16
We also show that patients are at increased risk of developing rejection or losing their graft if their mean tacrolimus levels are low (<5 ng/mL). There are no randomized controlled trials comparing different therapeutic ranges of tacrolimus trough levels postkidney transplant. The Symphony Study team17 reported superior outcomes in the low dose tacrolimus arm (target range, 3-7 ng/mL) of their study when used in combination with mycophenolate mofetil (MMF) compared with those patients receiving either cyclosporin or sirolimus; however, the mean tacrolimus levels at month 12 were 6.4 ± 2.4 ng/mL and at month 36 were 6.5 ± 2.3 ng/mL which would not be considered particularly low. A provisional report published by the Collaborative Transplant Study showed that in a cohort consisting of over 8000 renal transplant recipients having a mean trough tacrolimus level less than 5.0 ng/mL at 1 year posttransplant resulted in significantly inferior allograft survival.18 MMF did not appear to confer significant protection.18 This suggests that tacrolimus levels as well as IPV are important determinants of outcome, as is the case with cyclosporin.12 There are clinical indications where tacrolimus trough levels do need to be minimized for example in the presence of infection or malignancy. However, analysis of those patients with mean tacrolimus levels less than 5 ng/ml in this study showed that 77.4% of them were maintained on low levels for no documented reason which implicates clinician nonadherence to protocol. We would therefore advocate maintaining tacrolimus trough levels greater than 5 ng/mL unless there are good mitigating clinical reasons.
There are many methods to measure nonadherence including the direct observation of the consumption of a medicine, assays of drug levels or their metabolites in serum or urine; patient self-reporting or collateral reporting from family, friends and physicians; pill counts, prescription refill records and attendance at clinic appointments.3,8,19,20
Attendance at clinic appointments tends to be a subjective measure of adherence used by transplant clinicians which is often not measured objectively using electronic patient records. In this study, we have shown objectively that patients with HV of their tacrolimus levels are significantly more likely not to attend their outpatient appointments and that a high nonattendance rate is associated with a significantly increased risk of development of DSA, rejection, and graft loss.
In clinical practice, a combination of different methods should to be used to accurately assess a patient’s adherence. Measuring the IPV of serum immunosuppressant trough levels has the potential to allow assessment of a patient’s adherence pattern over a given period.9,11,13,16 A high IPV of tacrolimus trough levels puts a patient at risk of both underimmunosuppression and overimmunosuppression with the respective clinical consequences of rejection in the former and calcineurin inhibitor toxicity, infection, and malignancy in the latter.9,11 There are many factors that can contribute to a high IPV of an immunosuppressant medicine, these include fluid shifts in the early posttransplant period, interacting medicines, pharmacokinetic factors affecting drug absorption or metabolism, and clinician-led changes in drug doses to ensure appropriate immunosuppression.11,21-24 Conversely, clinicians may fail to change drug doses to ensure appropriate immunosuppression which can be categorized as clinician nonadherence to protocol leading to patients running unintentionally subtherapeutic or supratherapeutic immunosuppression levels (as opposed to intentional subtherapeutic levels in the presence of malignancy or infection or higher levels in the presence of rejection). Given the retrospective nature of this study, we acknowledge that it cannot be assumed that a high IPV is due solely to a patient’s nonadherence. However, the addition of clinic nonattendance as a second surrogate marker of adherence does build upon the current evidence that a key factor that affects high IPV is nonadherence. We therefore support IPV being considered as a tool for assessing nonadherence and helping identify patients who may be at risk while recognizing that further prospective work is required to elucidate other causes of high IPV.
A limitation of this study is that the immunosuppression regimen used is not in widespread use. However, we have previously shown that alemtuzumab induction, followed by tacrolimus monotherapy postkidney transplant, gives equivalent results to the more common regimen of interleukin-2 receptor monoclonal antibody induction with a combination of tacrolimus and MMF postkidney transplant25 and that patients benefit from an immunosuppression regimen that is simple, cheap, and avoids long-term steroids. The regimen is also steroid sparing and steroid sparing regimes are now commonly used with various forms of induction therapy. It is also acknowledged that tacrolimus monotherapy could make patients more vulnerable to the adverse outcomes of nonadherence because patients are not offered any protection by other immunosuppressants if a dose of tacrolimus is missed. It has become increasingly apparent that nonadherence is an important problem for the transplant community given the adverse effect it has on allograft and patient outcomes.1,2,7,26 A recent study by Sellares et al1 demonstrates the risk of nonadherence succinctly. They reported on the causes of allograft failure in a large cohort of renal transplant patients and were able to show that 67% of all allograft failures were due to rejection, and 47% of these were as a consequence of nonadherence.1 A potential bias of this study is that patients who developed early rejection within the first 6 months posttransplant were excluded because early rejection can be caused by several confounding factors. Treatment of the rejection episode would have required enhanced immunosuppression including increased target trough levels of tacrolimus of 8 to 12 ng/mL which would have affected the IPV measured for those patients during 6 to 12 months posttransplant period of study.
An agreed definition for nonadherence to immunosuppression, adopted by KDIGO,3 is “a deviation from the prescribed medication regimen sufficient to adversely influence the regimen's intended effect.”20 It is likely that the prevalence of nonadherence is underestimated in renal transplant recipients as it is often difficult to measure and multifactorial in etiology.7,27 An estimate of the incidence of nonadherence in solid organ transplant patients was described in a meta-analysis, and nonadherence to immunosuppression medication was shown to be the highest in the renal transplant recipients.7 The potential reasons for the highest rate of nonadherence in renal transplant recipients were proposed by the authors to be due to the more serious consequences on health after failure of other solid organ transplants and more stringent psychosocial selection criteria in place for other organs.7 There are a number of risk factors that have been identified for predicting patients at higher risk of nonadherence.7,8,27 The meta-analysis by Dew et al7 found that nonwhite ethnicity, poorer social support and poorer perceived health were significantly associated with greater immunosuppression nonadherence in transplant patients. Other factors identified include a previous tendency to nonadherence, adverse effects to medication, psychiatric illness, inadequate education about the prescribed medications, illicit drug use, adolescence, time since transplant, a higher education, and complex medication regimens.7,19,26,27 Identifying patients within our clinical practice at risk of nonadherence is essential if poor outcomes are to be avoided although the optimum management to improve adherence is not yet known.
In conclusion, this study adds to the growing evidence base that both mean tacrolimus trough level and variability impact on allograft outcomes even in the short term, and it is the first study to report on the consequences of IPV in patients receiving a tacrolimus monotherapy regimen. Measuring the variability of a patient’s tacrolimus trough levels and outpatient clinic attendance are 2 simple tools that can be used in the clinic to assess nonadherence to immunosuppressive medication. Optimizing patient adherence to their immunosuppressive medication and physician adherence to target therapeutic ranges could lead to a significant improvement in long-term renal allograft outcomes. Other healthcare professionals are well placed to support physician colleagues in identifying nonadherent patients, assessing the barriers to adherence and making appropriate interventions. Nonadherence is a dynamic process which can change over time; therefore, it is likely that measuring the variability of immunosuppression levels in 6 to 12 months before the current outpatient clinic attendance would be beneficial in identifying patients currently at most risk of nonadherence. Prospective studies are required to fully determine the effect of any interventional measures undertaken on those patients identified as being nonadherent.
Supplementary Material
ACKNOWLEDGMENTS
The authors would like to especially thank Janet Lee and her colleagues in the Leslie Brent Laboratory at Hammersmith Hospital for their work and effort in providing immunosuppression levels for all our transplant patients. The authors would also like to thank the transplant clinic staff and the H&I laboratory. The research is supported by the National Institute for Health Research (NIHR) Biomedical Research Centre based at Imperial College Healthcare NHS Trust. The views expressed are those of the authors and not necessarily those of the NHS, the NIHR or the Department of Health.
Footnotes
Published online 7 June, 2017.
Disclosures: D.T. has received consultation fees from Sandoz and speaker fees from Bristol Myers Squibb. A.M.L. has received research funding from Astellas, which is not associated with this project; he has also received travel grants and speaker fees from Astellas. D.G. has received a travel grant, advisory board fees and speaker fees from Astellas.
Institutional review board statement: This study was approved by the Imperial College Renal and Transplant Centre, Transplant Clinical and Research Group.
D.G. designed the study, collected, and analyzed the data and wrote the article. M.W. contributed to the design of the study, collected, and analyzed the data and reviewed the article. A.M. contributed to the design of the study, collected data, and reviewed the article. D.T. contributed to the design of the study and to writing the article.
Supplemental digital content (SDC) is available for this article. Direct URL citations appear in the printed text, and links to the digital files are provided in the HTML text of this article on the journal’s Web site (www.transplantationdirect.com).
REFERENCES
- 1.Sellares J, de Freitas DG, Mengel M, et al. Understanding the causes of kidney transplant failure: the dominant role of antibody-mediated rejection and nonadherence. Am J Transplant. 2012;12:388–399. [DOI] [PubMed] [Google Scholar]
- 2.Wiebe C, Gibson IW, Blydt-Hansen TD, et al. Evolution and clinical pathologic correlations of de novo donor-specific HLA antibody post kidney transplant. Am J Transplant. 2012;12:1157–1167. [DOI] [PubMed] [Google Scholar]
- 3.Kidney Disease: Improving Global Outcomes (KDIGO) Transplant Work Group. KDIGO clinical practice guideline for the care of kidney transplant recipients. Am J Transplant. 2009;9(Suppl 3):S1–S155. [DOI] [PubMed] [Google Scholar]
- 4.Massey EK, Tielen M, Laging M, et al. The role of goal cognitions, illness perceptions and treatment beliefs in self-reported adherence after kidney transplantation: a cohort study. J Psychosom Res. 2013;75:229–234. [DOI] [PubMed] [Google Scholar]
- 5.Massey EK, Tielen M, Laging M, et al. Discrepancies between beliefs and behavior: a prospective study into immunosuppressive medication adherence after kidney transplantation. Transplantation. 2015;99:375–380. [DOI] [PubMed] [Google Scholar]
- 6.De Bleser L, Matteson M, Dobbels F, et al. Interventions to improve medication-adherence after transplantation: a systematic review. Transplant Int. 2009;22:780–797. [DOI] [PubMed] [Google Scholar]
- 7.Dew MA, DiMartini AF, De Vito Dabbs A, et al. Rates and risk factors for nonadherence to the medical regimen after adult solid organ transplantation. Transplantation. 2007;83:858–873. [DOI] [PubMed] [Google Scholar]
- 8.Schäfer-Keller P, Steiger J, Bock A, et al. Diagnostic accuracy of measurement methods to assess non-adherence to immunosuppressive drugs in kidney transplant recipients. Am J Transplant. 2008;8:616–626. [DOI] [PubMed] [Google Scholar]
- 9.Borra LC, Roodnat JI, Kal JA, et al. High within-patient variability in the clearance of tacrolimus is a risk factor for poor long-term outcome after kidney transplantation. Nephrol Dial Transplant. 2010;25:2757–2763. [DOI] [PubMed] [Google Scholar]
- 10.Pollock-BarZiv SM, Finkelstein Y, Manlhiot C, et al. Variability in tacrolimus blood levels increases the risk of late rejection and graft loss after solid organ transplantation in older children. Pediatr Transplant. 2010;14:968–975. [DOI] [PubMed] [Google Scholar]
- 11.Sapir-Pichhadze R, Wang Y, Famure O, et al. Time-dependent variability in tacrolimus trough blood levels is a risk factor for late kidney transplant failure. Kidney Int. 2013;85:1404–1411. [DOI] [PubMed] [Google Scholar]
- 12.Waiser J, Slowinski T, Brinker-Paschke A, et al. Impact of the variability of cyclosporin A trough levels on long-term renal allograft function. Nephrol Dial Transplant. 2002;17:1310–1317. [DOI] [PubMed] [Google Scholar]
- 13.Kahan BD, Urbauer DL, Mosheim MB, et al. Low intraindividual variability of cyclosporin A exposure reduces chronic rejection incidence and health care costs. J Am Soc Nephrol. 2000;11:1122–1131. [DOI] [PubMed] [Google Scholar]
- 14.Whalen HR, Glen JA, Harkins V, et al. High intrapatient tacrolimus variability is associated with worse outcomes in renal transplantation using a low-dose tacrolimus immunosuppressive regime. Transplantation. 2017;101:430–436. [DOI] [PubMed] [Google Scholar]
- 15.Solez K, Colvin RB, Racusen LC, et al. Banff 07 classification of renal allograft pathology: updates and future directions. Am J Transplant. 2008;8:753–760. [DOI] [PubMed] [Google Scholar]
- 16.Prytula AA, Bouts AH, Mathot RA, et al. Intra-patient variability in tacrolimus trough concentrations and renal function decline in pediatric renal transplant recipients. Pediatr Transplant. 2012;16:613–618. [DOI] [PubMed] [Google Scholar]
- 17.Ekberg H, Bernasconi C, Tedesco-Silva H, et al. Calcineurin inhibitor minimization in the Symphony study: observational results 3 years after transplantation. Am J Transplant. 2009;9:1876–1885. [DOI] [PubMed] [Google Scholar]
- 18.Opelz G. Newsletter 1:2014. Collaborative Transplant Study. February 1, 2014. http://www.ctstransplant.org/public/newsletters/2014/pdf/2014-1.pdf?ts=7986031137406826.
- 19.Osterberg L, Blaschke T. Adherence to medication. N Engl J Med. 2005;353:487–497. [DOI] [PubMed] [Google Scholar]
- 20.Fine RN, Becker Y, De Geest S, et al. Nonadherence consensus conference summary report. Am Transplant. 2009;9:35–41. [DOI] [PubMed] [Google Scholar]
- 21.Kuypers DR, Claes K, Evenepoel P, et al. The rate of gastric emptying determines the timing but not the extent of oral tacrolimus absorption: simultaneous measurement of drug exposure and gastric emptying by carbon-14-octanoic acid breath test in stable renal allograft recipients. Drug Metab Dispos. 2004;32:1421–1425. [DOI] [PubMed] [Google Scholar]
- 22.Kuypers DR, Vanrenterghem Y. Time to reach tacrolimus maximum blood concentration, mean residence time, and acute renal allograft rejection: an open-label, prospective, pharmacokinetic study in adult recipients. Clin Ther. 2004;26:1834–1844. [DOI] [PubMed] [Google Scholar]
- 23.Lampen A, Christians U, Guengerich FP, et al. Metabolism of the immunosuppressant tacrolimus in the small intestine: cytochrome P450, drug interactions, and interindividual variability. Drug Metab Dispos. 1995;23:1315–1324. [PubMed] [Google Scholar]
- 24.van Gelder T. Drug interactions with tacrolimus. Drug Saf. 2002;25:707–712. [DOI] [PubMed] [Google Scholar]
- 25.Chan K, Taube D, Roufosse C, et al. Kidney transplantation with minimized maintenance: alemtuzumab induction with tacrolimus monotherapy–an open label, randomized trial. Transplantation. 2011;92:774–780. [DOI] [PubMed] [Google Scholar]
- 26.Prendergast MB, Gaston RS. Optimizing medication adherence: an ongoing opportunity to improve outcomes after kidney transplantation. Clin J Am Soc Nephrol. 2010;5:1305–1311. [DOI] [PMC free article] [PubMed] [Google Scholar]
- 27.Denhaerynck K, Steiger J, Bock A, et al. Prevalence and risk factors of non-adherence with immunosuppressive medication in kidney transplant patients. Am J Transplant. 2007;7:108–116. [DOI] [PubMed] [Google Scholar]
Associated Data
This section collects any data citations, data availability statements, or supplementary materials included in this article.


