

Abstract
Primate cognition requires interaction processing. Interactions can reveal otherwise hidden properties of intentional agents, such as thoughts and feelings, and of inanimate objects, such as mass and material. Where and how interaction analyses are implemented in the brain is unknown. Using whole-brain functional magnetic resonance imaging in macaque monkeys, we discovered a network centered in the medial and ventrolateral prefrontal cortex that is exclusively engaged in social interaction analysis. Exclusivity of specialization was found for no other function anywhere in the brain. Two additional networks, a parieto-premotor and a temporal one, exhibited both social and physical interaction preference, which, in the temporal lobe, mapped onto a fine-grain pattern of object, body, and face selectivity. Extent and location of a dedicated system for social interaction analysis suggest that this function is an evolutionary forerunner of human mind-reading capabilities.
Recognizing physical objects and intentional agents, their actions, and their interactions is essential for understanding the world around us (Fig. 1A) (1–3). Monkeys recognize social interactions and their meaning quickly and effortlessly; they understand grooming, play, and fight, infer social rank from interactions, and use this knowledge to recruit allies (4, 5). Monkeys also understand that colliding objects exchange forces and make use of gravity and trajectory cues to search for falling food (6, 7). Understanding interactions is a core cognitive component in primates (3, 8). Yet little is known about the neural circuitry that underlies interaction processing. To chart the brain regions that process social and physical interactions, we presented naturalistic videos during whole-brain functional magnetic resonance imaging (fMRI) to four rhesus monkeys (supplementary materials, materials and methods). We used six main types of videos: (i) social interactions between monkeys, (ii) physical interactions between objects, (iii) monkeys engaged in independent goal-directed behaviors, (iv) objects moving independently, (v) non-acting monkeys, and (vi) stationary objects, along with low-level motion control and natural complex scene videos (Fig. 1B, movies S1 and S2, and materials and methods). Real-world videos were chosen to maximize cognitive engagement. For data analysis, we controlled for eye movements and visual motion energy through nuisance regression in the generalized linear model (GLM) and inspected several other behavioral features (figs. S1 and S2 and materials and methods). Brain activity for agents’ shape, actions, and social interactions and for objects’ interactions was defined as compared with matched control conditions with conjunction analyses (Fig. 1C and materials and methods).
Fig. 1.
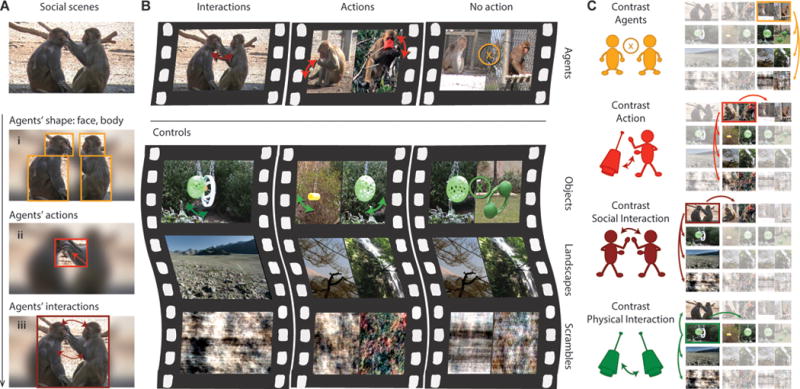
Task design and hypothesis (A) Hypothesized cognitive steps occurring when watching social interactions. (i) Processing agents’ shape, (ii) processing action, (iii) processing interaction. (B) Classes of videos used for stimuli and controls that monkeys could freely watch during the experiment. (C) Schematics of the contrasts (arrows between non blurred images) used in conjunction to identify brain activity related to four main conditions: agents, action, social interaction, and physical interaction. Pictures are presented in the same order as in (B).
Temporal and prefrontal cortices contain areas selective for specific categories of visual shape such as faces, bodies, or objects (9–11) and for shapes of particular categories set in motion (12–14). Because interactions reveal hidden features of agents and objects (for example, object mass and material during collision), some agent/object category or agent/object-motion selective areas might be specifically engaged by interactions. We therefore first mapped canonical face, body, and object patches with a standard localizer (Fig. S3A) (10) and then measured responses to naturalistic videos. Videos of inactive, active, and interacting monkeys all engaged classical face and body areas in the superior temporal sulcus (STS) and prefrontal cortex [P < 0.01, false discovery rate (FDR) corrected for multiple comparisons] (Fig. 2A and figs. S5 and S6) (14), and naturalistic videos of still, moving, and colliding objects activated regions overlapping with object patches. Region of interest (ROI) analysis revealed that category-selective areas differentiate between interaction types: agent-object interactions (agents performing goal-directed actions directed at objects compared with non acting agents) recruited body patches but not face patches [with the exception of face area prefrontal orbital (PO) and face-motion area middle dorsal (MD) (13); face area middle fundus (MF) showed even less activation] (Fig. 2B); social interactions recruited both face and body patches (Fig. 2C and D); and object-object interactions selectively recruited part of object patches only [for all, Student’s t tests, Holm-Bonferroni corrected for multiple comparisons by using family-wise error (FWE) rate at P < 0.05] (Fig. 2D). Thus, interaction-preference followed the fine-grain spatial organization for object categories: Even directly neighboring face and body areas differentiated between interaction types composed of the same category elements, faces and bodies.
Fig. 2.

From agents to actions to interactions. (A) Statistical map of enhanced activation for the Agents contrast. Shown is an inflated F99 cortical model of the right hemisphere, with dark gray regions representing sulci, light gray regions representing gyri (P < 0.01, FDR-corrected for multiple comparisons). The fMRI signal is enhanced in regions of the STS and frontal cortex that overlap with face and body patches independently identified (fig S3A). (B) Agent-object interactions assessed with the contrast (actions > agents) show enhanced activation of the body but not face patches. Bar plots are normalized signal changes for the contrast. Errorbars represent SD (* P < 0.05; ** P < 0.01; *** P < 0.001, all other comparisons are not significant, Holm-Bonferroni corrected for multiple comparison). (C) Same as (B). Agent-agent interactions assessed with the contrast (social interactions > actions) show both body and face patches enhanced activation. (D) Same as (B). Object-object interactions assessed with the contrast (physical interactions > social interactions) show that only object patches are more activated by physical than social interactions. (E) Statistical map of enhanced activation for the action contrast [same conventions as in (A)]. Significant activation is found in the parietal and premotor cortices in addition to the STS, in regions that overlap with classical MNS areas independently identified (fig. S3B). (F) Brain activity for social interactions compared with agents and landscapes and scramble controls shows a similar overlap. (G) Brain activity for physical interactions compared with objects moving independently and landscapes and scramble controls shows a similar overlap. (H) Overlaid activations for action, social interaction and physical interaction contrasts showing MNS recruitment by different types of interactions. (I) Statistical map of enhanced activation for the social interaction contrast [same conventions as in (A)] showing an extended network of regions significantly active for watching social interactions. Significant activation is found in the medial and dorsomedial prefrontal cortices (mPFC and dmPFC), in the ventrolateral prefrontal cortex (VLPFC), in the temporal pole (TP), and in parietal areas (7a), in addition to activation in the STS and in the parietal and premotor cortices. (J) Same map presented on anterior (“A”), dorsal (“D”), medial (“M”), ventral (“V”) and posterior (“P”) views of the flattened F99 cortical model of the right hemisphere, with black regions signifying not-represented non cortical parts of the brain. (K-N) Corresponding activations in subcortical areas (Amg BL/BM, BM, and Ce; Cd, caudate) displayed on coronal slices of the MNI-Paxinos template brain in radiological convention (left in figure is the right side of the brain). Coordinates are relative to interaural line. Cortical results are masked for display purposes.
Social and physical interactions engaged two additional areas, none of which were activated by non-interacting stimuli (agents or objects). These areas were located outside regions selective for faces, bodies, or objects discussed above: One area was located in the posterior portion of anterior intra parietal area (pAIP), and one in premotor area F5 (Student t-test, P < 0.01 FDR voxel-wise) (Fig. 2E and figs. S5 and S6). Both areas were activated by agent-object interactions (Fig 2E) but also by object-object interactions, and even more strongly by social interactions (Fig. 2, F and G). Both areas did not respond to movies of inactive monkeys (Fig. 2A) nor to independently moving objects, further emphasizing their interaction-selectivity. Social and physical interaction representations overlapped in F5, but occupied neighboring locations within pAIP (Fig. 2F to H). The anterior part of pAIP appeared even more activated by physical than any other type of interaction (Fig. 2H). The parieto-frontal cortex contains the mirror neuron system (MNS) (15). The classical MNS can be mapped in monkeys with fMRI by using videos of humans grasping objects (16). When mapping the MNS in this way (fig S3B, Movie S3), it co-localized with pAIP and F5 interaction areas (Fig. 2E–H). The MNS is thus engaged by three very different kinds of interactions, including the one it had been known for. If the MNS supports understanding of another agent’s actions upon objects (15), then by extension these findings imply a general role of the MNS for social and physical world understanding.
As social-cognitive species, primates understand the social interactions of others (4, 5). Social interactions, but not physical ones, activated a large set of brain regions beyond the category-selective networks and the MNS (Fig. 2, I to N). This social-interaction network (SIN) included parts of the medial prefrontal (mPFC) and anterior cingulate cortex (ACC) (areas 32 and 10mr and 24b respectively), dorsomedial prefrontal cortex (dmPFC) (areas F6 or Pre-SMA, 8Bm, and 9m), a temporo-parietal cluster (areas TPOc and 7a), parts of the ventro-lateral prefrontal cortex (vlPFC) (ventral part of F5, ventral part of 44, the posterior part of 47 and 12, and OPro), temporal pole regions (TPOi, STS areas 1 and 2, and TPpro), the perirhinal cortex (36R), dorsal STS areas (social posterior dorsal (sPD) and social anterior dorsal (sAD), located dorsally to the posterior lateral (PL) and anterior fundus (AF) face patches, and anterior dorsal (AD), a face patch located dorsally to face patch AF), and cortical and subcortical systems engaged in reward, valence, and emotional processing [caudate; amygdala; and areas 10o, 11l and 14r of the orbitofrontal cortex (OFC)] (fig. S5, A and D, and S6, A and D).
Large parts of the SIN network were exclusively selective for social interactions and did not respond to any other stimulus condition in the context of the present design. Areas of this exclusively social interaction network (ESIN) included a cluster in mPFC, ACC, and dmPFC; a cluster in vlPFC; area 7a in the inferior parietal lobule; and OFC areas 10o and 14r (Fig. 3, A and C, and fig. S5, A and E, and S6, A and E). The ESIN was even deactivated in all but the social interaction conditions (Fig. 3D). We did not find such exclusivity of functional specialization for any other stimulus category anywhere in the brain. However, the joint characteristic of the ESIN–social cognition focus and general deactivation during visual stimulation–bear resemblance to the human theory of mind (ToM) and the human default mode network (DMN) (17, 18). Curiously, ToM and DMN intersect in the human brain at regions of quite plausible homology to ESIN areas of the macaque brain. Thus the macaque ESIN shares functional and anatomical characteristics of human ToM and ESIN (Fig. S4).
Fig. 3.

A network of regions exclusively active for watching social interactions in the monkey brain. (A) Statistical map of enhanced activation for the social interaction contrast, with same conventions as in Fig.2. Black lines outline areas exclusively activated by videos of social interactions only and deactivated or not activated by any other visual stimulation. (B) Statistical map for regions exclusively activated by videos of social interactions (orange to yellow) and overlaid for comparison statistical map for the Action contrast (dark to light blue), on flattened and inflated views, with same conventions as in Fig 2. Activation for these two conditions appear close but are segregated in the parietal and VLPFC. Black circles indicate location of example ROIs defined with the social interaction contrast (7a, 32, and 9m are example areas of the ESIN, and TPv is an example area of the SIN). (C) Bar plots represent percent of fMRI signal change in those ROIs for all stimulus conditions. Conditions’ color code presented is presented at the bottom; pictures are presented in the same order as in Fig 1B. Errorbars represent SD (* P < 0.05; ** P < 0.01; *** P < 0.001; all other comparisons are not significant; Holm-Bonferroni corrected for multiple comparison).
We found three networks engaged in interaction analyses, each with distinct functional characteristics and internal organization. Are there overarching principles of organization for all areas processing interactions? We conducted principal component analysis (PCA) across the different movie categories on 43 regions of interest (Fig. 4, A and C). The areas in this space could be grouped into object, body, and face patches and classical MNS, SIN (without the ESIN), and ESIN. This analysis, as well as an analysis of correlation distances to the classical MNS and ESIN (Fig. 4B), showed a greater similarity of face patches to the ESIN than of any other ROIs. Because of their functional homogeneity, we then performed PCA in each of the six aforementioned groups of brain areas across the same stimulus conditions (Fig. 4D). SIN and ESIN separated the social interaction condition from all others along PC1. They did not differentiate the other two agency conditions (“acting” and “non acting”) along this dimension. Both properties were shared by the face patches (Fig 4D). The body patches, instead, separated all three agency conditions along PC1 and the three object conditions jointly along PC2 and PC1. This functional similarity suggests that face patches are putative entry points to the SIN and ESIN. Body and object patches turned out to be functionally related to the MNS (Fig. 4, A, B and D). It has been proposed that the MNS might provide inputs to the ToM network in humans (19). Functionally, however, the MNS differed substantially from the SIN and ESIN and was more similar to object and body patches, while the SIN and ESIN were closer to face areas (Fig. 4, A, B and D). Therefore, interaction analysis by two streams–already segregating inside the STS and feeding into the classical MNS and SIN, respectively–with different functions is the most plausible model for the organization of high-level world-processing in the primate brain.
Fig. 4.

Multiple social networks in the primate brain. (A) PCA of each area as a function of its mean activity to each condition of the main interaction paradigm. Colors and dashed contours indicate each brain area’s identity. Areas that are defined independently of the main task (object patches, face patches, object patches, or MNS) tend to cluster separately. A gradient of similarity mainly along the first principal component (PC1) goes from the object patches to the MNS to the body patches to the SIN and the ESIN. (B) Correlation distance of the object patches (green), face patches (yellow), and body patches (magenta) to the MNS (from left to right; blue arrow) and to the ESIN (from bottom to top; black arrow) based on their mean activity to the conditions of the task. Object and body patches are more closely related to the MNS, whereas face patches are more closely related to the ESIN. (C) Anatomical distances between areas displayed on a flat map of the monkey brain, provided for comparison with the PCA showed in (A), demonstrate that STS areas that appear interleaved anatomically are demixed functionally in response to the task conditions. (D) PCAs and dendrograms representing each condition (color code and legends to the right) as a function of its mean activity in each patch of the group. Spatial arrangements and tree clustering show a progressive separation of the physical interactions and social interactions respectively moving from the object patches (left) to the ESIN (right).
Visual analysis of interactions is a computationally daunting problem: Each interaction generates a complex spatio temporal flow pattern, each interaction category consists of many different such patterns, and even the smallest change to a pattern can change an interaction’s meaning. Yet primates understand the meaning of interactions effortlessly. To meet these computational challenges, which are even more demanding than those of invariant object recognition, a neural machinery at least as extensive as that for object recognition seems necessary. Our finding that large parts of shape-selective STS are interaction-selective and that the fine-grain pattern of interaction selectivity closely follows that of shape selectivity provides a possible answer to the puzzle of where visual interaction analysis takes place: The same machinery may perform both shape and interaction analyses, possibly parsing different results into MNS and SIN. This organization is markedly different from how motion activates the same region (13, 14) and reveals how deeply interaction analysis is ingrained in visual circuitry.
The MNS is thought to add depth to the processing of agent-object interactions by uncovering motor intentions behind observed object-directed actions and to do so through a process of simulation (15). Our results of broad MNS involvement across physical and social interactions can be parsimoniously interpreted by extension; the MNS would uncover through causal model simulations the hidden properties of physical objects and intentional agents and automatically reveal the wide set of affordances [action possibilities (20)] they offer for online engagement. The MNS would, according to this scenario, not just function in motor intention processing but play a major role in supporting general core cognitive functions of intuitive physics and psychology.
We report the existence of large regions of the monkey brain exclusively engaged in social interaction analysis. The monkey ESIN parallels properties of DMN (18) and ToM systems in humans (17) and even occupies locations very similar to regions of intersection of human DMN and ToM. Because of the known role of ToM areas in social theory driven deductions (17, 21), some parts of the monkey ESIN might play a role in elaborating, storing, and comparing species-specific socio-emotional scripts stipulating rules of social conduct (4, 5), whereas other parts might deduce inferences about other agents’ mental, emotional, and intentional states that explain their observed interactions.
The results of this study reveal a new dimension of tuning and functional organization of the STS, redefine the role of the mirror neuron system, and uncover the existence of a new high-level social cognition network with deep evolutionary heritage.
Supplementary Material
Acknowledgments
This work was supported by a Human Frontier Science Program Long-Term Fellowship (LT000418/2013-L, to J.S.), a Fondation pour la Recherche Médicale Post-doctoral fellowship (SPE20120523854, to J.S.), a Women&Science Post-doctoral Fellowship (to J.S.), a Bettencourt-Schueller Foundation Young Researcher Award (to J.S.), and a Dorothy-Leet/Association Francaise des Femmes Diplomees des Universites award (to J.S.), the Center for Brains, Minds and Machines funded by the National Science Foundation STC award CCF-1231216, the Kavli Neural Systems Institute at The Rockefeller University, the National Institute of Mental Health of the National Institutes of Health (R01MH105397, to W.A.F.), the McKnight Foundation (to W.A.F.), the Pew Charitable Trust (to W.A.F.), the National Eye Institute of the National Institutes of Health (R01 EY021594 to W.A.F.) and The New York Stem Cell Foundation (to W.A.F.). W.A.F. is a New York Stem Cell Foundation - Roberston Investigator. The content is solely the responsibility of the authors and does not necessarily represent the official views of the National Institutes of Health. We thank A. Ebihara, M. Fabiszak, C. Fisher, R. Huq, S.M. Landi, S. Sadagopan, C. M. Schwiedrzik, S.V. Shepherd, and W. Zarco for help with animal training, data collection, and discussion of methods; C. Fisher and C. M. Schwierdzik for communicating coordinates of areas MD, TPO, PGm and dMPFC; D. Amaral and C.J. Machado for sharing video material; E. Kirsch, S.M. Landi, and S.V. Shepherd for help with stimulus preparation; B. Deen for comments on the manuscript; L. Diaz, A. Gonzalez and S. Rasmussen for veterinary and technical care. Data are available from the Dryad Digital Repository: Dryad Digital Repository: http://dx.doi.org/10.5061/dryad.321kr
Footnotes
References and Notes
- 1.Heider F, Simmel M. An experimental study of apparent behavior. American Journal of Psychology. 1944;57:243. [Google Scholar]
- 2.Ambady N, Bernieri FJ, Richeson JA. Toward a histology of social behavior: Judgmental accuracy from thin slices of the behavioral stream. Advances in Experimental Social Psychology. 2000;32:201. [Google Scholar]
- 3.Spelke ES, Kinzler KD. Core knowledge. Dev Sci. 2007;10:89. doi: 10.1111/j.1467-7687.2007.00569.x. [DOI] [PubMed] [Google Scholar]
- 4.Cheney D, Seyfarth R, Smuts B. Social relationships and social cognition in nonhuman primates. Science. 1986;234:1361. doi: 10.1126/science.3538419. [DOI] [PubMed] [Google Scholar]
- 5.Bergman TJ, Beehner JC, Cheney DL, Seyfarth RM. Hierarchical classification by rank and kinship in baboons. Science. 2003;302:1234. doi: 10.1126/science.1087513. [DOI] [PubMed] [Google Scholar]
- 6.Santos LR. ‘Core Knowledges’: a dissociation between spatiotemporal knowledge and contact-mechanics in a non-human primate? Dev Sci. 2004;7:167. doi: 10.1111/j.1467-7687.2004.00335.x. [DOI] [PubMed] [Google Scholar]
- 7.Hood BM, Hauser MD, Anderson L, Santos L. Gravity biases in a non-human primate? Dev Sci. 1999;2:35. [Google Scholar]
- 8.Grahe JE, Bernieri FJ. The Importance of Nonverbal Cues in Judging Rapport. Journal of Nonverbal Behavior. 1999;23:253. [Google Scholar]
- 9.Kanwisher N. Functional specificity in the human brain: A window into the functional architecture of the mind. Proceedings of the National Academy of Sciences. 2010 Jun 22;107:11163. doi: 10.1073/pnas.1005062107. [DOI] [PMC free article] [PubMed] [Google Scholar]
- 10.Tsao DY, Freiwald WA, Knutsen TA, Mandeville JB, Tootell RB. Faces and objects in macaque cerebral cortex. Nature neuroscience. 2003;6:989. doi: 10.1038/nn1111. [DOI] [PMC free article] [PubMed] [Google Scholar]
- 11.Pinsk MA, DeSimone K, Moore T, Gross CG, Kastner S. Representations of faces and body parts in macaque temporal cortex: A functional MRI study. Proceedings of the National Academy of Sciences of the United States of America. 2005;102:6996. doi: 10.1073/pnas.0502605102. [DOI] [PMC free article] [PubMed] [Google Scholar]
- 12.Jastorff J, Popivanov ID, Vogels R, Vanduffel W, Orban GA. Integration of shape and motion cues in biological motion processing in the monkey STS. NeuroImage. 2012;60:911. doi: 10.1016/j.neuroimage.2011.12.087. [DOI] [PubMed] [Google Scholar]
- 13.Fisher C, Freiwald WA. Contrasting specializations for facial motion within the macaque face-processing system. Curr Biol. 2015;25:261. doi: 10.1016/j.cub.2014.11.038. [DOI] [PMC free article] [PubMed] [Google Scholar]
- 14.Russ BE, Leopold DA. Functional MRI mapping of dynamic visual features during natural viewing in the macaque. NeuroImage. 2015;109:84. doi: 10.1016/j.neuroimage.2015.01.012. [DOI] [PMC free article] [PubMed] [Google Scholar]
- 15.Rizzolatti G, Craighero L. The mirror-neuron system. Annu Rev Neurosci. 2004;27:169. doi: 10.1146/annurev.neuro.27.070203.144230. [DOI] [PubMed] [Google Scholar]
- 16.Nelissen K, Luppino G, Vanduffel W, Rizzolatti G, Orban GA. Observing Others: Multiple Action Representation in the Frontal Lobe. Science. 2005;310:332. doi: 10.1126/science.1115593. [DOI] [PubMed] [Google Scholar]
- 17.Gallagher HL, Frith CD. Functional imaging of “theory of mind”. Trends in Cognitive Sciences. 2003;7:77. doi: 10.1016/s1364-6613(02)00025-6. [DOI] [PubMed] [Google Scholar]
- 18.Mars RB, et al. On the relationship between the ‘default mode network’ and the ‘social brain’. Frontiers in Human Neuroscience. 2012;6 doi: 10.3389/fnhum.2012.00189. [DOI] [PMC free article] [PubMed] [Google Scholar]
- 19.Blakemore SJ, Decety J. From the perception of action to the understanding of intention. Nat Rev Neurosci. 2001;2:561. doi: 10.1038/35086023. [DOI] [PubMed] [Google Scholar]
- 20.Gibson JJ. The Ecological Approach to Visual Perception. Houghton Miffin; Boston: 1979. [Google Scholar]
- 21.Olson IR, Plotzker A, Ezzyat Y. The Enigmatic temporal pole: a review of findings on social and emotional processing. Brain : a journal of neurology. 2007;130:1718. doi: 10.1093/brain/awm052. [DOI] [PubMed] [Google Scholar]
- 22.Wegener D, Freiwald WA, Kreiter AK. The influence of sustained selective attention on stimulus selectivity in macaque visual area MT. The Journal of Neuroscience. 2004;24:6106. doi: 10.1523/JNEUROSCI.1459-04.2004. [DOI] [PMC free article] [PubMed] [Google Scholar]
- 23.Tsao DY, et al. Stereopsis Activates V3A and Caudal Intraparietal Areas in Macaques and Humans. Neuron. 2003;39:555. doi: 10.1016/s0896-6273(03)00459-8. [DOI] [PubMed] [Google Scholar]
- 24.Nelissen K, et al. Action Observation Circuits in the Macaque Monkey Cortex. The Journal of Neuroscience. 2011;31:3743. doi: 10.1523/JNEUROSCI.4803-10.2011. [DOI] [PMC free article] [PubMed] [Google Scholar]
- 25.Moeller S, Freiwald WA, Tsao DY. Patches with links: a unified system for processing faces in the macaque temporal lobe. Science. 2008;320:1355. doi: 10.1126/science.1157436. [DOI] [PMC free article] [PubMed] [Google Scholar]
- 26.Machado CJ, Bliss-Moreau E, Platt ML, Amaral DG. Social and Nonsocial Content Differentially Modulates Visual Attention and Autonomic Arousal in Rhesus Macaques. PLoS ONE. 2011;6:e26598. doi: 10.1371/journal.pone.0026598. [DOI] [PMC free article] [PubMed] [Google Scholar]
- 27.Symons D. Rhesus Play. Harvard University Film Study Center; 1977. [Google Scholar]
- 28.Schwiedrzik CM, Zarco W, Everling S, Freiwald WA. Face Patch Resting State Networks Link Face Processing to Social Cognition. PLoS Biol. 2015;13:e1002245. doi: 10.1371/journal.pbio.1002245. [DOI] [PMC free article] [PubMed] [Google Scholar]
- 29.Bartels A, Zeki S, Logothetis NK. Natural Vision Reveals Regional Specialization to Local Motion and to Contrast-Invariant, Global Flow in the Human Brain. Cerebral Cortex. 2008;18:705. doi: 10.1093/cercor/bhm107. [DOI] [PubMed] [Google Scholar]
- 30.Guipponi O, Odouard S, Pinède S, Wardak C, Hamed SB. fMRI cortical correlates of spontaneous eye blinks in the nonhuman primate. Cerebral Cortex. 2014;bhu038 doi: 10.1093/cercor/bhu038. [DOI] [PubMed] [Google Scholar]
- 31.Landman R, Sharma J, Sur M, Desimone R. Effect of distracting faces on visual selective attention in the monkey. Proceedings of the National Academy of Sciences. 2014;111:18037. doi: 10.1073/pnas.1420167111. [DOI] [PMC free article] [PubMed] [Google Scholar]
- 32.Ebitz RB, Pearson JM, Platt ML. Pupil size and social vigilance in rhesus macaques. Frontiers in Neuroscience. 2014;8 doi: 10.3389/fnins.2014.00100. [DOI] [PMC free article] [PubMed] [Google Scholar]
- 33.Leite FP, et al. Repeated fMRI Using Iron Oxide Contrast Agent in Awake, Behaving Macaques at 3 Tesla. NeuroImage. 2002;16:283. doi: 10.1006/nimg.2002.1110. [DOI] [PubMed] [Google Scholar]
- 34.Worsley KJ, et al. A general statistical analysis for fMRI data. NeuroImage. 2002;15:1. doi: 10.1006/nimg.2001.0933. [DOI] [PubMed] [Google Scholar]
- 35.Koyama M, et al. Functional magnetic resonance imaging of macaque monkeys performing visually guided saccade tasks: comparison of cortical eye fields with humans. Neuron. 2004;41:795. doi: 10.1016/s0896-6273(04)00047-9. [DOI] [PubMed] [Google Scholar]
- 36.Frey S, et al. An MRI based average macaque monkey stereotaxic atlas and space (MNI monkey space) NeuroImage. 2011;55:1435. doi: 10.1016/j.neuroimage.2011.01.040. [DOI] [PubMed] [Google Scholar]
- 37.Jenkinson M, Beckmann CF, Behrens TEJ, Woolrich MW, Smith SM. FSL. NeuroImage. 2012;62:782. doi: 10.1016/j.neuroimage.2011.09.015. [DOI] [PubMed] [Google Scholar]
- 38.Andersson J, Jenkinson M, Smith S. Non-linear registration, aka spatial normalisation. FMRIB technical report. 2010;TR07JA2 [Google Scholar]
- 39.Benjamini Y, Hochberg Y. Controlling the false discovery rate: a practical and powerful approach to multiple testing. Journal of the Royal Statistical Society Series B (Methodological) 1995;289 [Google Scholar]
- 40.Nichols T, Brett M, Andersson J, Wager T, Poline JB. Valid conjunction inference with the minimum statistic. NeuroImage. 2005;25:653. doi: 10.1016/j.neuroimage.2004.12.005. [DOI] [PubMed] [Google Scholar]
- 41.Poldrack RA, Mumford JA, Nichols TE. Handbook of functional MRI data analysis. Cambridge University Press; 2011. [Google Scholar]
- 42.Dale AM, Fischl B, Sereno MI. Cortical surface-based analysis: I. Segmentation and surface reconstruction. NeuroImage. 1999;9:179. doi: 10.1006/nimg.1998.0395. [DOI] [PubMed] [Google Scholar]
- 43.Fischl B, Sereno MI, Dale AM. Cortical surface-based analysis: II: inflation, flattening, and a surface-based coordinate system. NeuroImage. 1999;9:195. doi: 10.1006/nimg.1998.0396. [DOI] [PubMed] [Google Scholar]
- 44.Van Essen DC. Windows on the brain: the emerging role of atlases and databases in neuroscience. Current Opinion in Neurobiology. 2002;12:574. doi: 10.1016/s0959-4388(02)00361-6. [DOI] [PubMed] [Google Scholar]
- 45.Lewis JW, Van Essen DC. Mapping of architectonic subdivisions in the macaque monkey, with emphasis on parieto-occipital cortex. Journal of Comparative Neurology. 2000;428:79. doi: 10.1002/1096-9861(20001204)428:1<79::aid-cne7>3.0.co;2-q. [DOI] [PubMed] [Google Scholar]
- 46.Van Essen DC, Glasser MF, Dierker DL, Harwell J. Cortical parcellations of the macaque monkey analyzed on surface-based atlases. Cerebral Cortex. 2011;bhr290 doi: 10.1093/cercor/bhr290. [DOI] [PMC free article] [PubMed] [Google Scholar]
- 47.Paxinos G, Huang XF, Toga AW. The rhesus monkey brain in stereotaxic coordinates. 2000 [Google Scholar]
- 48.Markov N, et al. Weight consistency specifies regularities of macaque cortical networks. Cerebral Cortex. 2011;21:1254. doi: 10.1093/cercor/bhq201. [DOI] [PMC free article] [PubMed] [Google Scholar]
- 49.Vul E, Harris C, Winkielman P, Pashler H. Puzzlingly high correlations in fMRI studies of emotion, personality, and social cognition. Perspectives on psychological science. 2009;4:274. doi: 10.1111/j.1745-6924.2009.01125.x. [DOI] [PubMed] [Google Scholar]
- 50.Cunningham JP, Yu BM. Dimensionality reduction for large-scale neural recordings. Nature neuroscience. 2014;17:1500. doi: 10.1038/nn.3776. [DOI] [PMC free article] [PubMed] [Google Scholar]
- 51.Vanduffel W, et al. Visual Motion Processing Investigated Using Contrast Agent-Enhanced fMRI in Awake Behaving Monkeys. Neuron. 2001;32:565. doi: 10.1016/s0896-6273(01)00502-5. [DOI] [PubMed] [Google Scholar]
- 52.Op De Beeck H, Vogels R. Spatial sensitivity of macaque inferior temporal neurons. Journal of Comparative Neurology. 2000;426:505. doi: 10.1002/1096-9861(20001030)426:4<505::aid-cne1>3.0.co;2-m. [DOI] [PubMed] [Google Scholar]
- 53.Rust NC, DiCarlo JJ. Selectivity and Tolerance (“Invariance”) Both Increase as Visual Information Propagates from Cortical Area V4 to IT. The Journal of Neuroscience. 2010;30:12978. doi: 10.1523/JNEUROSCI.0179-10.2010. [DOI] [PMC free article] [PubMed] [Google Scholar]
- 54.Ferrari PF, Gallese V, Rizzolatti G, Fogassi L. Mirror neurons responding to the observation of ingestive and communicative mouth actions in the monkey ventral premotor cortex. European Journal of Neuroscience. 2003;17:1703. doi: 10.1046/j.1460-9568.2003.02601.x. [DOI] [PubMed] [Google Scholar]
Associated Data
This section collects any data citations, data availability statements, or supplementary materials included in this article.