

Abstract
Effective therapies for non-small cell lung cancer (NSCLC) remain challenging despite an increasingly comprehensive understanding of somatically altered oncogenic pathways. It is now clear that therapeutic agents with potential to impact the tumor immune microenvironment potentiate immune-orchestrated therapeutic benefit. Herein we evaluated the immunoregulatory properties of histone deacetylase (HDAC) and bromodomain inhibitors, two classes of drugs that modulate the epigenome, with a focus on key cell subsets that are engaged in an immune response. By evaluating human peripheral blood and NSCLC tumors, we show that the selective HDAC6 inhibitor ricolinostat promotes phenotypic changes that support enhanced T cell activation and improved function of antigen presenting cells. The bromodomain inhibitor JQ1 attenuated CD4+Foxp3+ T regulatory cell suppressive function and synergized with ricolinostat to facilitate immune-mediated tumor growth arrest, leading to prolonged survival of mice with lung adenocarcinomas. Collectively, our findings highlight the immunomodulatory effects of two epigenetic modifiers that, together, promote T cell-mediated anti-tumor immunity and demonstrate their therapeutic potential for treatment of NSCLC.
Keywords: Histone deacetylase inhibitor, Bromodomain inhibitor, Non-small cell lung cancer, immunomodulatory, immunotherapy
Introduction
The tumor microenvironment contains a variety of stromal/supporting cells, including those of hematopoietic origin. Specific cell types such as T lymphocytes, natural killer (NK) cells, and various myeloid cells play diverse roles in shaping the course of the immune response against cancer [1–3]. Of particular importance are antigen-presenting cells (APCs), which process tumor-associated antigens (TAAs) and present them to potential tumor-reactive T cells in a process that leads to T cell priming. Despite their potential to generate an anti-tumor response, T cell antigen-specific responses are often inhibited by immunosuppressive cells such as myeloid-derived suppressor cells (MDSCs) and CD4+FOXP3+ regulatory T cells (Tregs) [4–6]. Thus, agents that promote stimulatory immuno-phenotypic and functional changes in APCs and effector T cells or disrupt inhibitory cellular mechanisms may generate a more permissive tumor microenvironment favoring enhanced anti-tumor responses.
Histone deacetylases (HDACs) are a family of enzymes that modulate the expression of genes or their products by removing acetyl groups from lysine residues on histone and non-histone proteins. As a consequence, they regulate numerous cellular processes, some of which have been implicated in aspects of tumor development and behavior such as differentiation and cell cycle progression in malignant cells, as well as apoptosis [7–9]. Class I and II HDACs are among the most active regulators of histone and non-histone proteins in cancer [10] and their pharmacologic inhibition is seeing increasing interest for treatment of solid cancers. The contribution of the various classes of the HDAC family to tumor pathogenesis is well documented. Class I HDACs have been reported to contribute to the transformation of epithelial cells and/or metastasis [11, 12] while members of class II HDACs play critical roles in regulating autophagy, proliferation and differentiation in tumor cells [13–16]. The roles of class III (Sirtuins) and class IV HDAC family members are still emerging although existing reports implicate their involvement in DNA damage response pathways, chromatin regulation, genome integrity, cell survival under stress, tumor metabolism and cell death [17–19]. Given their clear importance in cancer pathogenesis, pharmacologic inhibition of HDACs has become an area of significant interest for cancer therapy.
Several studies have evaluated the relative utility of both pan- and isozyme-selective HDAC inhibitors for cancer therapy [20, 21]. Although promising therapeutic outcomes have been demonstrated using pan-HDAC inhibitors, especially when combined with chemotherapeutic drugs, their use is associated with adverse effects and dose-limiting toxicity in patients [22–25]. Thus, isozyme-specific inhibitors may offer improved benefits arising from their selective inhibition of some but not all HDACs. While many translational studies exploring the therapeutic efficacy of HDAC inhibitors have focused on their effects on malignant cells [26–28], multiple studies have highlighted the immunomodulatory activity of HDAC inhibitors on various immune cellular subsets when used alone or in combination with other immunotherapeutic agents [8, 9, 20, 21, 29–33]. Furthermore, HDAC inhibitors have been shown to promote tumor cell recognition by immune cells via induction of MHC constituents and antigen-presentation machinery on tumor cells [34]. Despite these data, the effects of HDAC inhibitors on the cellular constituents of the tumor immune microenvironment remains poorly understood.
Bromodomain inhibitors are a second class of agents that alter cellular epigenetic and transcriptional programs through regulating the recognition of acetylated lysine residues by transcriptional machinery. JQ1 is a well-characterized inhibitor of the bromodomain and extraterminal (BET) family of bromodomain-containing proteins and may indirectly regulate epigenetic footprints by modulating the interactions of histone acetyl transferases (HATs) and HDACs with transcription factors and proteins involved in gene expression [35]. While JQ1, like other BET inhibitors, has demonstrated efficacy in hematologic malignancies, its efficacy in solid cancers has only recently been explored. For example, JQ1 was shown to synergize with the pan-HDAC inhibitor SAHA to suppress tumor growth in models of pancreatic ductal and lung adenocarcinoma [36]. Although the mechanisms governing therapeutic synergy were not fully explored in that report, it was suggested that these agents function to repress MYC expression and inflammatory cascades that regulate IL-6 levels [36]. Thus, the effect of JQ1 on tumor-associated immune cells from this and other studies remains largely undefined.
Recent preclinical and clinical data generated with antibodies that target immune checkpoints, namely PD-1/PD-L1 and CTLA-4, demonstrate that anti-tumor immunity can be driven in multiple tumor types by targeting inhibitory interactions among T cells, APCs, and tumor cell populations [37, 38]. While the use of these agents represents a major advance in the treatment of cancer, it remains the case that in most tumor types, only a minority of patients respond and the barriers to response are diverse and poorly characterized. As the durability of anti-tumor immunity is increasingly appreciated to hinge upon immune cell contributions, we sought to identify the immunomodulatory effects of small molecule epigenetic modulators including selective HDAC inhibitors and JQ1. We describe significant dynamic changes with respect to phenotype and function of T cells and monocytes/macrophages in peripheral tissues as well as in the tumor microenvironment by ricolinostat (ACY-1215), an HDAC inhibitor selective for the class II HDAC6. We also describe the Treg-specific effects of JQ1, which serves as the basis for its use as a partner agent with ricolinostat, a combination that facilitated sustained anti-tumor responses in immunocompetent, genetically engineered mouse models of non-small cell lung cancer (NSCLC).
Results
Ricolinostat reduced the frequency of CD4+FOXP3+ Tregs and promoted transient activation of peripheral and tumor-associated T lymphocytes
HDAC inhibition results in tumor growth arrest in immunocompetent animal models [39–41]. As HDACs are ubiquitously expressed in many tissues, including immune cells, an outstanding issue is whether some of the reported therapeutic benefits of HDAC inhibitors stem from their effects on immune cells. In this regard, we sought to determine the effects of selective inhibition of members of class I and class II HDACs on leukocytes. First, we cultured peripheral blood mononuclear cells (PBMCs) from healthy donors with ricolinostat and compared it with a panel of HDAC inhibitors with varying selectivity for class I HDACs 1/2/3 and class II HDAC6 including ACY-241, ACY-738, ACY-775, and tubastatin A. This panel also included entinostat (MS-275), a class I HDAC-selective agent currently being evaluated in clinical trials, in order to assess the relative impact of selective inhibition of class I HDAC enzymes (Supplementary Table 1). Notably, viability of cells cultured for 24 hours with these HDAC inhibitors was largely similar (Supplementary Fig. S1A). Furthermore, the proportions (Supplementary Fig. S1B) and phenotype (not shown) of leukocyte subsets, including monocytes, B cells, NK cells, CD4+FOXP3- and CD8+ conventional T cells were not significantly impacted by these drugs. While the percentage of CD4+FOXP3+ Tregs within PBMCs was reduced when cultured with ACY-738 or entinostat, this effect was most striking with ricolinostat or ACY-241 treatment (Supplementary Fig. S1C and S1D). Interestingly, the highly selective HDAC6 inhibitors, ACY-775 and tubastatin A, did not significantly impact Treg frequency. This finding suggests that inhibition of class I HDAC and class II HDAC6 by compounds such as ricolinostat and ACY-241 may impact Treg frequency more so than single class-selective agents such as entinostat.
Next, PBMCs from NSCLC patients (Supplementary Table 2) or bulk single cell suspensions from dissociated freshly resected patient lung tumors were cultured with ricolinostat or entinostat for 24 hours. Flow cytometry analysis of leukocyte subsets within the cell cultures revealed that ricolinostat significantly reduced Treg proportions relative to DMSO control or entinostat (Fig. 1A, p=0.04; 1D, p=0.05, Supplementary Fig. S1E), similar to what was observed for healthy donor PBMCs (Supplementary Fig. S1C and S1D). In parallel, expression of the CD69 activation marker was substantially upregulated on conventional CD8+ and CD4+ T cells in both patient (Fig. 1B, p=0.003; 1C, p=0.01) and healthy donor (Supplementary Fig. S2A and S2B) PBMC cultures in the presence of ricolinostat but not entinostat, suggesting that an increased activation profile is promoted by ricolinostat. In addition, we observed substantial increase in phosphorylated STAT3 levels that accompanied increased CD69 expression in T cells within healthy donor PBMCs exposed to ricolinostat (Supplementary Fig. S2C and S2D).
Figure 1. Reduction of CD4+FOXP3+ Treg cells and up-regulation of CD69 on T cells in NSCLC patient PBMC and dissociated tumor cultures in the presence of ricolinostat.
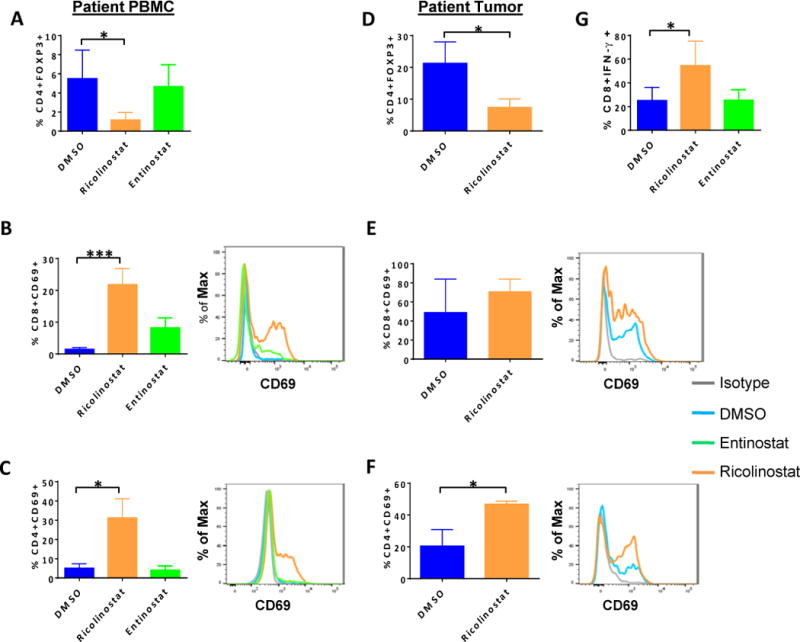
Peripheral blood mononuclear cells (PBMCs) from NSCLC patients (A,-C, G) or dissociated tumors (D-F) were cultured for 24 or 72 hours, respectively with ricolinostat or entinostat after which the frequency and phenotype of T cell subsets were assessed by FACS. DMSO was used as a control. (A, D) Percent of CD4+FOXP3+ Treg cells in (A) PBMCs cultured for 24 hours or (D) tumors of NSCLC patients cultured for 72-hours with 2.5μm of indicated HDAC inhibitors. (B,C,E,F) Summary (left), and representative histograms (right) of expression levels of CD69 on gated (B, E) CD8+ and (C, F) CD4+ T cells within the PBMC and tumor cultures. (G) Patient PBMCs cultured and treated as described above were washed and re-stimulated with PMA+ionomycin in the presence of golgi plug for 6 hours. Percent of IFN-γ positive CD3+CD8+ T cells as assessed by intracellular cytokine staining. Data represent the mean ±SEM of samples analyzed from 5 patients. * indicates p-value ˂ 0.05, ** indicates p-value ˂0.01, *** indicates p-value ˂0.001.
In contrast to patient PBMCs, we found that tumor infiltrating immune cells in the two dimensional (2-D) cultures of NSCLC patient tumors were significantly less viable in the presence of entinostat when compared to ricolinostat (Supplementary Fig. S3), precluding further analysis of entinostat-treated tumor cultures. Although many tumor-infiltrating T cells already exhibited an activated profile based on CD69 positivity ex vivo (data not shown), exposure to ricolinostat led to a modest increase in the frequency of CD69+CD8+ T cells (Fig 1E, p=0.39) and a significant increase in CD69+CD4+ cells (Fig. 1F, p=0.04). This observation suggests that ricolinostat enhanced activation of T cells in a setting where tumor-relevant antigens were likely present. Furthermore, after removal of drugs from primary cultures, CD8+ T cells from patient PBMCs that were re-stimulated in secondary cultures with PMA and ionomycin showed a higher frequency of IFN-γ positivity (Fig. 1G, p=0.05). (Supplementary Fig. S4A–C), indicating enhanced effector cytokine secretion and cytotoxic capability following exposure to ricolinostat.
Ricolinostat promotes increased expression of MHC and co-stimulatory molecules on human monocytes and tumor-associated macrophages
Existing reports demonstrate that HDAC6 inhibition can effect functional changes in APCs through a mechanism that involves regulation of inflammatory cytokine production [42]. We therefore explored whether ricolinostat alters APC phenotype and function. Specifically, we evaluated CD14+CD11b+ monocytes in the peripheral blood of NSCLC patients and CD14-CD45+CD68+CD11b+ macrophages within disaggregated NSCLC tumors. Upon 24-hour culture with ricolinostat, the CD14+ monocyte fraction significantly up-regulated surface expression of MHC class II molecules (p=0.04), as well as CD86 (p=0.01) but not CD80 (data not shown), phenotypic changes that are associated with increased priming ability of APCs [43]. In contrast, entinostat only promoted upregulation of CD86 while not affecting MHC class II expression (Fig. 2A and B). Ricolinostat elicited a similar pattern of increased expression of MHC class II and CD86 on the CD14-CD45+CD68+CD11b+ macrophages within 2-D tumor cultures (Fig. 2C and D) and in PBMCs obtained from healthy donors (Supplementary Fig. S5A and S5B). These findings demonstrate a unique modulatory effect of ricolinostat on human monocytic cells and tumor-infiltrating macrophages, and suggest that ricolinostat promotes phenotypic changes that support enhanced antigen presentation and co-stimulatory capabilities. Consistent with this notion, ricolinostat-exposed CD14+ monocytes were superior at inducing allogeneic T cell proliferative responses in mixed lymphocyte reactions (Fig. 2E).
Figure 2. Increased expression of MHC class II and CD86 on monocytes/macrophages in NSCLC patient PBMC and dissociated tumor cultures in the presence of ricolinostat.
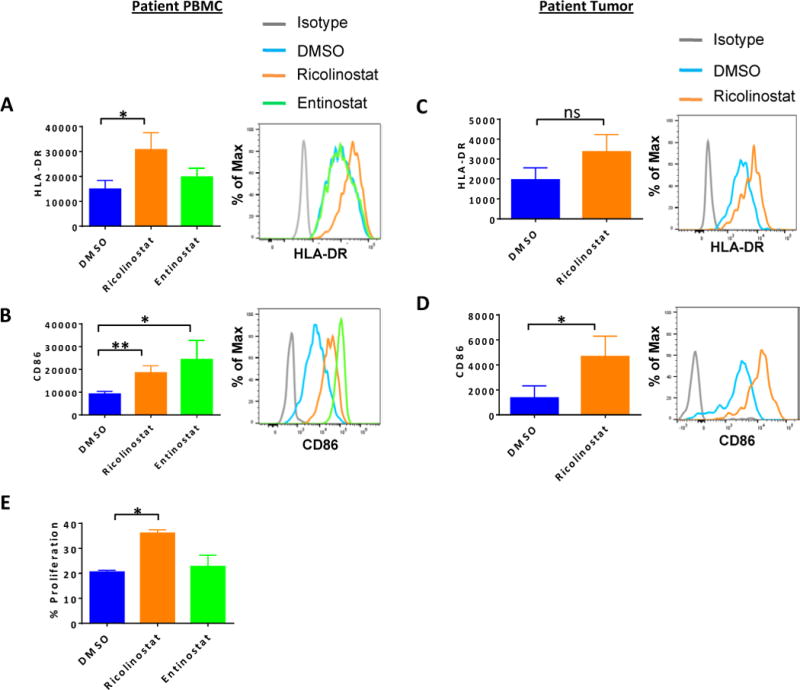
PBMCs from NSCLC patients (A, B) or dissociated tumors (C-D) were cultured for 24 or 72 hours, respectively with ricolinostat or entinostat (2.5μm) after which the phenotype of CD14+CD11b+ monocytes or CD45+CD68+CD11b+ tumor macrophages were assessed by FACS. DMSO was used as a control. Summary (left) or representative histograms (right) for the expression levels of (A, C) HLA-DR and (B, D) co-stimulatory molecule CD86 on gated CD3-CD14+ monocytes from (A, B) PBMCs or (C, D) CD14-CD45+CD68+CD11b+ macrophages in dissociated tumors after culture with indicated HDAC inhibitors. (E) Purified CD14+ cells from patient PBMCs that had been cultured with ricolinostat or entinostat for 24 hours were incubated with cell trace violet (CTV)-labelled purified T cells from allogeneic donor PBMCs for 6 days in the presence of 20 IU/ml of recombinant human IL-2. The percent proliferation by the responder T cells was determined by CTV dilution in response to stimulation by CD14+ cells. Data represent the mean ±SEM of 5 patients (A–D) or 2 independent experiments (E). * indicates p-value ˂ 0.05, ** indicates p-value ˂0.01.
Ricolinostat promotes quantitative and phenotypic changes that facilitate tumor-infiltrating T cell activation and function in a non-small cell lung cancer model
Given the importance of tumor-associated immune cells in shaping the course of tumor progression and anti-tumor immunity, we next investigated whether the phenotypic and functional changes seen in vitro on immune cells upon ricolinostat treatment are recapitulated in vivo, especially in the context of tumor antigens. To address this issue, we examined the effects of ricolinostat on immune cells infiltrating lung adenocarcinomas that spontaneously develop in two fully immunocompetent mouse models: 1) genetically engineered mice (GEM) harboring an activating KrasG12D mutation concurrent with p53 loss (designated KP), or 2) GEM with T790M/L858R EGFR mutations (designated TL), as previously described [44].
Mice with established adenocarcinomas (as confirmed by MRI) were treated once daily with ricolinostat for seven days prior to evaluation of dissociated tumors by comprehensive multi-parametric flow cytometry. Under this short-term treatment, we observed modest increases in the frequency of tumor-infiltrating CD8+ T cells and significant decreases in CD4+Foxp3+ Treg cells among lymphoid cells (Fig. 3A and B), resulting in a significant elevation of CD8:Treg ratios in treated tumors (Fig. 3C). Such increases in CD8:Treg ratio are often associated with enhanced anti-tumor responses [45]. Although there were no substantial phenotypic changes with respect to inhibitory receptor molecule expression (Supplementary Fig. S6A–D), tumor-infiltrating CD8+ T cells in ricolinostat-treated mice exhibited increased expression of the activation marker CD69 (Fig. 3D) and enhanced secretion of the effector cytokine IFN-γ following ex vivo stimulation compared with equivalent cells in the vehicle control group (Fig. 3E).
Figure 3. Ricolinostat promotes phenotypic and functional changes in tumor-infiltrating T cell subsets and macrophages that are consistent with immune activation.
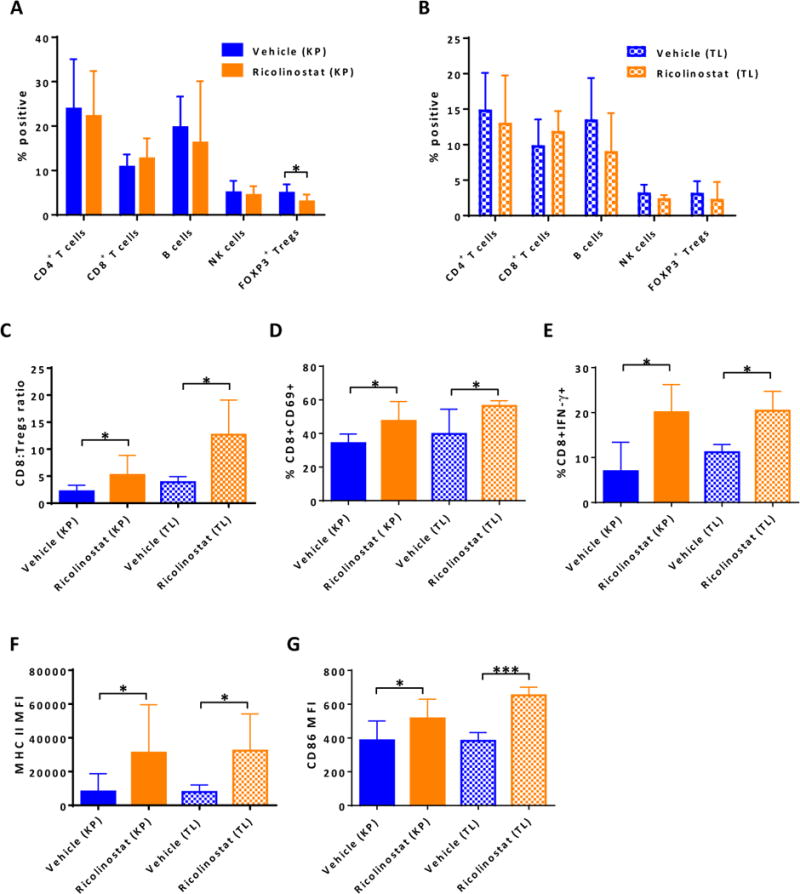
Single cell suspensions of lung tumor nodules of KP and TL mice treated with ricolinostat or vehicle for 7-days were stained and then subjected to FACS analysis to assess proportions, phenotype and function of CD45+ immune cell subsets. The single cell suspensions were also stimulated ex-vivo for intracellular cytokine production by T cells. Proportion of indicated lymphoid cell subsets in (A) KP or (B) TL tumors and (C) ratio of CD8 to CD4+Foxp3+ Treg cells in tumors of KP and TL mice. Proportion of (D) tumor-infiltrating CD8+ T cells expressing CD69 activation marker and (E) producing IFN-γ after ex-vivo stimulation. (F) The expression levels of MHC class II and (G) CD86 co-stimulatory molecules on tumor-associated CD11c+CD11blo macrophages in vehicle and ricolinostat-treated KP and TL mice. Data are mean ±SEM of 5–9 mice per group. * indicates p-value ˂ 0.05, *** indicates p-value ˂0.001.
Consistent with this finding, single cell RNA-sequencing (RNA-seq) revealed that a number of genes associated with T cell activation and TCR signaling including Cd69, Cd44, Cd247, and Zap70 were up-regulated in tumor-infiltrating T cells from KP mice treated with ricolinostat when compared to equivalent cells derived from the tumors of the vehicle group (Supplementary Fig. S7). Among myeloid cell populations, the proportions of CD11c+CD11blo tumor-associated macrophages (TAMs; Supplementary Fig. 8A) were comparable between the treatment group and vehicle controls (data not shown). However, under this short-term ricolinostat treatment, TAMs exhibited significantly elevated expression of MHC class II as well as co-stimulatory molecule CD86 (Fig. 3F and G, Supplementary Fig. S8B). Consistent with this phenotype, ricolinostat-exposed TAMs analyzed by single cell RNA-seq showed higher expression of key genes associated with MHC class II expression including Cd74 and H2-Aa relative to their counterparts in the control mice (Supplementary Fig. S8C).
As increase in acetylation of tubulin is considered to be one measure of pharmacologic inhibition of HDAC6 [42, 46, 47], we observed that ricolinostat treatment led to increased levels of acetyl α-tubulin (lysine 40) in the tumor (supplementary Fig. S9), providing supporting evidence that changes occurring consequent to ricolinostat treatment stem from drug activity in tumor-associated immune cells.
Collectively, these findings from in vivo treatment of tumor-bearing mice are consistent with our in vitro observations in PBMCs, and indicate that upon ricolinostat treatment, tumor-infiltrating macrophages underwent changes analogous to more mature APC phenotype that supports a more activated, effector profile of surrounding T cells.
BET bromodomain inhibitor JQ1 disrupts Treg signature protein expression and attenuates suppressive function
Based on the positive immuno-dynamic and phenotypic changes mediated by ricolinostat in immune cell subsets, we reasoned that these effects should translate to augmented anti-tumor immune response. In initial efficacy studies, we found that ricolinostat treatment in immunocompetent KP mice provided only marginal therapeutic benefit; that is, minimal inhibition of tumor growth was observed relative to vehicle-treated controls (Supplementary Fig. 10). In an attempt to identify a partner agent to augment anti-tumor effect, we focused on JQ1, an inhibitor of the BET family of bromodomain proteins. Our choice of JQ1 was based on our hypothesis that, due to its indirect regulation of epigenetic “reader” proteins, which are key to immune cell biology, JQ1 should also potentiate immunomodulatory effects in the tumor microenvironment [48–50]. To this end, we treated KP mice with JQ1 in order to determine whether it promotes changes in tumor-associated immune cells that are beneficial for tumor immunity. Analysis of lung tumor-infiltrated T cells revealed that CD4+Foxp3+ Tregs showed significant downregulation of Foxp3, CTLA-4, and PD-1 upon JQ1 treatment, whereas, little phenotypic changes were observed in the conventional T cell subsets (Fig. 4A and B, Supplementary Fig. S11A, and S11B). In addition, phospho-STAT5, a bromodomain-dependent target gene [51–53]. was downregulated in tumors of JQ1-treated mice, specifically in Tregs, supporting the notion that JQ1 activity is dominant in Tregs relative to conventional T cells (Supplementary Fig. S12A–D).
Figure 4. BET bromodomain inhibitor JQ1 disrupts signature protein expression and attenuates suppressive function of Tregs within lung tumors of treated mice.
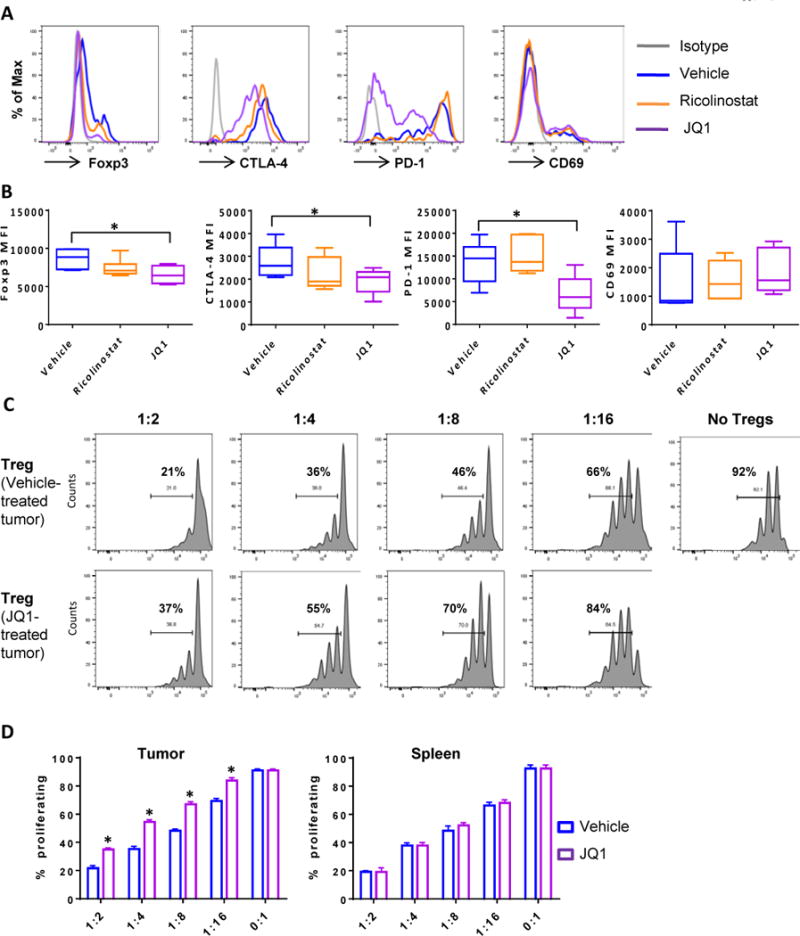
Single cell suspensions generated from lung tumor nodules excised from KP mice treated with JQ1 or ricolinostat for 1 week were subjected to FACS analysis. Mice that received vehicle served as controls. (A) Representative histograms and (B) Summary of expression levels of Foxp3, CTLA-4, PD-1, and CD69 on tumor-infiltrating CD4+Foxp3+ Treg cells. CD4+CD25hi Treg cells sorted from the tumors of vehicle or JQ1-treated KP mice were co-cultured with CFSE-labeled CD4+CD25- T cells isolated from the spleen of the same mouse. Cells were stimulated with ɑ-CD3 in the presence of T-depleted splenocytes as APCs for 3 days. (C) Representative CFSE profiles of proliferating T cells and (D) Summary of percent of cells proliferating in the presence of tumor (left) or splenic (right) Tregs at indicated Treg: T cell ratios. Data in (B) and (D) are mean ±SEM of 5–6 mice per group. * indicates p-value ˂ 0.05.
Furthermore, the phenotypic changes in Tregs noted above was accompanied by decreased suppressive function as Tregs isolated from the tumors of JQ1-treated mice were less efficient at inhibiting the proliferation of responding effector T cells when compared to their counterparts in vehicle-treated mice (Fig. 4C and D). In contrast, Tregs isolated from the spleens of these tumor-bearing mice were comparable in their inhibitory function (Supplementary Fig. S13) demonstrating that tumor-Tregs were more susceptible to JQ1 effect, possibly due to their unique and heightened expression of PD-1, CTLA-4, and CD69 (Supplementary Fig. S14A and S14B). Consistent with these findings in the GEM, FOXP3+ Tregs present within dissociated tumors from NSCLC patients cultured with JQ1 showed diminished expression levels of FOXP3, CTLA-4, and PD-1 relative to those cultured in the presence of ricolinostat or control DMSO (Supplementary Fig. S15). In summary, these results indicate that JQ1 preferentially modulates Treg phenotype and function in tumor-infiltrating immune cells.
BET bromodomain inhibitor JQ1 synergizes with ricolinostat to enhance immune-dependent suppression of tumor growth
A recent report by Mazur and colleagues showed that JQ1 has an anti-tumor effect in KP mice in part due to downregulation of MYC and induction of apoptosis in tumor cells [36]. The preceding data also demonstrate that JQ1 exhibits a unique effect on tumor-associated Tregs. We therefore hypothesized that these tumor and immune cell-specific JQ1 effects, when combined with the immunomodulatory effects of ricolinostat, should foster a tumor immune microenvironment that favors stronger stimulation of tumor infiltrating T cells and an augmented anti-tumor response. Thus, mice with lung adenocarcinomas were treated with ricolinostat and/or JQ1 in long-term efficacy studies (Supplementary Fig. S16). Immunocompetent GEM with established tumors (150–250mm3) were administered a daily dose of ricolinostat and/or JQ1, and tumor growth kinetics evaluated. In KP mice, ricolinostat or JQ1 monotherapy led to minimal or moderate delay in tumor growth, respectively, but combination treatment with both agents resulted in significant arrest of tumor growth (Fig. 5A–C). In alignment with these outcomes, vehicle-treated mice harbored large tumors with high grade adenocarcinomas, while single and combination therapy tumors were mostly low grade adenocarcinomas often exhibiting the lowest histopathology grade and increased cellular infiltrates (Supplementary Fig. S17A). Additionally, tumors in the treatment groups particularly the combination, displayed reduced Ki67 and elevated cleaved Caspase-3 expression, signaling reduced proliferation and increased cell death, respectively (Supplementary Fig. S17B and S17C).
Figure 5. JQ1 synergizes with ricolinostat to promote anti-tumor immunity.
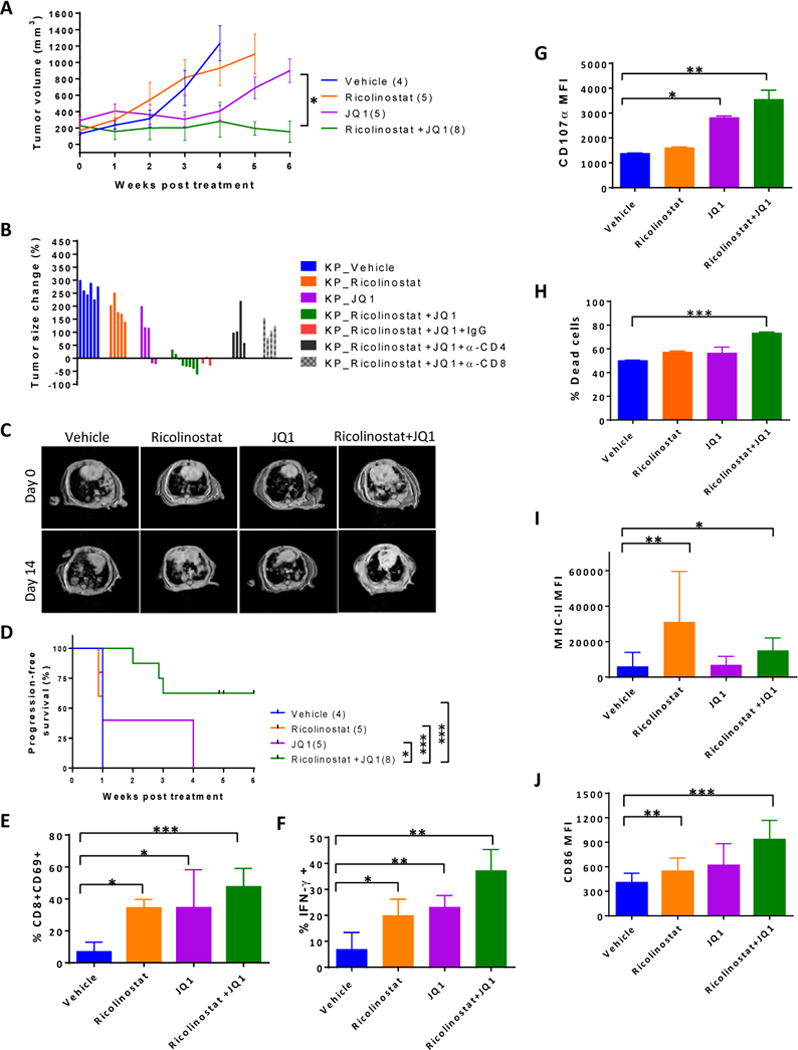
KP mice with tumor burdens of approximately 200–400 mm3 were injected I.P. once daily with ricolinostat alone, JQ1 alone, or the combination of the two drugs for 5–6 weeks with or without depleting antibodies against CD4 or CD8. Tumor growth was monitored weekly by MRI. (A) Tumor growth kinetics (B) Change in tumor size after 2 weeks of treatment with indicated drugs and antibodies. (C) Representative tumor MRI of mice treated with single agents or combination as indicated. (D) Progression-free survival of KP mice in each treatment condition. For immune profiling, cohorts of KP mice were euthanized after 4–6 weeks of treatment and tumor cell suspensions were subjected to FACS analysis. (E) Percent of CD8+ T cells that expressed CD69 within tumor-infiltrating CD45+ leukocytes. (F) Immune cells isolated from tumors of mice treated with indicated drugs were stimulated ex-vivo for 6 hours in the presence of golgi plug. Percent of CD8+ T cells within tumor-infiltrating leukocytes that secreted IFN-γ or (G) expressed CD107ɑ based on mean fluorescent intensity. (H) CD25-CD3+ T cells, CD45-Epcam+ tumor cells, and CD11bloCD11c+ TAMs were sorted from tumors of treated mice and equivalent numbers of each population were co-cultured for 2 d in the presence of tumor cell lysates. Graph represents percent of dead Epcam+ tumor cells as determined by populations that stained positive for viability dye. (I) Summary of expression levels of MHC class II and (J) CD86 on TAMs in the tumors of treated mice. Control mice received vehicle and Rat IgG isotype in the depletion studies. Data are mean ±SEM of 6–8 mice per group. * indicates p-value ˂ 0.05, ** indicates p-value ˂0.01, *** indicates p-value ˂0.001.
These anti-tumor effects were largely dependent on CD8+ and CD4+ T cells, because tumor growth arrest was abrogated upon incorporation of CD8- or CD4-depleting antibodies in the combination treatment regimen (Fig. 5B). Furthermore, combination therapy led to longer progression-free survival compared to either agent alone (Fig. 5D), suggesting that JQ1 synergizes with ricolinostat to drive T cell-mediated anti-tumor response. Similar to KP mice, the combination was also efficacious in mice bearing mutant EGFR (TL) lung tumors, as well as Lewis lung carcinomas, as evidenced by marked inhibition of tumor growth in each of these models (Supplementary Fig. S18A and S18B). These data suggest that the therapeutic benefits of this combinatorial approach extend beyond lung adenocarcinomas driven by ectopic expression of driver mutations to those arising by spontaneous development.
Immune profiling of tumor nodules further revealed that, relative to the single agent treatments, tumor-infiltrating CD8+ T cells were more activated, as evidenced by increased expression of CD69 (Fig. 5E). In addition, these tumor-infiltrating CD8+ T cells demonstrated significantly enhanced secretion of effector cytokine IFN-γ (Fig. 5F) as well as increased degranulation as indicated by CD107ɑ staining (Fig. 5G).
Furthermore, when equivalent numbers of T cells, TAMs, and Epcam+ tumor cells sorted from tumor nodules of ricolinostat and/or JQ1-treated mice were co-cultured together with tumor cell lysate, we found a higher proportion of tumor cell death in the presence of T cells isolated from the tumors of dual agent-treated mice (Fig. 5H). Thus, combination treatment enhanced the tumor killing potential of tumor infiltrating T cells. With respect to the TAMs, ricolinostat treatment, either alone or in combination with JQ1, markedly promoted upregulation of MHC class II molecules and CD86 (Fig. 5I and J).
Ricolinostat and JQ1 treatment promote quantitative changes in tumor-infiltrating immune cell subsets that signal a re-shaping of tumor-immune cell dynamics
Although we detected very little change in the proportions and phenotypes of T cells under acute (7 days) drug treatments with the exception of Tregs (Fig. 3A–C, Supplementary Fig. S6), we wondered whether the immune cell dynamics change over time especially upon long-term treatment where we observed change in tumor size after prolonged drug exposure. While the proportion of conventional T cells did not change dramatically within the tumors across treatment groups (Fig. 6A), tumors of KP mice treated with JQ1 alone or in combination with ricolinostat exhibited substantially reduced Treg numbers, yielding significantly increased CD8:Treg ratios, an effect that was not evident in peripheral Treg cells (Fig. 6A, B, Supplementary Fig. S19A and S19C). In contrast, CD11c+ TAMs increased with more pronounced clusters of these cells within the tumors of mice treated with JQ1 and/or ricolinostat (Fig. 6C, Supplementary SFig. 19B), demonstrating peripheral reshaping of immune cell dynamics within the tumor in the presence of these drugs. While their frequencies did not differ dramatically, tumor-infiltrating T cells, particularly CD8+ cells, in JQ1- and JQ1/ricolinostat-treated mice exhibited significantly reduced expression levels of the immune checkpoint receptors PD-1, CTLA-4, TIM-3, and BTLA relative to the vehicle- and ricolinostat-treated groups (Supplementary Fig. S20A–D), indicating a correlation between the expression levels of inhibitory proteins on these T cells and the outcome of tumor growth kinetics.
Figure 6. Dynamics of immune cells infiltrating the tumors of ricolinostat and/or JQ1-treated KP mice.
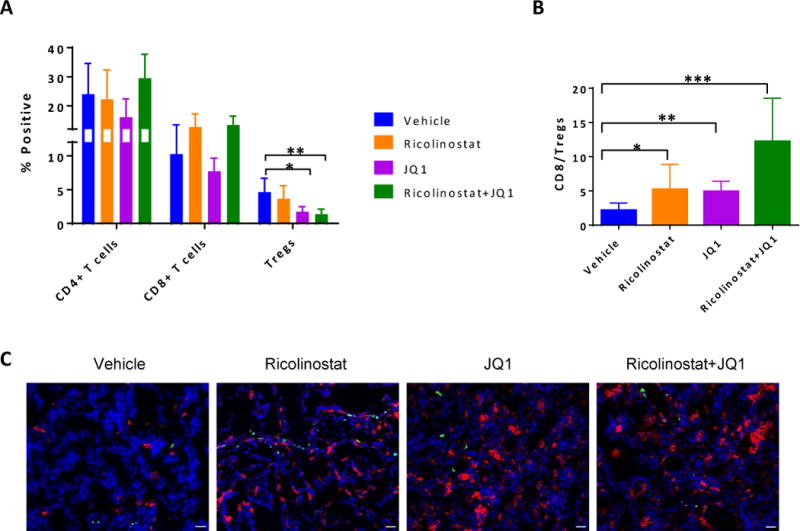
Cell suspensions generated from tumor nodules of KP mice that were treated with vehicle, ricolinostat or JQ1 for 5–6 weeks were subjected to FACS analysis to assess proportions of CD45+ T lymphocyte subsets. (A) Proportion of CD4+, CD8+ conventional T cells, or CD4+Foxp3+ Tregs and (B) ratio of CD8 to CD4+Foxp3+ Treg cells within the tumors. Frozen sections of fresh tumor nodules from these treated KP mice were stained for TAMs (CD11c+; red) and T cells (CD3+; green), and counter stained with DAPI (nuclei; blue). (C) Representative immunofluorescent staining of tumor sections from mice treated as indicated. Images were captured on a Nikon Eclipse 80i fluorescence microscope equipped with CoolSNAP CCD camera and merged images created with NIS elements imaging software. Scale bar; 25μm.
*indicates p-value ˂ 0.05, **indicates p-value ˂0.01, ***indicates p-value ˂0.001.
Next, we wondered whether despite the lack of substantial changes in immune cell dynamics under acute drug exposure, other changes were already being imprinted in tumor-immune cell populations. In this regard, we performed gene expression profiling to address this issue and as an approach to elucidate the mechanistic underpinnings for each drug as a sole agent. Our results revealed that TAMs sorted from the tumors of ricolinostat-treated mice, but not JQ1-treated mice, show increased gene transcripts for the MHC class II transactivator Ciita and MHC class II H2-DMb relative to vehicle controls (Supplementary Fig. S21A and S21B). On the other hand, JQ1 but not ricolinostat treatment remarkably led to downregulation of Treg-associated genes and/or genes encoding inhibitory co-receptors including Foxp3, Ctla4, Cd25, Ccr4, Pdcd1, and Btla in sorted tumor T cells (Supplementary Fig. S22A and S22B). This effect is not due to a reduction in Treg numbers within the analyzed T cell samples as these were comparable between ricolinostat and JQ1 treatments, and only slightly lower than the vehicle group (Supplementary Fig. S23). Interestingly, this gene expression pattern was largely absent in ricolinostat-exposed tumor T cells, which displayed a distinct profile with minimal changes in the gene transcripts for the above-mentioned inhibitory receptors (Supplementary Fig. S22A and S22B).
Taken together, these findings demonstrate that selective inhibition of HDAC6 by ricolinostat and bromodomain inhibition by JQ1 evoke distinct gene transcriptional landscape that yield striking immunomodulatory features which, when combined, synergizes to potentiate robust immune-mediated anti-tumor response in our described NSCLC models.
Discussion
The utility of HDAC inhibitors as anti-cancer agents is gaining traction in oncology in part due to reported cytostatic effects on tumor cells [54]. However, their effects on immune cells recruited to tumors are still not well understood. Such knowledge is critical as cross-talk between immune cells and cancer cells shapes the course of tumor progression. While pan-HDAC inhibitors are currently being evaluated as therapeutic options for a number of cancers, isozyme-selective HDAC inhibitors may possess unique properties. Indeed, we observed that ricolinostat, which is highly selective for HDAC6 but retains some inhibitory activities on class I HDACs as well, has striking immuno-modulatory effects. In the present study, we characterized the effects of ricolinostat on immune cells and evaluated the therapeutic potential of combining this HDAC inhibitor with an inhibitor of BET bromodomain proteins in models of NSCLC.
The increased expression of MHC class II and co-stimulatory molecule CD86 that we observed on tumor-associated macrophages (TAMs) upon ricolinostat treatment in lung tumor-bearing mice indicates that ricolinostat possesses immunomodulatory properties that promote phenotypic changes favoring improved delivery of co-stimulatory signals and antigen presentation. Furthermore, the observed increase in CD69 expression on ricolinostat-exposed T cells also suggests that it may facilitate cellular events that lead to T cell activation. Such activating effect may be beneficial for amplification of T cell receptor (TCR)-induced antigen-driven T cell priming, especially in the context of tumor-associated antigens. While they did not focus on T cells, Sotomayor and colleagues also reported that HDAC6 inhibition improved APC function in a manner involving the regulation of STAT3/IL-10 tolerogenic axis in APCs [42], raising the possibility that selective HDAC6 inhibition may differentially regulate activation and function in multiple cell types.
Our results suggest that ricolinostat has the potential to facilitate T cell priming in cancer patients. This notion is supported by the increased activation and enhanced effector function of tumor-infiltrating CD8+ T cells observed in tumor-bearing mice treated with ricolinostat. Although ricolinostat treatment alone did not robustly dampen tumor growth in our NSCLC models, it substantially increased T cell mediated anti-tumor efficacy when coupled with JQ1. Thus, the enhancement of the therapeutic activity of ricolinostat by JQ1 cotreatment suggests that promoting antigen presentation and co-stimulation alone is not sufficient to achieve sustained anti-tumor responses. Rather a significant reduction in inhibitory cellular mechanisms operative within the tumor bed as achieved by JQ1 therapy is fundamental to augmenting the therapeutic benefit of ricolinostat treatment. Nevertheless, the enhanced APC function conferred by ricolinostat warrants further exploration, as does its application in NSCLC treatment in tandem with vaccination strategies.
Given that CD4+FOXP3+ T regulatory cells accumulate in many solid cancers [55], agents that target these cells may offer therapeutic benefits. In this regard, we found that JQ1, more than ricolinostat treatment, led to substantial reduction in tumor-infiltrating Treg fractions evidenced by reduced Foxp3 expression level, as well as reduced Treg function. These findings suggest that Treg cells may be more susceptible to epigenetic modifications by bromodomain proteins than their conventional T cell counterparts. Given that FOXP3, CTLA-4, and PD-1 are critical for Treg stability and/or function [56–58], their diminished expression or transcriptional repression may compromise tumor-Treg survival and suppressive function as we observed in lung tumor-bearing, JQ1-treated mice. Although existing reports demonstrate that certain HDAC inhibitors affect Treg biology [35, 59, 60], and ricolinostat clearly evoked deleterious effects on patient tumor-Tregs in vitro, the more profound anti-Treg effect in our in vivo lung tumor model is attributed to JQ1.
Our gene expression profiling provides a snapshot of potential mechanisms of action by these drugs in our NSCLC investigational model: ricolinostat promoted increased transcription of genes that are key components of MHC class II expression in tumor macrophages, molecular changes that support improved antigen presentation and T cell priming [61]. On the other hand, bromodomain inhibition by JQ1 remarkably led to a decrease in transcription of gene signature associated with Treg maintenance/function which significantly overlap with those associated with immune checkpoint co-receptors [62–64]. We postulate that ricolinostat plays a pleiotropic role on immune cells and functions by increasing activation of T cells and promoting APC function while JQ1 contributes to reduction of Treg proportions in addition to disrupting the suppressive function of residual Tregs present in the tumor bed. The net effect is promotion of leukocyte-orchestrated anti-tumor response by way of optimizing antigen delivery, increasing co-stimulatory signals, and lowering inhibitory cellular mechanisms (Fig. 7).
Figure 7. Proposed mechanism of action of ricolinostat and JQ1 in GEMM of NSCLC.
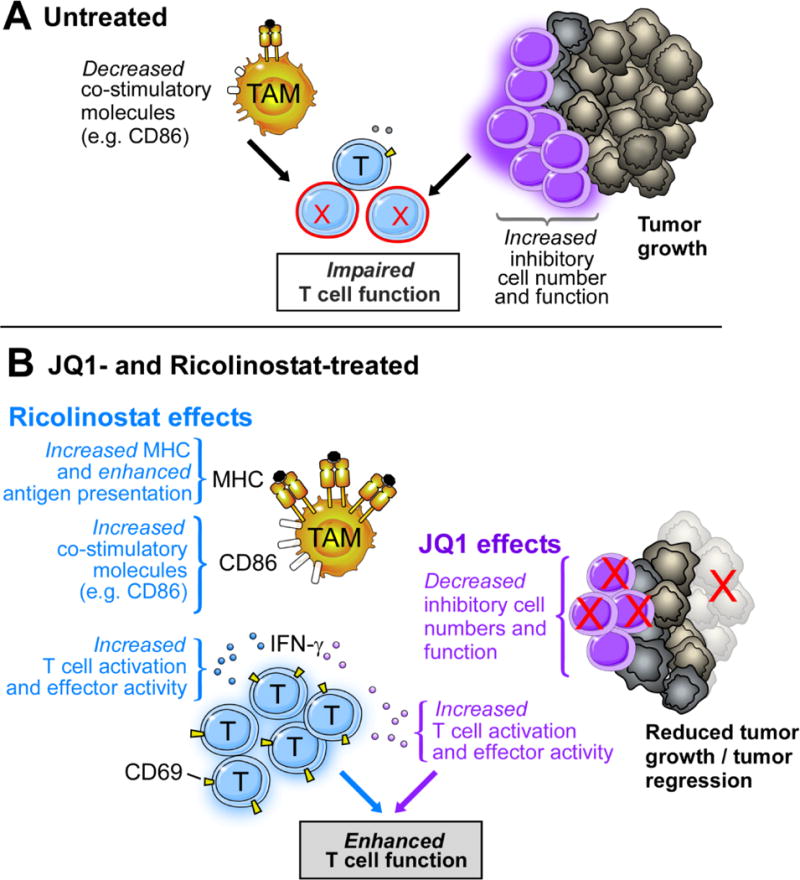
In treatment-naive lung tumors that develop in GEMM of NSCLC, inhibitory cellular mechanisms such as Tregs outweigh (co)-stimulatory signals resulting in impaired T cell function. Ricolinostat promoted increased MHC and co-stimulatory molecules which favors enhanced antigen presentation while JQ1 led to a reduction in Treg cell numbers and function, effects that facilitate T cell activation and function. The net result is a co-operative immunotherapeutic effect orchestrated by both agents to favor enhanced T cell function, promoting robust anti-tumor immunity.
As the race continues towards finding effective therapeutic modalities for solid cancers, such as NSCLC, our findings show that the combination of ricolinostat and JQ1 lead to robust immune-mediated anti-tumor effects in lung tumors driven by different mutation genotypes, which is timely and important. This crucial contribution by the immune cells, particularly T cells, is underscored by the abrogation of tumor growth arrest seen under ricolinostat and JQ1 therapy upon T cell depletion. In a nutshell, our findings highlight previously unknown immunomodulatory effects of these two classes of drugs in combination and support their therapeutic testing in lung adenocarcinoma. While not the focus of this study, both agents have direct anti-tumor effects [36, 41, 48, 65]. This raises the exciting possibility that ricolinostat and JQ1 could be utilized in combination as “hybrid” therapies that harness not just direct anti-tumor effects, but also indirect effects via peripheral reshaping of immune cell dynamics and function, converging to foster strong anti-cancer benefits. With JQ1 currently being evaluated in clinical trials for solid cancers, and ricolinostat, which has a good safety profile presently in clinical development, both drugs are promising therapeutic agents that could be combined as epigenetics-based immunotherapeutics for the treatment of lung adenocarcinomas.
Online Methods
Mice
Genetically engineered mice harboring Kras+/LSL-G12DTrp53L/L (KP) or EGFRLSL-T790M/L858R (TL) have been previously described [44]. For lung tumor induction, mice received 1 × 10⁶ CFU Cre-encoding adenovirus intranasally at 5–6 weeks of age. Tumor formation (typically 6–8 weeks post-inoculation) and volume were confirmed by MRI and quantified using 3D Slicer software. C57BL/6 mice were purchased from Jackson Laboratory (Bar Harbor, ME). All mice were maintained under pathogen-free conditions in accordance with institutional guidelines for animal welfare and experiments involving human tissues were conducted under approved, Dana-Farber/Harvard Cancer Center (DF/HCC) IRB protocol 02-180 with informed consent by patients.
Drugs and reagents
Ricolinostat (ACY-1215), ACY-241, ACY-738, and ACY-775 were provided by Acetylon Pharmaceuticals (Boston, MA). Tubastatin was obtained from ApexBio Technology (Houston, TX) and Entinostat was obtained from selleckchem (Houston, TX). Ricolinostat was formulated in 10% DMSO in 5% dextrose and intraperitoneally administrated to mice at 50 mg/kg daily. JQ1, kindly provided by James Bradner (Dana Farber Cancer Institute, Boston, MA), was formulated in 10% DMSO in 10% 2-hydroxylpropyl β-cyclodextrin (Sigma-Aldrich, Saint Louis, MO) and intraperitoneally administrated to mice at 25 mg/kg daily. Each drug’s vehicle control represents DMSO diluted into the vehicle agent. Recombinant human cytokines IL-2, IL-4, and GM-CSF were purchased from Peprotech (Rocky Hill, NJ).
Antibodies
In vivo antibodies anti-CD4 (GK1.5), anti-CD8 (53-6.72), and rat IgG (LTF-2) were purchased from Bio X Cell (Lebanon, NH). Mice were first administered two consecutive doses (400 μg/mouse) of antibodies at day −2 and day −1 and twice per week thereafter along with ricolinostat and JQ1 combination treatment. Antibodies utilized for flow cytometric analyses are listed in supplementary information.
Tumor profiling and flow cytometry
To generate cell suspensions, tumor nodules were excised from lungs of KP and TL mice, cut into small pieces, and further dissociated in RPMI-1640 buffer containing 5% FBS, 100 IU/ml collagenase type IV (Invitrogen, Carlsbad, CA), and 50 μg/ml DNAse I (Roche, Basel, Switzerland) for 45 min at 37°C. After incubation, cells were treated with red blood cell lysis buffer and filtered through a 70 μm cell strainer. After centrifugation, cell pellets were resuspended in 1X PBS/2% FBS. About 0.5–1 × 10⁶ cells were stained for surface markers in 1X PBS/2% FBS for 15 min at 4°C. Intracellular staining was performed for Foxp3 using the Foxp3 staining kit (ebioscience, Santa Clara, CA) according to manufacturer’s instructions. The Cytofix/Cytoperm kit (BD Biosciences, San Jose, CA) was used for intracellular cytokine staining. Briefly, fixed and permeabilized cells were stained for surface markers, including CD4, CD8, and CD3, followed by intracellular staining with PE-conjugated anti-IFN-γ, or isotype-matched mAbs. In all stained samples, dead cells were excluded using Live/Dead Fixable Dead Cell staining kit (Invitrogen, Carlsbad, CA). Cells were acquired on the LSR Fortessa (BD Biosciences) and analyzed with FlowJo software (Treestar). Gating strategy for FACS analyses are shown in Supplementary Figure 24.
Cell purifications and in vitro studies
PBMCs were isolated by Ficoll gradient from fresh or frozen blood samples obtained from healthy donors and patients. All subjects provided consent and all procedures were followed under IRB-approved institutional protocols. When frozen, PBMCs were thawed and rested in 10% complete medium (RPMI-1640 supplemented with 10% pooled human serum, 100 μg/ml penicillin, 100 μg/ml streptomycin, and 2 mM L-glutamine) at 37ºC for 6 h, after which cells (0.5 × 10⁶) were cultured with DMSO as a control, or 2.5 μM of individual HDAC inhibitors (ricolinostat, ACY-241, ACY-738, ACY-775, tubatstain, and entinostat) as indicated for 24 h. For tumor cell cultures, freshly resected tumors from consented NSCLC patients were dissociated into single cell suspensions and cultured similarly for 72 h in culture media supplemented with 20 IU/ml of IL-2 and 20 ng/ml of GM-CSF. Cells were then washed and subjected to phenotypic analysis by FACS. In some experiments, cultures were maintained in 100IU/ml of IL-2 for 48 hours prior to analysis of Treg populations.
For human proliferation assays, T cells were isolated from PBMCs by positive selection using a T cell enrichment kit (Miltenyi Biotec, Bergisch Gladbach, Germany) per manufacturer’s instructions. Purified T cells (typically ~90% pure) were then labeled with 2.5 μM carboxyfluorescein succinimidyl ester (CFSE) or cell trace violet (CTV) (Life Technologies, Carlsbad, CA at 37°C for 7 min. Cells were washed thrice with RPMI + 10% FBS, counted, and used as responder cells. Purified CD14+ cells isolated from patient PBMCs by positive selection using CD14 microbeads (Miltenyi Biotec, Bergisch Gladbach, Germany) were cultured with ricolinostat or entinostat for 24 h, after which cells were washed thrice before co-culture with allogeneic T cells in mixed lymphocyte reactions.
For mouse Treg suppression assays, CD4+CD25hi Tregs were sorted from spleen or tumor cell suspensions and cultured at graded numbers with Carboxyfluorescein diacetate succinimidyl ester (CFSE)-labelled CD4+CD25- cells (0.5×10⁵) isolated from the spleen of the same mouse. T cell-depleted, mitomycin C-treated splenocytes (0.25×10⁵) were added as APCs and cultures were stimulated with soluble ɑ-CD3 (clone 2C11, ebioscience) at 0.5μg/ml concentration for 3 days.
For intracellular cytokine detection assays, immune cells from tumors of treated or control mice were obtained after Ficoll gradient separation as previously described [66]. Cells (1 × 10⁶) were cultured with PMA (50 ng) and ionomycin (500 ng) for 6 h at 37°C. GolgiPlug (BD Pharmingen) and FITC-conjugated CD107ɑ (Biolegend, San Diego, CA), were added for the last 5 h of culture. For equivalent assays utilizing human PBMCs, 0.5 × 10⁶ cells were similarly stimulated before analysis.
Immunohistochemistry
Tumors were extracted from lungs of tumor-bearing mice and fixed in 10% formalin overnight after which they were embedded in paraffin and sectioned at the Specialized Histopathology core at Harvard Medical School. Prior to immunohistochemical staining, tumor sections were washed twice with Histo-Clear II (National Diagnostics), followed by two washes with 100% ethanol, and subsequent hydration with washes of 90%, 80%, 70%, and 50% ethanol. Tumor sections were heated in 10mM sodium citrate buffer (pH 6.0) for antigen unmasking. After cooling, sections were washed in de-ionized water, then incubated in 3% Hydrogen peroxide for 10 minutes at room temperature followed by washes in de-ionized water and 1X PBS. For antigen blocking, sections were incubated in PBS buffer containing 0.5% Tween, 1% BSA plus 5% serum for 1 hour at room temperature. Sections were then stained in block buffer containing primary antibodies: anti-alpha tubulin (acetyl K40), clone EPR16772 at 1;100 (abcam, Cambridge, MA); or Phospho-STAT5 alpha (Tyr694) at 1:200 (Invitrogen, Rockford, Illinois) overnight in a wet chamber at 4°C in the dark. The following day, sections were washed three times in 1X PBS and then stained with secondary biotinylated antibody in PBS blocking buffer for 1 hour at room temperature. Sections were washed three times with 1X PBS and Elite Vectastain ABC Kit (Vector Laboratories) was applied for 30 minutes following the manufacturer’s instructions at room temperature in the dark. Sections were washed with 1X PBS, developed with DAB reagent (Peroxidase Substrate Kit, Vector Laboratories), and counterstained with hematoxylin. Sections were then washed twice with de-ionized water followed by one wash with 1X PBS, and additional washes of increasing ethanol concentration for dehydration followed by incubation in Histo-Clear II. Slides were mounted with VectaMount Permanent Mounting Medium (Vector Laboratories) and covered with glass coverslips (Denville Scientific). After 24 hours, sections were viewed with an Olympus BX43 Trinocular Microscope. For all IHC quantitations, ten randomly selected fields from at least 4 different tumors in each treatment group were used to quantitate the percent of tissue positive for each marker using ImageJ software. Images were converted to a greyscale red-green-blue (RGB) stack. Positive stain in the greyscale image was quantified at the appropriate threshold as %total image area positive for stain. Quantitation as percent of total tissue is shown where indicated.
Immunofluorescence
Tumors were excised from lungs of tumor-bearing mice, embedded in and immediately snap-frozen in O.C.T. compound (Fisher Healthcare). Frozen fresh tissues were cryosectioned at the Specialized Histopathology core at Harvard Medical School. Sections were fixed for 10 minutes in pre-cooled (−20°C) acetone, washed three times in ice cold 1X PBS, and blocked in 1X PBS with 10% BSA for 1 hour at room temperature. Sections were then stained with fluorochrome-conjugated antibodies: anti-mouse CD3 Alexa Fluor® 488, clone 17A2 at 1:200, anti-mouse CD11c Alexa Fluor® 594, clone N418 at 1:100, (BioLegend, San Diego, CA) overnight in a wet chamber at 4°C in the dark. Sections were subsequently washed three times in ice cold 1X PBS and counter stained with DAPI (FluorPure™ Grade, Life Technologies) at 0.5ug/ml for 7 minutes. Following this, sections were further washed thrice with 1X PBS and mounted with ProlongGold mounting media and coverslips (Corning) and allowed to cure for 24 hr at room temperature in the dark. Sections were imaged using a Nikon Eclipse 80i fluorescence microscope equipped with CoolSNAP CCD camera (Roper Scientific). NIS elements Imaging software was used to create merged images.
Single cell RNA sequencing of tumor-infiltrating TAMs and T cells
Tumor-associated macrophages (TAMs; CD45+CD11c+CD11blo) and CD45+CD3+CD25lo/− T cells were sorted into 96-well plates containing 50 μl of 1X PBS with recombinant ribonuclease inhibitor (Life Technologies, Carlsbad, CA). Briefly, tumor cell suspensions were incubated with live/dead fixable dye after FcγR blocking and subsequently stained with antibodies against CD45, CD3, CD8, CD11b, and CD11c. The SmartSeq2 libraries were prepared according to the SmartSeq2 protocol [67, 68] with some modifications [69], the details of which are provided in Supplementary information. Correlation between expression levels for genes of interest highlighted in this study is shown in Supplementary Figure 25.
Statistical analysis
Statistical significance was evaluated by Student’s t-test for comparisons between two groups (DMSO/vehicle versus depicted drug) or one-way ANOVA for multi-group comparisons using GraphPad Prism software (La Jolla, CA). P < 0.05 was considered statistically significant (*); P < 0.01 was considered very significant (**); and P < 0.001 was considered highly significant (***).
Supplementary Material
Statement of Significance.
Selective inhibition of histone deacetylases and bromodomain proteins modulates tumor-associated immune cells in a manner that favor improved T cell function and reduced inhibitory cellular mechanisms. These effects facilitated robust anti-tumor responses in tumor-bearing mice demonstrating the therapeutic potential of combining these epigenetic modulators for the treatment of NSCLC.
Acknowledgments
We thank Glenn Dranoff for critical reading of the manuscript, Elena Ivanova for technical assistance with immunofluorescence. The data presented in this paper are tabulated in the main paper and in the Supplementary materials. This work was supported by the National Cancer Institute R01 CA195740, CA163896, CA166480, CA122794, and CA140594 to K.K. Wong, CA205150 to P.S. Hammerman, 5RO1CA183560 to J. Ritz, the Thoracic Foundation (K.K. Wong), the Gross-Loh Family Fund for Lung Cancer Research and Susan Spooner Family Lung Cancer Research Fund at Dana-Farber Cancer Institute (K.K. Wong), and research funding from Acetylon Pharmaceuticals.
Footnotes
Conflict of interest disclosure: SSJ and SNQ are both employees and shareholders of Acetylon Pharmaceuticals. All other authors have no competing financial interests.
Supplementary Information are available in the online version of the paper
References and Notes
- 1.Adam JK, Odhav B, Bhoola KD. Immune responses in cancer. Pharmacol Ther. 2003;99(1):113–32. doi: 10.1016/s0163-7258(03)00056-1. [DOI] [PubMed] [Google Scholar]
- 2.Domagala-Kulawik J. The role of the immune system in non-small cell lung carcinoma and potential for therapeutic intervention. Transl Lung Cancer Res. 2015;4(2):177–90. doi: 10.3978/j.issn.2218-6751.2015.01.11. [DOI] [PMC free article] [PubMed] [Google Scholar]
- 3.Quail DF, Joyce JA. Microenvironmental regulation of tumor progression and metastasis. Nat Med. 2013;19(11):1423–37. doi: 10.1038/nm.3394. [DOI] [PMC free article] [PubMed] [Google Scholar]
- 4.Facciabene A, Motz GT, Coukos G. T-regulatory cells: key players in tumor immune escape and angiogenesis. Cancer Res. 2012;72(9):2162–71. doi: 10.1158/0008-5472.CAN-11-3687. [DOI] [PMC free article] [PubMed] [Google Scholar]
- 5.Nishikawa H, Sakaguchi S. Regulatory T cells in cancer immunotherapy. Curr Opin Immunol. 2014;27:1–7. doi: 10.1016/j.coi.2013.12.005. [DOI] [PubMed] [Google Scholar]
- 6.Marvel D, Gabrilovich DI. Myeloid-derived suppressor cells in the tumor microenvironment: expect the unexpected. J Clin Invest. 2015;125(9):3356–64. doi: 10.1172/JCI80005. [DOI] [PMC free article] [PubMed] [Google Scholar]
- 7.Haberland M, Montgomery RL, Olson EN. The many roles of histone deacetylases in development and physiology: implications for disease and therapy. Nat Rev Genet. 2009;10(1):32–42. doi: 10.1038/nrg2485. [DOI] [PMC free article] [PubMed] [Google Scholar]
- 8.Licciardi PV, Karagiannis TC. Regulation of immune responses by histone deacetylase inhibitors. ISRN Hematol. 2012;2012:690901. doi: 10.5402/2012/690901. [DOI] [PMC free article] [PubMed] [Google Scholar]
- 9.Ropero S, Esteller M. The role of histone deacetylases (HDACs) in human cancer. Mol Oncol. 2007;1(1):19–25. doi: 10.1016/j.molonc.2007.01.001. [DOI] [PMC free article] [PubMed] [Google Scholar]
- 10.Li Y, Seto E. HDACs and HDAC Inhibitors in Cancer Development and Therapy. Cold Spring Harb Perspect Med. 2016;6(10) doi: 10.1101/cshperspect.a026831. [DOI] [PMC free article] [PubMed] [Google Scholar]
- 11.Peinado H, et al. Snail mediates E-cadherin repression by the recruitment of the Sin3A/histone deacetylase 1 (HDAC1)/HDAC2 complex. Mol Cell Biol. 2004;24(1):306–19. doi: 10.1128/MCB.24.1.306-319.2004. [DOI] [PMC free article] [PubMed] [Google Scholar]
- 12.von Burstin J, et al. E-cadherin regulates metastasis of pancreatic cancer in vivo and is suppressed by a SNAIL/HDAC1/HDAC2 repressor complex. Gastroenterology. 2009;137(1):361–71. 371 e1–5. doi: 10.1053/j.gastro.2009.04.004. [DOI] [PubMed] [Google Scholar]
- 13.Clocchiatti A, Florean C, Brancolini C. Class IIa HDACs: from important roles in differentiation to possible implications in tumourigenesis. J Cell Mol Med. 2011;15(9):1833–46. doi: 10.1111/j.1582-4934.2011.01321.x. [DOI] [PMC free article] [PubMed] [Google Scholar]
- 14.Duong V, et al. Specific activity of class II histone deacetylases in human breast cancer cells. Mol Cancer Res. 2008;6(12):1908–19. doi: 10.1158/1541-7786.MCR-08-0299. [DOI] [PMC free article] [PubMed] [Google Scholar]
- 15.Oehme I, et al. Histone deacetylase 10 promotes autophagy-mediated cell survival. Proc Natl Acad Sci U S A. 2013;110(28):E2592–601. doi: 10.1073/pnas.1300113110. [DOI] [PMC free article] [PubMed] [Google Scholar]
- 16.Pandey UB, et al. HDAC6 rescues neurodegeneration and provides an essential link between autophagy and the UPS. Nature. 2007;447(7146):859–63. doi: 10.1038/nature05853. [DOI] [PubMed] [Google Scholar]
- 17.Gorospe M, de Cabo R. AsSIRTing the DNA damage response. Trends Cell Biol. 2008;18(2):77–83. doi: 10.1016/j.tcb.2007.11.007. [DOI] [PMC free article] [PubMed] [Google Scholar]
- 18.Mostoslavsky R, et al. Genomic instability and aging-like phenotype in the absence of mammalian SIRT6. Cell. 2006;124(2):315–29. doi: 10.1016/j.cell.2005.11.044. [DOI] [PubMed] [Google Scholar]
- 19.Wang RH, et al. Impaired DNA damage response, genome instability, and tumorigenesis in SIRT1 mutant mice. Cancer Cell. 2008;14(4):312–23. doi: 10.1016/j.ccr.2008.09.001. [DOI] [PMC free article] [PubMed] [Google Scholar]
- 20.Kroesen M, et al. HDAC inhibitors and immunotherapy; a double edged sword? Oncotarget. 2014;5(16):6558–72. doi: 10.18632/oncotarget.2289. [DOI] [PMC free article] [PubMed] [Google Scholar]
- 21.West AC, Smyth MJ, Johnstone RW. The anticancer effects of HDAC inhibitors require the immune system. Oncoimmunology. 2014;3(1):e27414. doi: 10.4161/onci.27414. [DOI] [PMC free article] [PubMed] [Google Scholar]
- 22.San-Miguel JF, et al. Panobinostat plus bortezomib and dexamethasone versus placebo plus bortezomib and dexamethasone in patients with relapsed or relapsed and refractory multiple myeloma: a multicentre, randomised, double-blind phase 3 trial. Lancet Oncol. 2014;15(11):1195–206. doi: 10.1016/S1470-2045(14)70440-1. [DOI] [PubMed] [Google Scholar]
- 23.Balasubramanian S, Verner E, Buggy JJ. Isoform-specific histone deacetylase inhibitors: the next step? Cancer Lett. 2009;280(2):211–21. doi: 10.1016/j.canlet.2009.02.013. [DOI] [PubMed] [Google Scholar]
- 24.Gryder BE, Sodji QH, Oyelere AK. Targeted cancer therapy: giving histone deacetylase inhibitors all they need to succeed. Future Med Chem. 2012;4(4):505–24. doi: 10.4155/fmc.12.3. [DOI] [PMC free article] [PubMed] [Google Scholar]
- 25.Ganai SA. Novel Approaches Towards Designing of Isoform-Selective Inhibitors Against Class II Histone Deacetylases: The Acute Requirement for Targetted Anticancer Therapy. Curr Top Med Chem. 2016;16(22):2441–52. doi: 10.2174/1568026616666160212122609. [DOI] [PubMed] [Google Scholar]
- 26.Bhadury J, et al. BET and HDAC inhibitors induce similar genes and biological effects and synergize to kill in Myc-induced murine lymphoma. Proc Natl Acad Sci U S A. 2014;111(26):E2721–30. doi: 10.1073/pnas.1406722111. [DOI] [PMC free article] [PubMed] [Google Scholar]
- 27.Ellis L, et al. The histone deacetylase inhibitors LAQ824 and LBH589 do not require death receptor signaling or a functional apoptosome to mediate tumor cell death or therapeutic efficacy. Blood. 2009;114(2):380–93. doi: 10.1182/blood-2008-10-182758. [DOI] [PMC free article] [PubMed] [Google Scholar]
- 28.Lindemann RK, et al. Analysis of the apoptotic and therapeutic activities of histone deacetylase inhibitors by using a mouse model of B cell lymphoma. Proc Natl Acad Sci U S A. 2007;104(19):8071–6. doi: 10.1073/pnas.0702294104. [DOI] [PMC free article] [PubMed] [Google Scholar]
- 29.Chinnaiyan P, et al. Modulation of radiation response by histone deacetylase inhibition. Int J Radiat Oncol Biol Phys. 2005;62(1):223–9. doi: 10.1016/j.ijrobp.2004.12.088. [DOI] [PubMed] [Google Scholar]
- 30.Di Fazio P, et al. The pan-deacetylase inhibitor panobinostat inhibits growth of hepatocellular carcinoma models by alternative pathways of apoptosis. Cell Oncol. 2010;32(4):285–300. doi: 10.3233/CLO-2010-0511. [DOI] [PMC free article] [PubMed] [Google Scholar]
- 31.Kim K, et al. Eradication of metastatic mouse cancers resistant to immune checkpoint blockade by suppression of myeloid-derived cells. Proc Natl Acad Sci U S A. 2014;111(32):11774–9. doi: 10.1073/pnas.1410626111. [DOI] [PMC free article] [PubMed] [Google Scholar]
- 32.Armeanu S, et al. Natural killer cell-mediated lysis of hepatoma cells via specific induction of NKG2D ligands by the histone deacetylase inhibitor sodium valproate. Cancer Res. 2005;65(14):6321–9. doi: 10.1158/0008-5472.CAN-04-4252. [DOI] [PubMed] [Google Scholar]
- 33.Berghuis D, et al. Histone deacetylase inhibitors enhance expression of NKG2D ligands in Ewing sarcoma and sensitize for natural killer cell-mediated cytolysis. Clin Sarcoma Res. 2012;2(1):8. doi: 10.1186/2045-3329-2-8. [DOI] [PMC free article] [PubMed] [Google Scholar]
- 34.Magner WJ, et al. Activation of MHC class I, II, and CD40 gene expression by histone deacetylase inhibitors. J Immunol. 2000;165(12):7017–24. doi: 10.4049/jimmunol.165.12.7017. [DOI] [PubMed] [Google Scholar]
- 35.van Loosdregt J, et al. Regulation of Treg functionality by acetylation-mediated Foxp3 protein stabilization. Blood. 2010;115(5):965–74. doi: 10.1182/blood-2009-02-207118. [DOI] [PubMed] [Google Scholar]
- 36.Mazur PK, et al. Combined inhibition of BET family proteins and histone deacetylases as a potential epigenetics-based therapy for pancreatic ductal adenocarcinoma. Nat Med. 2015;21(10):1163–71. doi: 10.1038/nm.3952. [DOI] [PMC free article] [PubMed] [Google Scholar]
- 37.Das R, et al. Combination therapy with anti-CTLA-4 and anti-PD-1 leads to distinct immunologic changes in vivo. J Immunol. 2015;194(3):950–9. doi: 10.4049/jimmunol.1401686. [DOI] [PMC free article] [PubMed] [Google Scholar]
- 38.Pardoll DM. The blockade of immune checkpoints in cancer immunotherapy. Nat Rev Cancer. 2012;12(4):252–64. doi: 10.1038/nrc3239. [DOI] [PMC free article] [PubMed] [Google Scholar]
- 39.Crisanti MC, et al. The HDAC inhibitor panobinostat (LBH589) inhibits mesothelioma and lung cancer cells in vitro and in vivo with particular efficacy for small cell lung cancer. Mol Cancer Ther. 2009;8(8):2221–31. doi: 10.1158/1535-7163.MCT-09-0138. [DOI] [PMC free article] [PubMed] [Google Scholar]
- 40.Pratap J, et al. The histone deacetylase inhibitor, vorinostat, reduces tumor growth at the metastatic bone site and associated osteolysis, but promotes normal bone loss. Mol Cancer Ther. 2010;9(12):3210–20. doi: 10.1158/1535-7163.MCT-10-0572. [DOI] [PMC free article] [PubMed] [Google Scholar]
- 41.Woan KV, et al. Targeting histone deacetylase 6 mediates a dual anti-melanoma effect: Enhanced antitumor immunity and impaired cell proliferation. Mol Oncol. 2015;9(7):1447–57. doi: 10.1016/j.molonc.2015.04.002. [DOI] [PMC free article] [PubMed] [Google Scholar]
- 42.Cheng F, et al. A novel role for histone deacetylase 6 in the regulation of the tolerogenic STAT3/IL-10 pathway in APCs. J Immunol. 2014;193(6):2850–62. doi: 10.4049/jimmunol.1302778. [DOI] [PMC free article] [PubMed] [Google Scholar]
- 43.Whiteside TL. Methods to monitor immune response and quality control. Dev Biol (Basel) 2004;116:219–28. discussion 229–36. [PubMed] [Google Scholar]
- 44.DuPage M, Dooley AL, Jacks T. Conditional mouse lung cancer models using adenoviral or lentiviral delivery of Cre recombinase. Nat Protoc. 2009;4(7):1064–72. doi: 10.1038/nprot.2009.95. [DOI] [PMC free article] [PubMed] [Google Scholar]
- 45.Sato E, et al. Intraepithelial CD8+ tumor-infiltrating lymphocytes and a high CD8+/regulatory T cell ratio are associated with favorable prognosis in ovarian cancer. Proc Natl Acad Sci U S A. 2005;102(51):18538–43. doi: 10.1073/pnas.0509182102. [DOI] [PMC free article] [PubMed] [Google Scholar]
- 46.Asthana J, et al. Inhibition of HDAC6 deacetylase activity increases its binding with microtubules and suppresses microtubule dynamic instability in MCF-7 cells. J Biol Chem. 2013;288(31):22516–26. doi: 10.1074/jbc.M113.489328. [DOI] [PMC free article] [PubMed] [Google Scholar]
- 47.Zhang Y, et al. HDAC-6 interacts with and deacetylates tubulin and microtubules in vivo. EMBO J. 2003;22(5):1168–79. doi: 10.1093/emboj/cdg115. [DOI] [PMC free article] [PubMed] [Google Scholar]
- 48.Filippakopoulos P, Knapp S. Targeting bromodomains: epigenetic readers of lysine acetylation. Nat Rev Drug Discov. 2014;13(5):337–56. doi: 10.1038/nrd4286. [DOI] [PubMed] [Google Scholar]
- 49.Belkina AC, Nikolajczyk BS, Denis GV. BET protein function is required for inflammation: Brd2 genetic disruption and BET inhibitor JQ1 impair mouse macrophage inflammatory responses. J Immunol. 2013;190(7):3670–8. doi: 10.4049/jimmunol.1202838. [DOI] [PMC free article] [PubMed] [Google Scholar]
- 50.Prinjha R, Tarakhovsky A. Chromatin targeting drugs in cancer and immunity. Genes Dev. 2013;27(16):1731–8. doi: 10.1101/gad.221895.113. [DOI] [PMC free article] [PubMed] [Google Scholar]
- 51.Liu S, et al. Targeting STAT5 in hematologic malignancies through inhibition of the bromodomain and extra-terminal (BET) bromodomain protein BRD2. Mol Cancer Ther. 2014;13(5):1194–205. doi: 10.1158/1535-7163.MCT-13-0341. [DOI] [PMC free article] [PubMed] [Google Scholar]
- 52.Ott CJ, et al. BET bromodomain inhibition targets both c-Myc and IL7R in high-risk acute lymphoblastic leukemia. Blood. 2012;120(14):2843–52. doi: 10.1182/blood-2012-02-413021. [DOI] [PMC free article] [PubMed] [Google Scholar]
- 53.Toniolo PA, et al. Inhibiting STAT5 by the BET bromodomain inhibitor JQ1 disrupts human dendritic cell maturation. J Immunol. 2015;194(7):3180–90. doi: 10.4049/jimmunol.1401635. [DOI] [PMC free article] [PubMed] [Google Scholar]
- 54.Falkenberg KJ, Johnstone RW. Histone deacetylases and their inhibitors in cancer, neurological diseases and immune disorders. Nat Rev Drug Discov. 2014;13(9):673–91. doi: 10.1038/nrd4360. [DOI] [PubMed] [Google Scholar]
- 55.Nishikawa H, Sakaguchi S. Regulatory T cells in tumor immunity. Int J Cancer. 2010;127(4):759–67. doi: 10.1002/ijc.25429. [DOI] [PubMed] [Google Scholar]
- 56.Wing K, et al. CTLA-4 control over Foxp3+ regulatory T cell function. Science. 2008;322(5899):271–5. doi: 10.1126/science.1160062. [DOI] [PubMed] [Google Scholar]
- 57.Williams LM, Rudensky AY. Maintenance of the Foxp3-dependent developmental program in mature regulatory T cells requires continued expression of Foxp3. Nat Immunol. 2007;8(3):277–84. doi: 10.1038/ni1437. [DOI] [PubMed] [Google Scholar]
- 58.Zhang B, et al. Nonoverlapping roles of PD-1 and FoxP3 in maintaining immune tolerance in a novel autoimmune pancreatitis mouse model. Proc Natl Acad Sci U S A. 2016;113(30):8490–5. doi: 10.1073/pnas.1608873113. [DOI] [PMC free article] [PubMed] [Google Scholar]
- 59.Shen L, et al. Class I histone deacetylase inhibitor entinostat suppresses regulatory T cells and enhances immunotherapies in renal and prostate cancer models. PLoS One. 2012;7(1):e30815. doi: 10.1371/journal.pone.0030815. [DOI] [PMC free article] [PubMed] [Google Scholar]
- 60.Beier UH, et al. Histone deacetylases 6 and 9 and sirtuin-1 control Foxp3+ regulatory T cell function through shared and isoform-specific mechanisms. Sci Signal. 2012;5(229):ra45. doi: 10.1126/scisignal.2002873. [DOI] [PMC free article] [PubMed] [Google Scholar]
- 61.den Haan JM, Arens R, van Zelm MC. The activation of the adaptive immune system: cross-talk between antigen-presenting cells, T cells and B cells. Immunol Lett. 2014;162(2 Pt B):103–12. doi: 10.1016/j.imlet.2014.10.011. [DOI] [PubMed] [Google Scholar]
- 62.Fuertes Marraco SA, et al. Inhibitory Receptors Beyond T Cell Exhaustion. Front Immunol. 2015;6:310. doi: 10.3389/fimmu.2015.00310. [DOI] [PMC free article] [PubMed] [Google Scholar]
- 63.Liu C, Workman CJ, Vignali DA. Targeting regulatory T cells in tumors. FEBS J. 2016;283(14):2731–48. doi: 10.1111/febs.13656. [DOI] [PubMed] [Google Scholar]
- 64.Montler R, et al. OX40, PD-1 and CTLA-4 are selectively expressed on tumor-infiltrating T cells in head and neck cancer. Clin Transl Immunology. 2016;5(4):e70. doi: 10.1038/cti.2016.16. [DOI] [PMC free article] [PubMed] [Google Scholar]
- 65.Zhao Y, et al. Anticancer activity of SAHA, a potent histone deacetylase inhibitor, in NCI-H460 human large-cell lung carcinoma cells in vitro and in vivo. Int J Oncol. 2014;44(2):451–8. doi: 10.3892/ijo.2013.2193. [DOI] [PubMed] [Google Scholar]
- 66.Akbay EA, et al. Activation of the PD-1 pathway contributes to immune escape in EGFR-driven lung tumors. Cancer Discov. 2013;3(12):1355–63. doi: 10.1158/2159-8290.CD-13-0310. [DOI] [PMC free article] [PubMed] [Google Scholar]
- 67.Picelli S, et al. Smart-seq2 for sensitive full-length transcriptome profiling in single cells. Nat Methods. 2013;10(11):1096–8. doi: 10.1038/nmeth.2639. [DOI] [PubMed] [Google Scholar]
- 68.Picelli S, et al. Full-length RNA-seq from single cells using Smart-seq2. Nat Protoc. 2014;9(1):171–81. doi: 10.1038/nprot.2014.006. [DOI] [PubMed] [Google Scholar]
- 69.Trombetta JJ, et al. Preparation of Single-Cell RNA-Seq Libraries for Next Generation Sequencing. Curr Protoc Mol Biol. 2014;107:4 22 1–17. doi: 10.1002/0471142727.mb0422s107. [DOI] [PMC free article] [PubMed] [Google Scholar]
Associated Data
This section collects any data citations, data availability statements, or supplementary materials included in this article.