Abstract
Diabetic kidney disease (DKD) is a serious disease that presents a major health problem worldwide. There is a desperate need to explore novel biomarkers to further facilitate the early diagnosis and effective treatment in DKD patients, thus preventing them from developing end-stage renal disease (ESRD). However, most regulation mechanisms at the genetic level in DKD still remain unclear. In this paper, we describe our innovative methodologies that integrate biological, computational, and statistical approaches to investigate important roles performed by regulations among microRNAs (miRs), long non-coding RNAs (lncRNAs), and messenger RNAs (mRNAs) in DKD. We conducted fully transparent, rigorously designed experiments. Our robust and reproducible results identified hsa-miR-223-3p as a candidate novel biomarker performing important roles in DKD disease process.
Keywords: MicroRNA (miR), Long non-coding RNA (lncRNA), Diabetes, Diabetic kidney disease (DKD), Co-expression analysis, Biomarker
1. Introduction
The International Diabetes Federation (IDF) report indicated that in 2011 there were 366 million diabetic patients worldwide — this number was estimated to increase to 552 million in 2030. In addition, the prevalence of diabetes has significantly increased in both developed and developing countries [1,2]. For example, diabetes patients in China were approximately 113.9 million in 2013 [3]. Moreover, research has demonstrated that diabetes is the most common disease causing chronic kidney disease (CKD), and diabetic patients have a 2.6-fold risk to develop CKD compared to non-diabetic patients. In fact, diabetic kidney disease (DKD) is one of the most important microvascular complications of patients with diabetes mellitus (DM) [4]. In most cases, there are no specific clinical manifestations during the early stage of DKD. More seriously, there are currently no effective methods to prevent DKD patients from developing kidney failure, which is also known as end-stage renal disease (ESRD), an important cause of death in diabetic patients.
The gold diagnostic criterion of various kidney diseases is to perform pathological biopsy on renal tissues, which unfortunately has high risk of patient injury. Quantitative test of urinary micro-protein is one popular non-invasive diagnostic indicator. But there are quite some limitations in this method due to various factors such as: the complexity of the protein, the variation caused by post-translational modifications, the stability of the specimen, and so forth. Especially, for patients at the early stage of nephropathy, the false negative rate of urinary micro-protein test is particularly high. Therefore, there is an urgent need to explore novel biomarkers that are both sensitive and specific to guide early diagnosis of DKD in an effective manner; it is then possible to give early intervention and proper treatment to diabetic patients to prevent the progression from DKD to ESRD.
Towards this end, we will need to significantly enhance our understanding of the genetic foundation underlying DKD disease process. Thus, it is necessary to develop more advanced methodologies that are capable of integrating biological, computational, and statistical approaches in a seamless manner; only in this way will it be possible for us to explore a more accurate representation of biological processes that regulate DKD and the progression from DKD to ESRD. That said, we report in this paper our efforts in effectively combining biological experiments, semantics-oriented computational analysis, and statistical analysis to better investigate important roles performed by regulations among microRNAs (miRs), long non-coding RNAs (lncRNAs), and messenger RNAs (mRNAs) in DKD disease process.
The rest of this paper is organized as follows. Section 2 summarizes related work; Section 3 describes in detail our methodologies; Section 4 reports our findings along with discussion; and finally, Section 5 concludes with important future work.
2. Related work
2.1. Related work in mechanisms performed by miRs and lncRNAs in DKD
Although far from being completely elucidated, the genetic regulation mechanisms performed by various miRs and lncRNAs in DKD have attracted a lot research efforts.
According to the experimental results in vitro animal models reported in [5,6], miR-192 expression increases in DKD kidney tissue, and inhibition of miR-192 expression (or knockout of miR–192) can reduce the discharge proteinuria and renal fibrosis in mice with type 1 diabetes. On the other hand, the expression of the same miR is reduced in DKD patients. In fact, miR-192 expression was shown to be negatively correlated with renal tubular interstitial fibrosis and renal function decline. The research in [7] demonstrates that high glucose station can stimulate TGF-β1/Smad3 signal pathways of kidney cells and thus cause higher miR–21 expression. Lacking of Smad3 can prevent cells from up-regulating miR-21 in response to TGF-β1/Smad3 signal pathways, which promotes renal fibrosis. As a result, inhibition of miR-21 may be a therapeutic approach to suppress renal fibrosis. Another study [8] has shown that miR–21 expression was down-regulated in the kidney tissue of type 2 diabetic mouse model. When excessive miR-21 expression was inhibited, the occurrence of apoptosis can be found in animal model. Interestingly, the role of miR-29 in DKD has conflicting conclusions [9]: the expression of miR-29 in diabetes patients can be observed both increased or decreased.
Although a small number of lncRNAs have been functionally characterized [10,11], it remains questionable whether the majority is biologically meaningful or merely transcriptional noise. The few lncRNAs that have been characterized to date exhibit adverse range of functions and expression in specific cell types and/or localization to specific subcellular compartments. In recent years a number of studies [12–14] have found that quite some lncRNAs are associated with the onset of diabetes. In particular, the islet tissue specific anti-sense lncRNAs were reported to be associated with the pathogenesis of diabetes such as neonatal diabetes. In addition, MALAT1, ANRIL/CDKN2BAS, HI-LNC25, and KCNQ1OT1 were reported to closely associated with type 2 diabetes susceptibility genes. Research [15] has also shown that, whereas many lncRNAs are interacted with protein functions in chromatin remodeling and gene transcription, some lncRNAs function by regulating miR functions. While lncRNAs can be used as miR precursors, they can also be combined with miRs and participate in miR regulation network, thus affecting more functional gene expression.
2.2. Related work in semantic technologies
In biomedical investigation, when we need to integrate large amounts of data from semantically heterogeneous sources, semantic technologies that are based on domain ontologies can render great assistance.
Bio-ontologies have been widely utilized nowadays, such as: Gene Ontology (GO) [16], the most successful and widely used bio-ontology with three independent sub-ontologies (biological processes, molecular functions, and cellular components); Non-Coding RNA Ontology (NCRO) [17,18], an Open Biological and Biomedical Ontologies (OBO) [19] candidate reference ontology in non-coding RNA (ncRNA) domain; and Ontology for MIcroRNA Target (OMIT) [20–22], an application ontology to provide the community with common data elements and data exchange standards in the miR research.
Part of our proposed methodologies in this paper are closely related to semantic search [23], which usually requires the utilization of structured knowledge to model/interpret search queries, by using formal logic for example. One popular idea in numerous semantic search systems ([24–28] for example) is to expand the query keywords utilizing synonyms and other relations not originally part of the query. A second way to implement semantic search is to translate the original keyword-based search into some formal semantic queries through the adoption of domain ontologies.
2.3. Related work in statistical tools applied in biomedical and clinical domain
Statistical tools have been effectively promoted biomedical and clinical research for a long history [29,30]. Commonly adopted statistical methods include linear regression analysis, receiver operating characteristic (ROC) curve, and the calculation of area under the curve (AUC). In [31], the authors discussed several issues in the calculation, use, meaning, and presentation of AUC in diabetes research. Nathan et al. [32] used different linear regression models to help define the mathematical relationship between A1C and average glucose (AG) levels and determine whether A1C could be expressed and reported as AG in the same units as used in self-monitoring. Ku and Kegels [33] adopted ROC-AUC to evaluate the performance of the Finnish Diabetes Risk Score and two modifications in community screening for undiagnosed type 2 diabetes in the Philippines. Stiglic et al. [34] discovered that American Diabetes Association risk test achieved the best predictive performance in category of classical paper-and-pencil based tests with an AUC of 0.699 for undiagnosed diabetes and 47% of persons selected for screening. Their results demonstrated a significant difference in performance with additional benefits for a smaller number of subjects selected for screening when statistical methods are used. In [35], to figure out whether studies of predictors of response should adjust for baseline HbA1c, the authors utilized linear regression to facilitate the exploration of the relationship between baseline HbA1c and the change between pre-baseline and baseline HbA1c values.
3. Methods
3.1. Overview of our methodologies
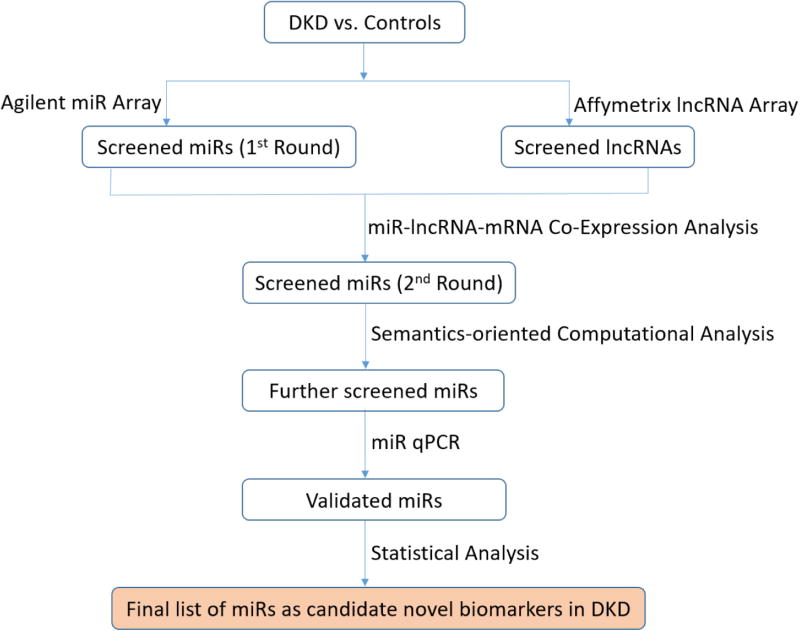
Our methodologies are exhibited in Fig. 1, consisting of five steps.
Step 1. Microarray test for initial screening: Among plasma samples from DKD and DM patients vs. controls, we used the microarray method to simultaneously detect different expression levels of miRs (using Agilent chips) and lncRNAs (using Affymetrix HTA2.0 chips), resulting in the first-round screened miRs and lncRNAs, respectively. We then utilized GeneSpring package (version 13.1 by Agilent Technologies) [36] to perform the statistic analysis: mean ± standard deviation (SD) for normal distribution; single-factor analysis of variance for comparison among different groups; and least significant difference (LSD) test for comparison between a pair.
Step 2. Co-expression analysis for 2nd-round screening: We performed miR-lncRNA-mRNA co-expression network analysis based on Pearson correlation coefficient calculation. A total of 300 differentially expressed molecules were returned: top 100 miRs, top 100 lncRNAs, and top 100 mRNAs (in terms of their connection degrees). Next, we utilized the igraph software package [37] to construct a network connection diagram. Following this, we obtained a set of second-round screened miRs.
Step 3. Semantics-oriented computational analysis: OmniSearch [22,38,39] is an analytical software tool based upon domain ontologies and semantic technologies. For each miR in the second-round screened list from Step 2, we used the OmniSearch tool to obtain a set of target mRNAs integrated from various miR target prediction and validation databases. Besides, OmniSearch also provided us with a rich set of additional data for each target mRNA, including GO annotations, PubMed publications, relevant MeSH terms, involved pathways, and ncRNA sequences. By analyzing the federated knowledge returned from the OmniSearch tool, we further filtered out more likely miRs as candidate biomarkers.
Step 4. Biological validation: We performed real-time quantitative PCR (qPCR) to detect plasma expression levels of miRs returned from Step (3). By comparing the different expression levels of miRs among different groups (DKD, DM, and control), we obtained a set of miRs that were biologically validated to be down-regulated in DKD patients.
Step 5. Statistical analysis: We used linear regression model to identify those miRs whose expression levels have statistically significant associations with DKD disease process. We then conducted statistical analysis via ROC curve on miR expression, followed by the calculation of AUC to estimate the diagnostic value of candidate miRs in DKD. Based on the AUC result (using a two-sided P value < 0.05 as statistical significance), we generated a final list of miRs as candidate novel biomarkers in DKD.
Fig. 1.
Overview of our combined approach to investigate genetic regulation mechanisms in DKD.
3.2. Greater technical details and materials
3.2.1. Subject selection
All 85 subjects (informed consent signed) were recruited from First Affiliated Hospital of Kunming Medical University. We selected three different cohorts: DKD patients, DM patients, and healthy persons (as controls). The first two cohorts were recruited from the Department of Endocrinology, and the last cohort was recruited from the Physical Examination Center.
Our selection criteria on DKD patients were: (1) urinary albumin excretion rate greater than 30 mg/24 h; (2) urinary albumin/creatinine ratio (ACR) between 30 and 300 mg/g; and (3) without hypertension, other causes of renal insufficiency, severe hepatic insufficiency, or blood system diseases.
3.2.2. Lab examination
Blood samples were obtained by venipuncture into tubes containing EDTA in the morning after a 10-h overnight fast, and plasma samples were immediately placed at 4 °C and centrifuged according to a standardized protocol (spun at 3500×g for 15 min), aliquoted and stored at −80 °C within two hours until analysis. Hemoglobin A1C (HbA1C) was measured by automated high-performance liquid chromatography system (Primus Ultra2, Trinity Biotech, Bray, Co Wicklow, Ireland). Aspartate amino transferase (AST), alanine aminotransferase (ALT), creatinine, fasting plasma glucose (FPG), and lipid profiles including total triglyceride (TG), total cholesterol (TC), high-density lipoprotein cholesterol (HDL-C), and low-density lipoprotein cholesterol (LDL-C) were assessed using an automated Hitachi-008 system (Hitachi, Chiyoda, Tokyo, Japan). Estimated glomerular filtration rate (eGFR) was calculated via MDRD Study creatinine Equation.
3.2.3. miR techniques (including qPCR)
miRs were isolated from plasma using the miRNeasy Mini Kit (Qiagen, Catalog No. 217004, Germany) according to the manufacturer’s specifications. 700 µl Qiazol lysis reagent were added to 200 µl of plasma and incubated at room temperature for five minutes. 1 µl of cel-miR-39 (TIAGEN, CR100-01,China) were spiked in plasma as an exogenous internal control. After mixing, 140 µl of chloroform were added, followed by 15 s of overtaxing. After incubation for three minutes at room temperature, the samples were centrifuged for 15 min at 12000g and 4 °C. The upper phase (approximately 500 µl) was transferred to a new tube, and 750 µl 100% ethanol were added. miR samples were eluted from the columns in 25 µl RNase-free water and stored at −80 °C. The yield of RNA was determined using a NanoDrop 2000 spectrophotometer (Thermo Scientific, USA).
6 µl isolated miR were used for reverse transcription to synthesize complementary DNA (cDNA) using miR-specific primers and the miR reverse Ntranscription kit (TIAGEN, KR211-02, China). The 20 µl RT reaction mix was then held at −20 °C.
After reverse transcription, an amplification step using SYBR Green miR assays (TIAGEN, FP411-02, China) was performed. miRs were analyzed using real-time qPCR for all three cohorts. Based on reproducible results for miR primer (TIAGEN, CD201-0099, China), real-time qPCR was performed using Rotor-Gene Q (Rotor-Disc) Instrument (Qiagen, Germany) with 10 µl PCR reaction mixture that included 1 µl of cDNA, 5 µl of 2×miRcute miR premix (TIAGEN, China), 0.2 µl of forward primer, 0.2 µl of reverse primer, and 3.6 µl of nuclease-free water. Reactions were incubated in a 72-well optical plate (Qiagen, Germany) at 94 °C for two minutes, 94 °C for 20 s followed by five cycles of 64 °C for 20 s, 72 °C for 34 s, 40 cycles of 94 °C for 20 s, and 60 °C for 34 s. Each sample was run in triplicate for analysis. At the end of these qPCR cycles, melting curve analysis was performed to validate the specific generation of the expected PCR product.
For all qPCRs, a maximum of 40 cycles were performed and the cycle number at which the amplification plot crossed the cycles threshold (CT) was calculated. Relative expression levels were calculated using miR levels after normalization to spiked-in cel-miR-39. Expression differences were calculated using the mean value of the controls as the factor for normalization to internal control. Note that all calculations were conducted using the 2−ΔΔCt method.
3.2.4. Semantics-oriented computational analysis
The OmniSearch analytical software was built upon semantic technologies (including semantic data annotation, semantic data integration, and semantic search) that are based on two domain ontologies, Ontology for MIcroRNA Targets (OMIT) [20–22] and Non-Coding RNA Ontology (NCRO) [17,18]. OmniSearch was developed to handle the significant challenge of effective miR data integration and knowledge acquisition. Three miR target prediction databases (miRDB [40], TargetScan [41], and miRanda [42]) and one miR validated target database (miRTarBase [43]) have been integrated in OmniSearch. This software tool provides with us a “one-stop” visit that enables a convenient, side-by-side comparison among results from numerous miR target prediction/validation databases, as well as the federated knowledge semantically integrated from other relevant data sources including GO annotations, PubMed publications, relevant MeSH terms, involved pathways, and ncRNA sequences. Previous research [22,38] has demonstrated that OmniSearch has many advantages over conventional miR target search, especially with regard to the accuracy (effectiveness) and efficiency of software output. According to the computational analysis based on the consolidated knowledge returned from the OmniSearch software tool, we further filtered out more likely miR candidates in an effective and efficient manner.
3.2.5. Statistical analysis
Statistical analysis was performed using SPSS version 23 software (SPSS Inc., Chicago, IL). Shapiro–Wilk tests were used to assess normality of continuous variables. The Student’s t-tests or non-parametric tests were used to compare continuous variables (normally vs. non-normally distributed) across three cohorts (DKD patients, DM patients, and health controls). Real-time qPCR data were reported in the format of mean ± SD after logarithmic transformation to normal distribution. Quantitative data were compared using the one-way ANOVA with post hoc LSD correction (adjustments, resp.) for multiple comparisons (multivariate analysis, resp.). To evaluate the expression signature of specific miR concentrations, multivariate linear regression analysis was adopted. Standardized coefficients B and their standard errors (SEs) were obtained. Receiver operating characteristic (ROC) curves and the area under the ROC curve (AUC) were used to estimate the diagnostic value of the candidate miRs.
4. Experimental results and discussion
4.1. Background information and routine lab results on all subjects
The background information of all 85 subjects along with their routine lab examination results are exhibited in Table 1.
Table 1.
Clinical background of patients and controls in our experiments.
| DKD Patients (n = 27) |
DM Patients (n = 30) |
Controls (n = 28) |
|
|---|---|---|---|
| Age (years) | 55.09 ± 12.01 | 53.23 ± 7.89 | 33.17 ± 10.83 |
| Gender (male/female) | 14/10 | 18/12 | 17/11 |
| BMI (kg/m2) | 24.31 ± 2.92 | 24.41 ± 2.95 | 21.76 ± 3.08 |
| DM Duration (years) | 7.21 ± 4.36 | 6.18 ± 5.07 | — |
| eGFR (ml/min/1.73 m3) | 107.67 ± 27.74 | 110.43 ± 27.73 | 100.66 ± 10.43 |
| FPG (mmol/L) | 10.79 ± 3.91 | 12.07 ± 2.68 | 5.19 ± 0.73 |
| 2 h-PPG (mmol/L) | 17.51 ± 4.97 | 19.99 ± 7.21 | — |
| ALT (IU/L) | 17.55 (10.44, 27.30) | 20.00 (14.79, 41.50) | 24.80 ± 20.66 |
| AST (IU/L) | 16.95 ± 8.01 | 17.85 ± 6.32 | 24.52 ± 8.49 |
| UA (umol/L) | 361.18 ± 95.11 | 321.64 ± 63.21 | 336.29 ± 56.49 |
| TC (mmol/L) | 3.99 ± 0.87 | 4.29 ± 0.64 | 4.53 ± 0.56 |
| LDL-C (mmol/L) | 2.74 ± 0.99 | 2.82 ± 0.559 | 2.44 ± 0.49 |
| TG (mmol/L) | 1.63 ± 0.79 | 3.14 ± 1.71 | 1.12 ± 0.63 |
| HDL-C (mmol/L) | 1.01 ± 0.84 | 0.97 ± 0.15 | 1.57 ± 0.41 |
| C-peptide (ng/mL) | 1.27 ± 0.72 | 1.26 ± 0.69 | — |
| HbA1c (%) | 8.94 ± 1.89 | 8.64 ± 1.58 | — |
| Urinary ACR (mg/g) | 51.51 (31.71, 67.67) | 13.92 ± 6.21 | — |
| WBC (× 109/L) | 6.04 ± 1.38 | 5.92 ± 1.28 | 4.91 ± 0.47 |
| Hb (g/L) | 147.18 ± 17.15 | 146.84 ± 12.37 | 148 ± 13.67 |
Abbreviations in the table: body mass index (BMI); diabetes mellitus (DM); estimated glomerular filtration rate (eGFR); fasting plasma glucose (FPG); two hours after post-prandial plasma glucose (2 h-PPG); alanine aminotransferase (ALT); aspartate amino transferase (AST); uric acid (UA); total cholesterol (TC); low-density lipoprotein cholesterol (LDL-C); total triglyceride (TG); high-density lipoprotein cholesterol (HDL-C); hemoglobin A1C (HbA1C); albumin/creatinine ratio (ACR); white blood cell (WBC); and hemoglobin (Hb).
Notes: Data of normal distribution were expressed in the format of [mean ± SD]; other data were expressed in the format of [median (25%, 75%)].
4.2. Microarray test results
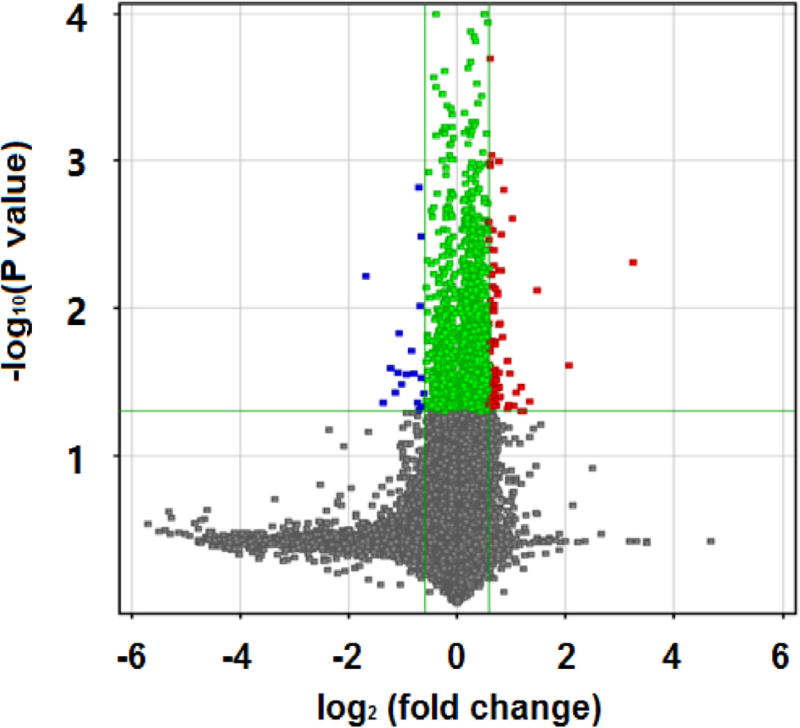
Fig. 2 is the result on Affymetrix HTA2.0 chips. We used T test to calculate both the significant difference (P value) and standardized signal multiple fold change value. If the fold change was greater than or equal to 1.5 and the P value was less than or equal to 0.05, the corresponding lncRNA was selected. We identified a total of 127 lncRNAs, among which 101 were up-regulated and 26 were down-regulated. In Fig. 2, the x axis corresponds to log2 (fold change), the y axis corresponds to −log10 (P value), and blue and red dots represent differentially expressed lncRNAs.
Fig. 2.
Affymetrix HTA2.0 outcome: differentially expressed lncRNAs of DKD patients compared to controls.
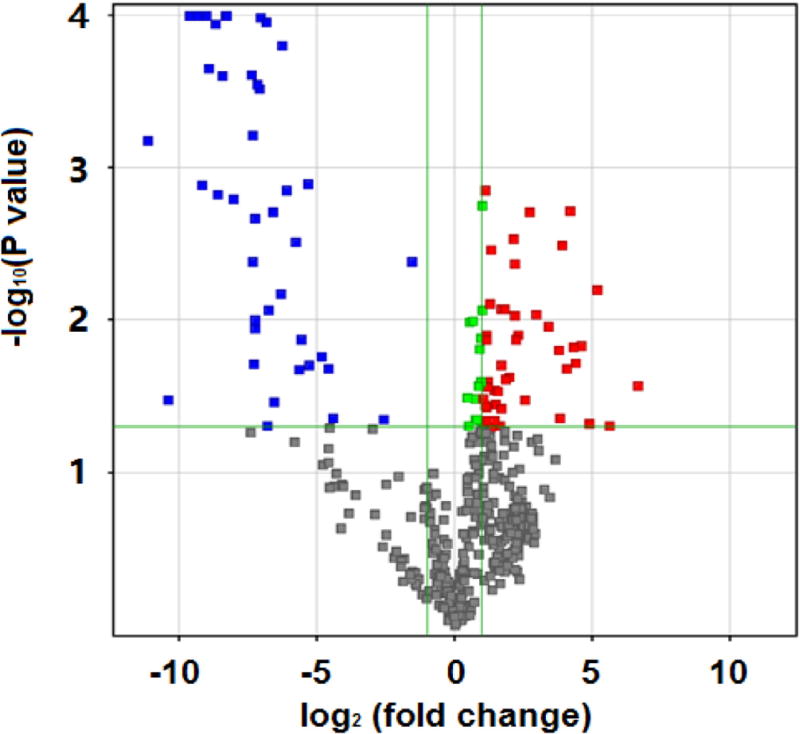
Fig. 3 is the result on Agilent miR microarray chips. Similarly, we used T test to calculate P value and fold change. If the fold change was greater than or equal to 2.0 and the P value was less than or equal to 0.05, the corresponding miR was selected. We identified a total of 88 miRs, among which 47 were up-regulated and 41 were down-regulated. Similarly to Fig. 2, the x axis in Fig. 3 corresponds to log2 (fold change), the y axis corresponds to −log10 (P value), and blue and red dots represent differentially expressed miRs.
Fig. 3.
Agilent miR microarray outcomes: differentially expressed miRs of DKD patients compared to controls.
4.3. miR-lncRNA-mRNA co-expression analysis results
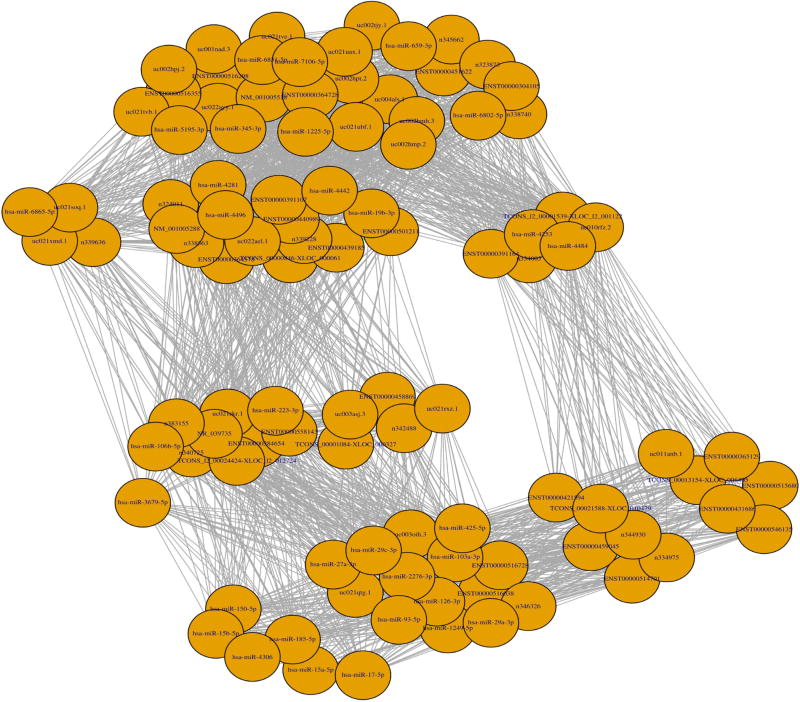
Fig. 4 demonstrates a miR-lncRNA-mRNA co-expression network obtained in our experiments, which includes a total of 88 candidate miRs. We first calculated the Pearson correlation coefficient between pair-wise genes with a threshold value of 0.85. That is, a pair of genes will only be considered for further analysis if the absolute value of their Pearson correlation coefficient is equal to or greater than 0.85. Next, for each gene that passed the threshold filtering, we counted its number of connected genes, and the top 20 genes were treated as core genes, which were then utilized by the igraph software to generate the final list of 32 candidate miRs. Information on these second-round filtered miRs is detailed in Table 2.
Fig. 4.
miR-lncRNA-mRNA co-expression network.
Table 2.
The second-round selection of miRs through co-expression analysis.
| Selected miR |
Co-expression Degree |
Selected miR |
Co-expression Degree |
|---|---|---|---|
| hsa-miR-223-3p | 86 | hsa-miR-6831-5p | 71 |
| hsa-miR-106b-5p | 86 | hsa-miR-5195-3p | 71 |
| hsa-miR-103a-3p | 83 | hsa-miR-7106-5p | 71 |
| hsa-miR-126-3p | 83 | hsa-miR-4253 | 70 |
| hsa-miR-27a-3p | 83 | hsa-miR-4484 | 70 |
| hsa-miR-29a-3p | 83 | hsa-miR-659-3p | 70 |
| hsa-miR-29c-3p | 83 | hsa-miR-6802-5p | 70 |
| hsa-miR-425-5p | 83 | hsa-miR-19b-3p | 68 |
| hsa-miR-93-5p | 83 | hsa-miR-4496 | 68 |
| hsa-miR-1249-5p | 83 | hsa-miR-6865-5p | 67 |
| hsa-miR-2276-3p | 83 | hsa-miR-150-5p | 66 |
| hsa-miR-1225-5p | 71 | hsa-miR-15a-5p | 66 |
| hsa-miR-345-3p | 71 | hsa-miR-15b-5p | 66 |
| hsa-miR-3679-5p | 71 | hsa-miR-17-5p | 66 |
| hsa-miR-4281 | 71 | hsa-miR-185-5p | 66 |
| hsa-miR-4442 | 71 | hsa-miR-4306 | 66 |
4.4. Semantics-oriented computational analysis results
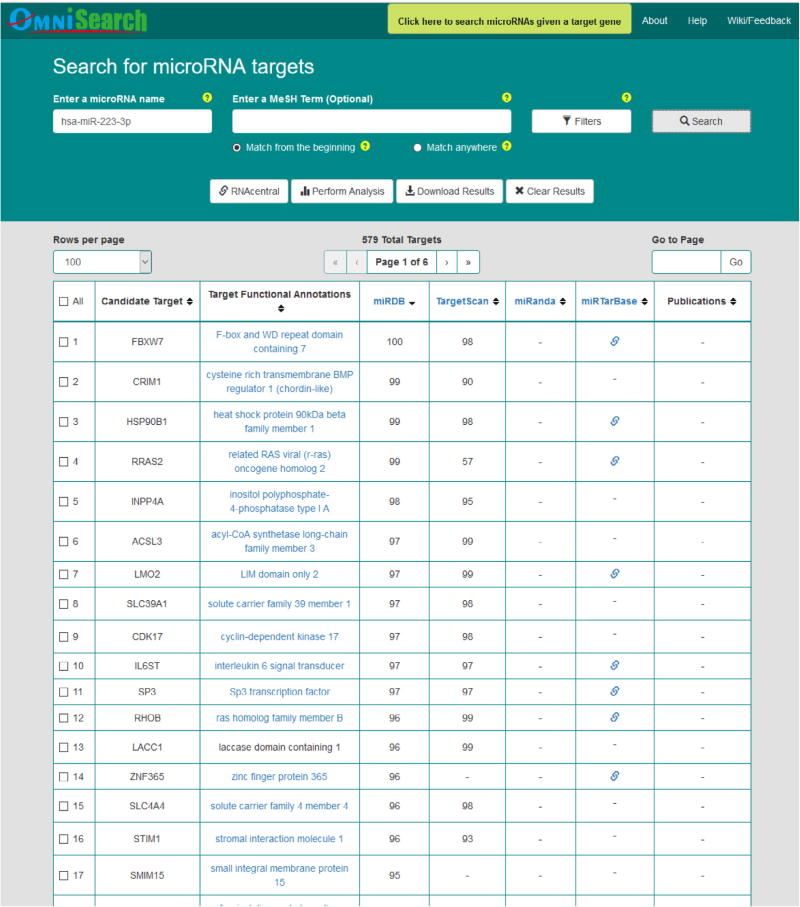
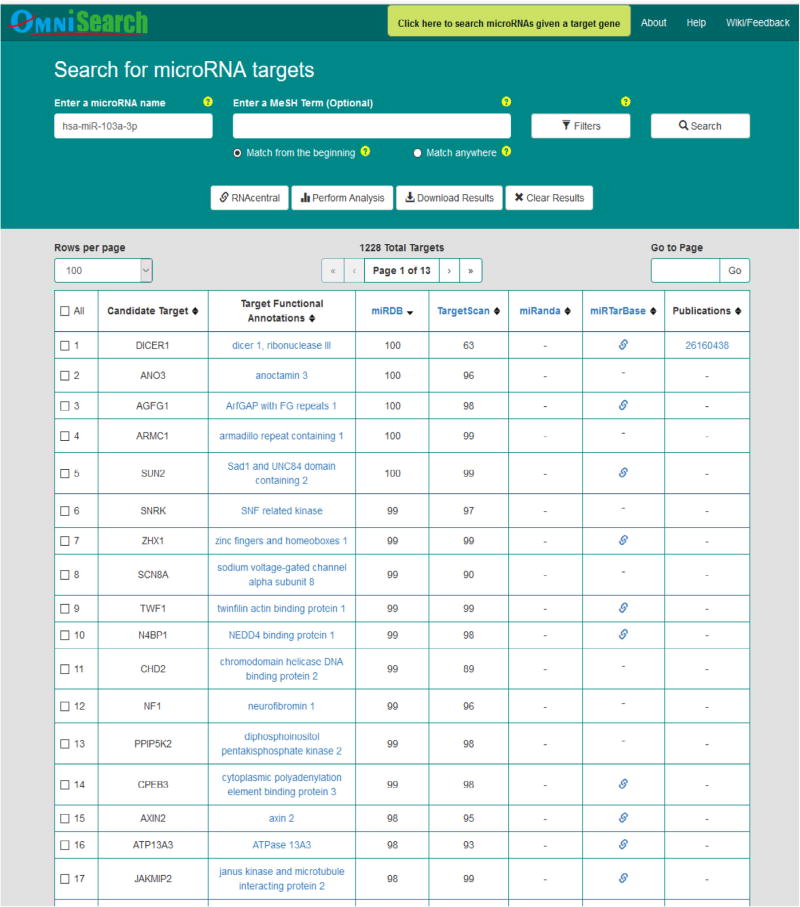
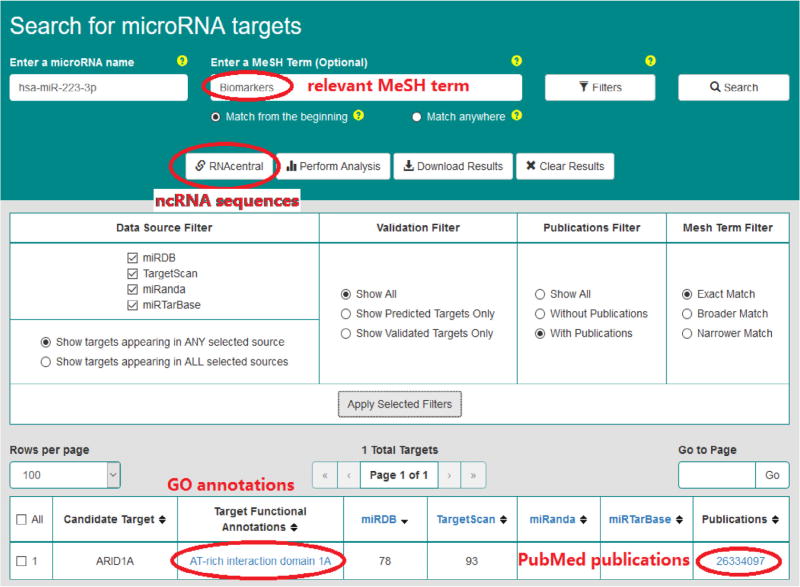
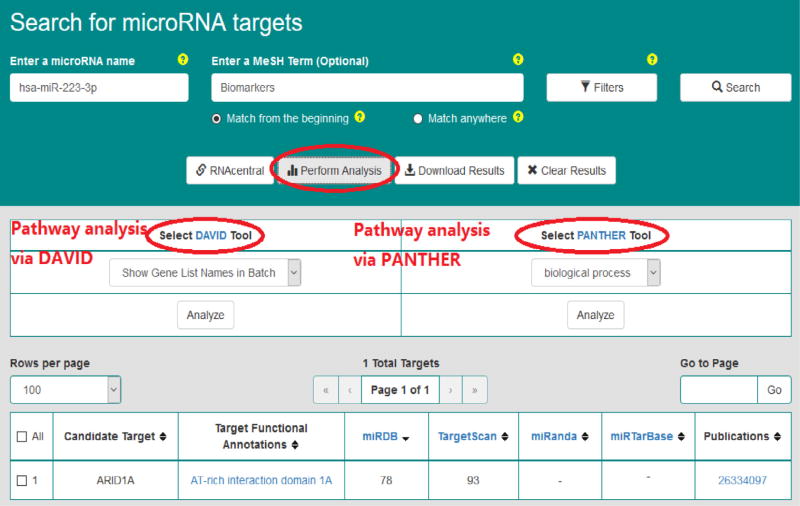
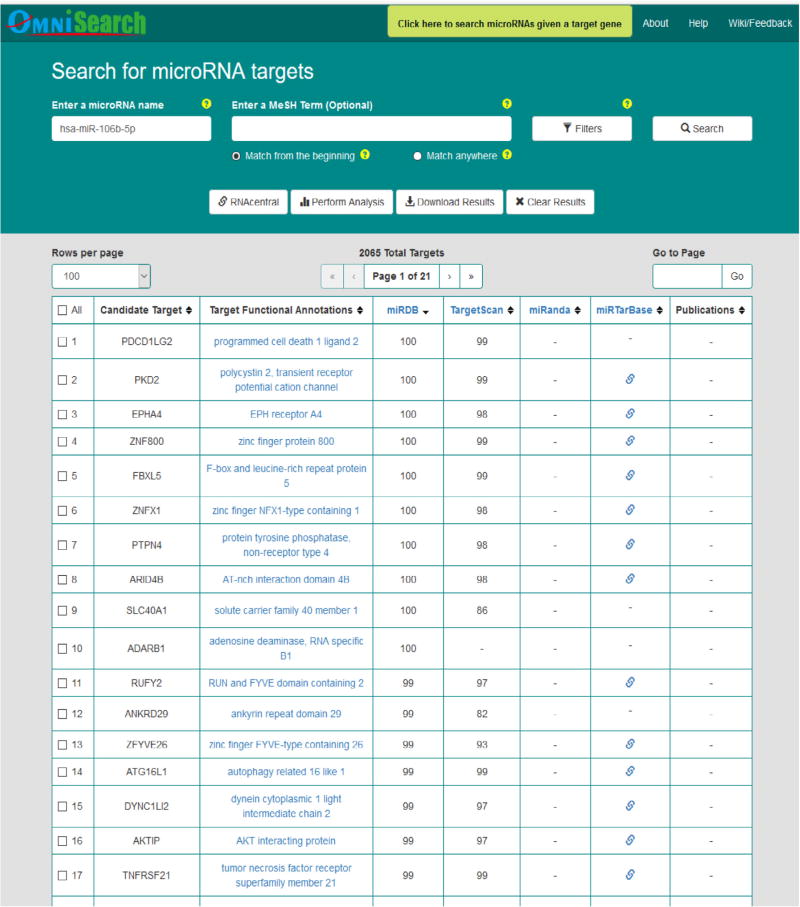
Figs. 5–7 demonstrate query search results from the friendly OmniSearch user interface for hsa-miR-223-3p, hsa-miR-106b-5p, and hsa-miR-103a-3p, respectively. Besides, using hsa-miR-223-3p as an example, Figs. 8 and 9 further exhibit additional data integrated in OmniSearch. Such comprehensive, federated knowledge provided us with additional clues to further screen candidate miRs. To be more specific: (1) hsa-miR-223-3p was estimated to be involved in the inflammatory reaction of vessel, angiogenesis, and platelet activation. (2) In addition, the relative expression of hsa-miR-223-3p was down-regulated in patients with CKD stages 4 and 5 compared to healthy controls. These extra clues enabled us to infer that hsa-miR-223-3p may be associated with the pathogenesis of diabetic nephropathy, thus serving as a candidate DKD biomarker. Consequently, we chose hsa-miR-223-3p for further validation and analysis.
Fig. 5.
Query search results for hsa-miR-223-3p in OmniSearch interface.
Fig. 7.
Query search results for hsa-miR-103a-3p in OmniSearch interface.
Fig. 8.
Other federated data for hsa-miR-223-3p.
Fig. 9.
Pathway analysis for hsa-miR-223-3p.
4.5. Real-time qPCR results
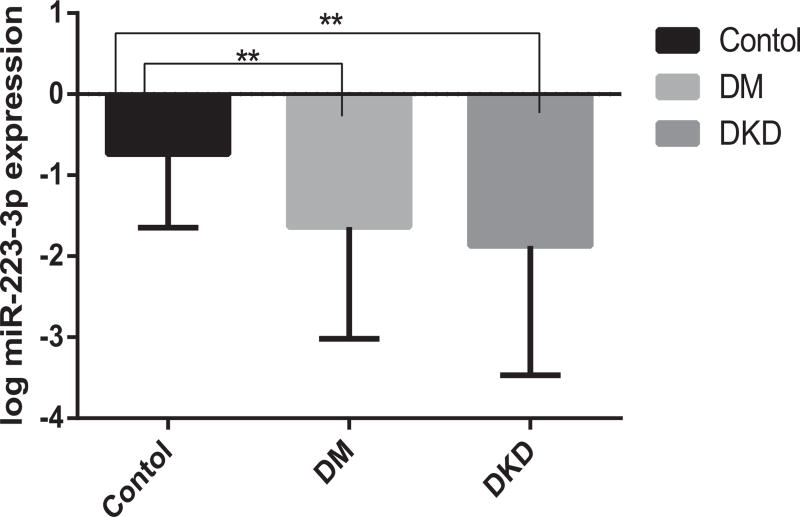
It is clearly demonstrated in Fig. 10 that, systemic expression levels of hsa-miR-223-3p were significantly reduced in DKD and DM patients compared with healthy controls, with the P values of 0.016 and 0.002, respectively.
Fig. 10.
Expression levels of has-miR-223-3p among three cohorts.
4.6. Statistical analysis results
Table 3 exhibits our statistical analysis results from linear regression model. There were statistically significant associations between has-miR-223-3p expression and DKD disease process. Associations that were statistically significant or showed a trend towards significance are highlighted in bold fonts in the table.
Table 3.
Dependent variables associated with DKD.
| [Unstandardized | Coefficients] | [Standardized | Coefficients] | ||
|---|---|---|---|---|---|
|
| |||||
| Dependent Variables | B | Std. Error | Beta | t | P Value |
| Constant | −.050 | .687 | −.073 | .942 | |
| eGFR | .008 | .003 | .322 | 2.393 | .022 |
| BMI | .066 | .022 | .415 | 3.084 | .004 |
| log miR-223 expression | −.144 | .046 | −402 | −3.108 | .004 |
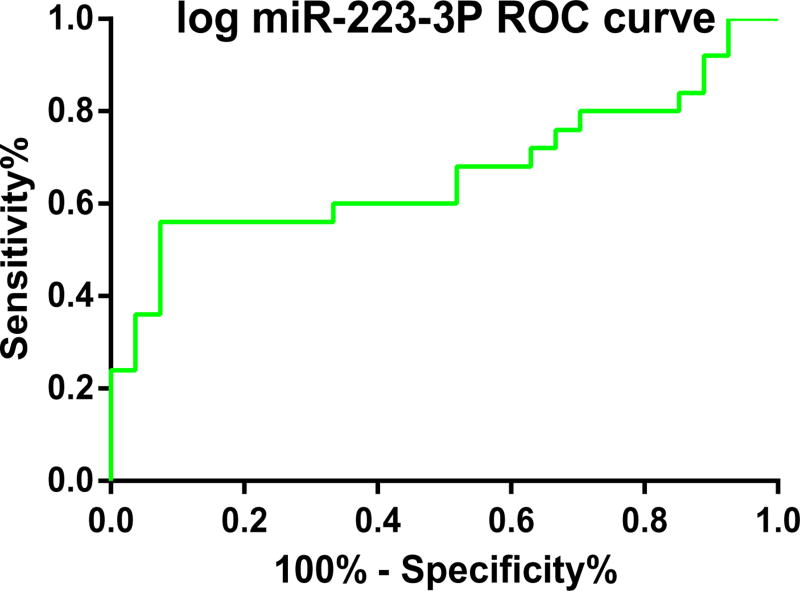
Additionally, we calculated the AUC of ROC curve for log has-miR-223-3p expression in SPSS 23.0, and the result was 0.760 (P = 0.001, 95% Confidence Interval = 0.626–0.894), as demonstrated in Fig. 11. This result along with those outcomes demonstrated in Table 3 (B = −0.144; Std. Error = 0.046; Beta = −0.402; t = −3.108; and P Value = 0.004) provided us with further evidence that, has-miR-223-3p has important regulation roles in DKD patients compared with healthy controls.
Fig. 11.
ROC curve for log hsa-miR-223-3p expression signature to discriminate DKD patients from health controls.
5. Conclusions
DKD is a disease causing major health problems worldwide. Not only there are no specific clinical manifestations during the early stage of DKD, but also more seriously, currently there exist no effective methods to prevent DKD patients from developing ESRD. There is an urgent need to discover novel biomarkers to facilitate the early diagnosis and effective treatment in DKD patients. It is then possible to intervene ESRD development in DKD patients. Towards this end, we need to better understand various regulation mechanisms at the genetic level in DKD disease process. In this paper, innovative methodologies are presented to integrate biological, computational, and statistical approaches to investigate miR-lncRNA-mRNA regulations in DKD. Based on our fully transparent methodologies, rigorous and reproducible experiment design, and robust and promising results, we have successfully discovered that hsa-miR-223-3p performs important roles in DKD disease process, thus serving as a candidate novel biomarker. This finding will further facilitate our understanding of various genetic regulation mechanisms on the pathogenesis and progression of DKD.
An immediate piece of future work along this line of research is, we will recruit more subjects and then apply our methodologies on a larger size of different cohorts. In particular, the DKD patients included in this paper are all early-stage ones (with ACR less than 300 mg/g). If we also recruit late-stage DKD patients in our future research, it is possible to obtain even more statistically significant associations between miRs and DKD process, as well as significantly different miR expression levels between DKD and DM patients.
Another interesting future work is for us to conduct a comparative study to further demonstrate the advantage of using our proposed methodologies by comparison with other state-of-the-art methods.
In the long run, we plan to conduct qPCR and statistical analysis on candidate lncRNAs. By combining lncRNA ROC with miR ROC, we might be able to discover additional novel biomarkers in DKD disease.
Fig. 6.
Query search results for hsa-miR-106b-5p in OmniSearch interface.
Acknowledgments
Research reported in this paper was partially supported by: The National Natural Science Foundation of China (NSFC, Regional Science Fund Project 81560126); 2016 Research Grant from Yunnan Health and Family Planning Commission (2016NS019); 2016 Research Grant from Yunnan Applied Basic Research Projects (2016FB127); 2015 Research Grant from Chengdu Medical College (CYZ15-08); The National Natural Science Foundation of China (NSFC), under Award Number 81660141; and the National Cancer Institute (NCI) of the National Institutes of Health (NIH), under the Award Number U01CA180982. The views contained in this paper are solely the responsibility of the authors and do not represent the official views, either expressed or implied, of these funding agencies or the China and U.S. Governments.
References
- 1.Shaw J, Sicree R, Zimmet P. Global estimates of the prevalence of diabetes for 2010 and 2030. Diabetes Res. Clin. Pract. 2010;87(1):4–14. doi: 10.1016/j.diabres.2009.10.007. [DOI] [PubMed] [Google Scholar]
- 2.Yang W, Lu J, Weng J, He J. Prevalence of diabetes among men and women in China. N. Engl. J. Med. 2010;362(12):1090–1101. doi: 10.1056/NEJMoa0908292. [DOI] [PubMed] [Google Scholar]
- 3.Xu Y, Wang L, He J, Ning G. Prevalence and control of diabetes in Chinese adults. JAMA. 2013;310(9):948–959. doi: 10.1001/jama.2013.168118. [DOI] [PubMed] [Google Scholar]
- 4.Fox C, Larson M, Leip E, Culleton B, Wilson P, Levy D. Predictors of new-onset kidney disease in a community-based population. JAMA. 2004;291(7):844–850. doi: 10.1001/jama.291.7.844. [DOI] [PubMed] [Google Scholar]
- 5.Li R, Chung A, Dong Y, Yang W, Zhong X, Lan H. The microRNA miR-433 promotes renal fibrosis by amplifying the TGF-beta/Smad3-Azin1 pathway. Kidney Int. 2013;84(6):1124–1129. doi: 10.1038/ki.2013.272. [DOI] [PubMed] [Google Scholar]
- 6.Zhong X, Chung A, Chen H, Dong Y, Lan H. miR-21 is a key therapeutic target for renal injury in a mouse model of type 2 diabetes. Diabetologia. 2013;56(3):663–674. doi: 10.1007/s00125-012-2804-x. [DOI] [PubMed] [Google Scholar]
- 7.Zhong X, Chung A, Chen H, Meng X, Lan H. Smad3-mediated upregulation of miR-21 promotes renal fibrosis. J. Am. Soc. Nephrol. 2011;22(9):1668–1681. doi: 10.1681/ASN.2010111168. [DOI] [PMC free article] [PubMed] [Google Scholar]
- 8.Chuang A, Huang X, Meng X, Lan HY. miR-192 mediates TGF-beta/Smad3-driven renal fibrosis. J. Am. Soc. Nephrol. 2010;21(8):1317–1325. doi: 10.1681/ASN.2010020134. [DOI] [PMC free article] [PubMed] [Google Scholar]
- 9.Qin W, Chuang A, Huang X, Lan H. TGF-beta/Smad3 signaling promotes renal fibrosis by inhibiting miR-29. J. Am. Soc. Nephrol. 2011;22(8):1462–1474. doi: 10.1681/ASN.2010121308. [DOI] [PMC free article] [PubMed] [Google Scholar]
- 10.Mercer T, Dinger M, Sunkin S, Mehler M, Mattick J. Specific expression of long noncoding RNAs in the mouse brain. Proc. Nat. Acad. Sci. U.S.A. 2008;105:716–721. doi: 10.1073/pnas.0706729105. [DOI] [PMC free article] [PubMed] [Google Scholar]
- 11.Ponting C, Oliver P, Reik W. Evolution and functions of long noncoding RNAs. Cell. 2009;136:629–641. doi: 10.1016/j.cell.2009.02.006. [DOI] [PubMed] [Google Scholar]
- 12.Bell G, Polonsky K. Diabetes mellitus and genetically programmed defects in beta-cell function. Nature. 2001;414:788–791. doi: 10.1038/414788a. [DOI] [PubMed] [Google Scholar]
- 13.Lango A, Flanagan S, Shaw-Smith C, Ellard S. GATA6 haploinsufficiency causes pancreatic agenesis in humans. Nat. Genet. 2012;44:20–22. doi: 10.1038/ng.1035. [DOI] [PMC free article] [PubMed] [Google Scholar]
- 14.Moran I, Akerman I, Xie R. Human beta cell transcriptome analysis uncovers LncRNAs expressed in type 2 diabetes. Cell. 2012;16(4):435–448. doi: 10.1016/j.cmet.2012.08.010. [DOI] [PMC free article] [PubMed] [Google Scholar]
- 15.Wilusz J, Freier S, Spector D. 3’ end processing of a long nuclear-retained noncoding RNA yields a tRNA-like cytoplasmic RNA. Cell. 2008;135:919–932. doi: 10.1016/j.cell.2008.10.012. [DOI] [PMC free article] [PubMed] [Google Scholar]
- 16.Ashburner M, Ball C, Blake J, Botstein D, Butler H, Cherry J, Davis A, Dolinski K, Dwight S, Eppig J, Harris M, Hill D, Issel-Tarver L, Kasarskis A, Lewis S, Matese J, Richardson J, Ringwald M, Rubin G, Sherlock G. Gene ontology: tool for the unification of biology, The Gene Ontology Consortium. Nat Genet. 2000;25(1):25–29. doi: 10.1038/75556. [DOI] [PMC free article] [PubMed] [Google Scholar]
- 17.Huang J, Eilbeck K, Smith B, Blake J, Dou D, Huang W, Natale D, Ruttenberg A, Huan J, Zimmermann M, Jiang G, Lin Y, Wu B, Strachan H, de Silva N, Kasukurthi M, Jha V, He Y, Zhang S, Wang X, Liu Z, Borchert G, Tan M. The Development of Non-Coding RNA Ontology. Int. J. Data Mining Bioinf. 2016;15(3):214–232. doi: 10.1504/IJDMB.2016.077072. [DOI] [PMC free article] [PubMed] [Google Scholar]
- 18.Huang J, Eilbeck K, Smith B, Blake J, Dou D, Huang W, Natale D, Ruttenberg A, Huan J, Zimmermann M, Jiang G, Lin Y, Wu B, Strachan H, He Y, Zhang S, Wang X, Liu Z, Borchert G, Tan M. The Non-Coding RNA Ontology (NCRO): a comprehensive resource for the unification of non-coding RNA biology. J. Biomed. Semantics. 2016;7(24) doi: 10.1186/s13326-016-0066-0. [DOI] [PMC free article] [PubMed] [Google Scholar]
- 19.OBO Library. URL http://obofoundry.org.
- 20.Huang J, Dang J, Lu X, Dou D, Blake J, Gerthoffer W, Tan M. An Ontology-Based MicroRNA Knowledge Sharing and Acquisition Framework. Proc. BHI Workshop at 2012 IEEE International Conference on Bioinformatics and Biomedicine (BIBM-2012) 2012:16–23. [Google Scholar]
- 21.Huang J, Dang J, Borchert G, Eilbeck K, Zhang H, Xiong M, Jiang W, Wu H, Blake J, Natale D, Tan M. OMIT: dynamic, semi-automated ontology development for the microRNA domain. PLOS ONE. 2014;9(7) doi: 10.1371/journal.pone.0100855. [DOI] [PMC free article] [PubMed] [Google Scholar]
- 22.Huang J, Gutierrez F, Strachan H, Dou D, Huang W, Smith B, Blake J, Eilbeck K, Natale D, Lin Y, Wu B, de Silva N, Wang X, Liu Z, Borchert G, Tan M, Ruttenberg A. OmniSearch: a semantic search system based on the Ontology for MIcroRNA Target (OMIT) for microRNA-target gene interaction data. J. Biomed. Semantics. 2016;7(25) doi: 10.1186/s13326-016-0064-2. [DOI] [PMC free article] [PubMed] [Google Scholar]
- 23.Dou D, Wang H, Liu H. Semantic Data Mining: A Survey of Ontology-based Approaches; Proc. IEEE International Conference on Semantic Computing; 2015. pp. 244–251. [Google Scholar]
- 24.Premerlani W, Blaha M. An approach for reverse engineering of relational databases. Commun. ACM J. 1994;37(5):42–49. [Google Scholar]
- 25.Stojanovic L, Stojanovic N, Volz R. Migrating data-intensive web sites into the Semantic Web; Proc. ACM symposium on Applied computing; 2002. pp. 1100–1107. [Google Scholar]
- 26.Verheyden P, Bo J, Meersman R. Semantically unlocking database content through ontology-based mediation; Proc. SWDB 2004; 2004. pp. 109–126. [Google Scholar]
- 27.Lubyte L, Tessaris S. Extracting ontologies from relational databases; Proc. 2007 Description Logics; 2007. pp. 122–126. [Google Scholar]
- 28.Chauhan R, Gouda R, Sharma R, Chauhan A. Domain ontology based semantic search for efficient information retrieval through automatic query expansion; Proc. 2013 International Conference on Intelligent Systems and Signal Processing; 2013. pp. 397–402. [Google Scholar]
- 29.Hanley J, McNeil B. The meaning and use of the area under a receiver operating characteristic (ROC) curve. Radiology. 1982;143(1):29–36. doi: 10.1148/radiology.143.1.7063747. [DOI] [PubMed] [Google Scholar]
- 30.Swets J. Indices of discrimination or diagnostic accuracy: their ROCs and implied models. Psychol. Bull. 1986;99(1):100–117. [PubMed] [Google Scholar]
- 31.Allison DB, Paultre F, Maggio C, Mezzitis N, Pi-Sunyer FX. The use of areas under curves in diabetes research. Diabetes Care. 1995;18(2):245–250. doi: 10.2337/diacare.18.2.245. [DOI] [PubMed] [Google Scholar]
- 32.Nathan D, Kuenen J, Borg R, Zheng H, Schoenfeld D, Heine RJ. Translating the A1C assay into estimated average glucose values. Diabetes Care. 2008;31(8):1473–1478. doi: 10.2337/dc08-0545. [DOI] [PMC free article] [PubMed] [Google Scholar]
- 33.Ku G, Kegels G. The performance of the finnish diabetes risk score, a modified finnish diabetes risk score and a simplified finnish diabetes risk score in community-based cross-sectional screening of undiagnosed type 2 diabetes in the philippines. Primary Care Diabetes. 2013;7(4):249–259. doi: 10.1016/j.pcd.2013.07.004. [DOI] [PubMed] [Google Scholar]
- 34.Stiglic G, Pajnkihar M. Evaluation of major online diabetes risk calculators and computerized predictive models. PLOS ONE. 2015;10(11) doi: 10.1371/journal.pone.0142827. [DOI] [PMC free article] [PubMed] [Google Scholar]
- 35.Jones A, Lonergan M, Henley WE, Pearson ER, Hattersley AT, Shields BM. Should studies of diabetes treatment stratification correct for baseline HbA1c? PLOS ONE. 2016;11(4) doi: 10.1371/journal.pone.0152428. [DOI] [PMC free article] [PubMed] [Google Scholar]
- 36.Chu L, Scharf E, Kondo T. GeneSpring: tools for analyzing microarray expression data. Genome Inf. 2001;12:227–229. [Google Scholar]
- 37.igraph Package. URL http://igraph.org/redirect.html.
- 38.Huang J, Gutierrez F, Dou D, Blake J, Eilbeck K, Natale D, Smith B, Lin Y, Wang X, Liu Z, Tan M, Ruttenberg A. A semantic approach for knowledge capture of microRNA-target gene interactions; Proc. BHI Workshop at 2015 IEEE International Conference on Bioinformatics and Biomedicine (BIBM-2015); 2015. pp. 975–982. [Google Scholar]
- 39.OmniSearch. URL http://omnisearch.soc.southalabama.edu/ui/
- 40.miRDB. URL http://mirdb.org/miRDB/
- 41.TargetScan. URL http://www.targetscan.org.
- 42.miRanda. http://www.microrna.org.
- 43.miRTarBase. URL http://mirtarbase.mbc.nctu.edu.tw/


