Abstract
Highly differentiated brain structures with distinctly different phenotypes are closely correlated with the unique combination of gene expression patterns. Using a genome-wide in situ hybridization image dataset released by Allen Mouse Brain Atlas, we present a data-driven method of dictionary learning and sparse coding. Our results show that sparse coding can elucidate patterns of transcriptome organization of mouse brain. A collection of components obtained from sparse coding display robust region-specific molecular signatures corresponding to the canonical neuroanatomical subdivisions including fiber tracts and ventricular systems. Other components revealed finer anatomical delineation of domains previously considered homogeneous. We also build an open-access informatics portal that contains the detail of each component along with its ontology and expressed genes. This portal allows intuitive visualization, interpretation and explorations of the transcriptome architecture of a mouse brain.
Keywords: sparse coding, data-driven gene clustering, transcriptome, mouse brain anatomy
1 Introduction
Highly differentiated brain structures with distinctly different phenotypes are closely correlated with the unique combination of gene expression patterns (Jiang et al. 2001; Mody et al. 2001). Many studies have reported that transcriptomes can serve as important, informative modalities to classify cell types and reveal deeper organization of brain structures (Heintz 2004; Nelson et al. 2006; Winden et al. 2009; Hawrylycz et al. 2010). A number of molecular markers, such as calcium-binding proteins and growth factors, were found to show distinct patterns that can be utilized to distinguish between field CA1 and field CA3 in adult mouse and rat brains (Woodhams et al. 1993). Tole et al (Tole et al. 1997) further discovered that two field-specific genes display unique patterns distinguishable between CA1 and CA3 a week before the distinctions in morphology are displayed. Later, with the improvement of DNA microarray and in situ hybridization (ISH), a large number of gene expression patterns were reported to mirror the gross anatomical partitioning in hippocampus and some subregion-specific gene expression patterns can delineate the brain into finer subdivisions (Zhao et al. 2001; Lein et al. 2004). As the current preeminent methodology in transcriptomics, the explorative single-cell RNA sequencing (RNA-seq) (Mortazavi et al. 2008) showed its power by classifying cells in the mouse somatosensory cortex and hippocampal CA1 region into 47 subclasses (Zeisel et al. 2015). These results, together with many others (Heintz 2004; Molyneaux et al. 2007; Belgard et al. 2011), provide strong evidence that gene expression patterns are useful features in revealing the cellular makeup of different brain regions.
Led by the exciting discoveries revealed by gene expression studies, a global systematic study on a wide range of cellular markers with fine resolutions is essential to make quantitative associations between genetic and anatomical architecture of the entire brain. One enormous effort is the openly available Allen Mouse Brain Atlas (AMBA) (Lein et al. 2007), which provides genome-wide in situ hybridization (ISH) image series of the adult mouse brain at cellular resolution. To investigate the differences between the “transcriptome fingerprints” of different brain locations, ISH image series for each mRNA is registered to a common atlas space, the Allen Reference Atlas (ARA) (Dong 2008) so that a global comparison across regions and against the classical neuroanatomy is possible. (Thompson et al. 2008; Ng et al. 2009; Hawrylycz et al. 2010).
Multiple tools and methods have been developed for mining the ISH dataset. The Anatomic Gene Expression Atlas (AGEA) (Ng et al. 2009), for instance, is a publicly available computational tool specifically designed to visualize the spatial correlations of gene expression patterns in the mouse brain. In AGEA, gene expression patterns are seen as features of each voxel and Pearson correlation metric is used to measure the similarity between voxels. Based on the calculated similarity, a hierarchical clustering was applied to parcellate apparent anatomical subdivision. Yet the tool requires regions defined for enrichment a-priori. On the other hand, Bolhand and colleagues (Bohland et al. 2010) have shown that singular value decomposition (SVD) was able to reveal structures in rough concordance with classical anatomy, yet finer structures were not resolved and an extra step of K-means clustering was required to clusters voxels with similar gene expression profiles. Relatedly, a modified non-negative matrix Factorization (mNMF), was also used to study ~2600 genes expressed in hippocampus and led to the identification of a large groups of regionally enriched transcripts (Thompson et al. 2008).
Inspired by the above promising findings, we proposed to apply dictionary learning and sparse coding (DLSC) on genomic data. DLSC is a data-driven method aiming at obtaining parsimonious representation of data. The popularity of applying DLSC on images derived from the observations that neurons encode sensory information using a small number of active neurons at any given point in time (Olshausen & Field, 2004). It is reported that sparsification can “weed out” those basis functions not needed to describe a given image structure, thus obtaining an easier interpretation (Olshausen & Field, 2004). Due to these properties, DLSC has found great success in applications such as image denoising, demosaicing and inpainting (Elad and Aharon 2006; Mairal et al. 2008). In the context of revealing the transcriptome organization based on gene expression profiles, we assume that if multiple voxels use the same dictionary atom for sparse representation, then these voxels must share the features described by the shared dictionary atom and thereby should belong to the same subregion. On the other hand, it is reported that most genes are expressed in a fairly small percentage of cells (70.5% of genes are expressed in less than 20% of total cells in the ISH dataset) (Lein et al. 2007). We assume this notion can be captured by imposing a sparsity constraint that limits the number of voxels that a gene can be active on. Thus, DLSC can serve as a useful tool that learns the internal transcriptome architecture from the ISH dataset without any prior knowledge.
In this study, we performed a comprehensive analysis on the genome-wide in situ hybridization data of the mouse brain and showed that DLSC can effectively elucidate patterns of transcriptome organization. A number of components obtained from sparse coding display robust regional specific molecular signatures corresponding to the canonical neuroanatomical subdivisions. Other components revealed finer anatomical delineation of domains previously considered homogeneous. An informatics portal was built as an open-access resource for result visualization and further explorations. The webpages contain the spatial distribution of the components and the corresponding ARA ontology of neuroanatomical structures, as well as the genes that are regionally enriched. The links to the original dataset affords a direct comparison and a convenient interpretation.
2 Methods
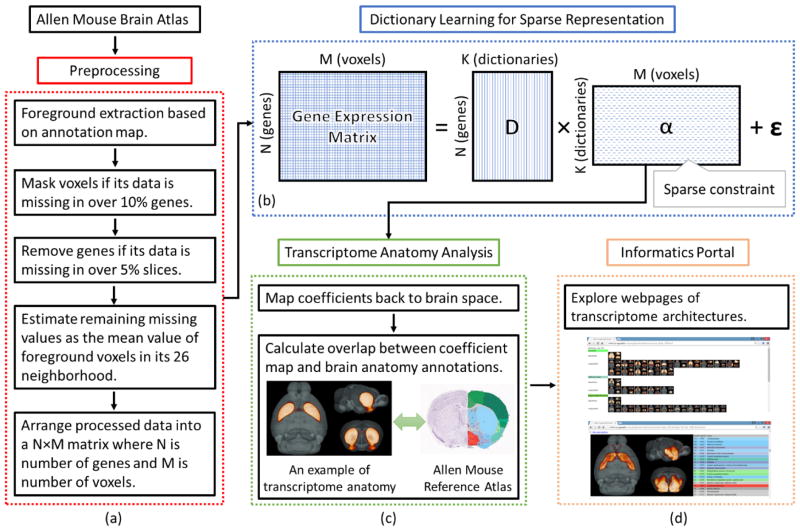
The computational pipeline is outlined as follows (Figure 1). First, images of gene expression patterns were downloaded from AMBA dataset (Lein et al. 2007). Based on the corresponding annotation map, foreground voxels were extracted for analysis. Those voxels with missing data were either excluded from analysis or estimated from the neighboring voxels (Figure 1(a)). Then the 3D expression energies for one gene were flattened out into one line so that all gene expression data can be arranged into a big matrix where each row corresponds to one gene and each column corresponds to one voxel. The matrix was next decomposed into a fixed number of dictionaries and its corresponding coefficient matrix (Figure 1(b)). Due to the sparse constraints on the energy function, the coefficient matrix is sparse and encodes the spatial distribution of each dictionary. Finally, we compared the spatial patterns of the learned dictionary components with the manual annotation atlas from ARA (Figure 1(c)). An informatics portal was built to present the whole mouse brain’s transcriptome architecture (Figure 1(d)).
Figure 1.
Computational pipeline of the proposed method. (a) Preprocessing steps for ISH data from Allen Mouse Brain Atlas. (b) Dictionary learning and sparse coding of ISH matrix. (c) Comparisons between transcriptome spatial patterns with the neuroanatomy. (d) Informatics portal to facilitate the exploration of transcriptome architecture.
2.1 In situ hybridization Data
The AMBA (Lein et al. 2007) provides genome-wide in situ hybridization (ISH) image data for approximately 20,000 genes in 56–day-old male C57Bl/6J mouse brain. Processed brain tissues were first cut into slices and a set of 2-dimensional (2-D) ISH images were generated for each transcript tested. So far, ISH images of 4,345 transcripts were acquired on coronal sections. These ISH images were then processed in an informatics pipeline to obtain a 3-dimensional (3-D) expression grids for each examined gene. In brief, image series were reconstructed into a 3D volume. Then each ISH image was registered to a common atlas space ARA. To enable quantification, each image was divided into a 200 μm isotropic grid and pixel-based statistics were collected. Eventually, the output was a 3-D summary of the gene expression statistics for each transcript. In the paper, expression energy metric was used for all analyses. As seen in equation (1–3), this metric is correlated with total transcript count incorporating both area occupied by expressing pixels as well as pixel intensity.
| (1) |
| (2) |
| (3) |
We downloaded the 4,345 3-D volumes of expression energy of coronal sections from the website of ABA (http://mouse.brain-map.org/) to perform our analysis. Coronal sections are chosen because they registered more accurately to the reference model than the counterparts of sagittal sections. A 3-D volume of brain anatomical annotation based on the ARA (Version 3) was also downloaded. The dimension of all 3-D volume is 67 (posterior-anterior) by 41(inferior-superior) and by 58 (right-left).
2.2 Data Preprocessing
Based on the 3-D annotation, a mask of brain volume was generated and applied to extract foreground voxels (62529 voxels). By observation, data were missing for many foreground voxels (−1 in expression energy). The lack of data was assumed mostly due to problems during data acquisition such as missing slices, broken tissues, and slice misalignment. Mainly the missing data were categorized into three groups: 1) An entire slice was lost; 2) Part of a slice was lost; 3) A few voxels were missing. To reduce the impact of missing data, two filtering steps and an estimation step were performed at the preprocessing stage. First, a filtering step was applied to mask out “unreliable” voxels. A foreground voxel with gene expressions missing in over 10% of the total transcripts was removed. In this step, about 7% of foreground voxels were eliminated. Second, a filtering step was applied to filter out “unreliable” transcripts. A transcript with expressions missing for an entire slice was excluded. After this step, 67% (2905/4345) transcripts were retained for further analysis. Most missing values were resolved in the two filtering steps. The remaining missing values were estimated as the mean of foreground voxels in its 26 neighborhood. Recursive mean calculations were performed on the images until all missing values were filled. Eventually, 2905 transcripts on 60904 foreground voxels were sent to the DLSC module.
2.3 Dictionary Learning and Sparse Coding
Dictionary learning and sparse coding is a useful tool that can extract meaningful patterns from signals. Given a matrix X ∈ ℝN×M, it can be approximated by the matrix factorization such that:
| (4) |
where D ∈ ℝN×K is the dictionary matrix, α ∈ ℝK×M is the corresponding coefficient matrix, and ε ∈ ℝN×M is the reconstruction error. This matrix decomposition problem is solved with a sparse constraint on α, which limits the number of dictionaries used to reconstruct the original signals. The factorization can be formulated as the following optimization problem:
| (5) |
where ||*||2 is the summation of ℓ2 norm of each column and ||*||1 is the summation of ℓ1 norm of each column. λ regulates the tradeoff between the sparsity of α and the reconstruction error.
The optimization problem is solved by an alternating minimization procedure through lasso and least-square steps that iteratively updates to improve the estimate of the sparse codes while keeping the dictionaries fixed and then updating dictionaries that fit the sparse codes best. At all times, the energy function in equation (5) should be minimized (Mairal et al. 2010).
In practice, we arranged the gene expression energies into a single matrix X ∈ ℝN×M, such that N rows correspond to N genes and M columns correspond to M foreground voxels. Then, each column of the matrix was centered and then normalized by the standard deviation of the elements in each column. After normalization, the publicly available online dictionary learning and sparse coding package was applied to solve the matrix factorization problem proposed in equation (5) (Mairal et al. 2010). Eventually, the gene expression energy matrix X was decomposed into a dictionary matrix D and a sparse coefficient matrix α. Further explanations on the matrix factorization step can be found in supplementary material.
The key idea of applying sparse coding to the ISH dataset is that if multiple voxels use the same dictionary atom for sparse representation, then these voxels share the features described by the shared dictionary atom and thereby should form a subregion. The major assumptions of applying sparse coding to the ISH data is that each gene is expressed in a limited number of voxels in the brain. This assumption is supported by the fact that most genes are expressed in a fairly small percentage of cells (70.5% of genes are expressed in less than 20% of total cells in the ISH dataset) (Lein et al. 2007). The other assumption is that the gene expression energies can be linearly combined because in DLSC each dictionary is a linear combination of gene expressions. If the integration of two gene expression follows a non-linear relationship, DLSC would not be able to reconstruct the original signals correctly. The similarities between the reconstructions and the raw signals validate that this assumption holds here.
The degree of sparsity of α is controlled by the regularization parameter λ. Too large of a λ will result in very sparse networks, potentially losing important patterns, while a small λ will introduce more irrelevant features into the results. In addition to λ, the number of dictionaries can also impact the sparsity of α and the decomposition accuracy. As no gold standard exists for parameter selection, we proposed three criteria, the reconstruction error, the density of α matrix and the mutual information with the reference atlas, to evaluate the performance of DLSC and then carried out a grid search on the optimized parameters (Supplementary materials). λ=1.5 was selected and different dictionary sizes were tested fixing the λ. By visual check, the parameter combinations resulted in meaningful brain delineations.
3 Results
3.1 Transcriptomic Anatomy
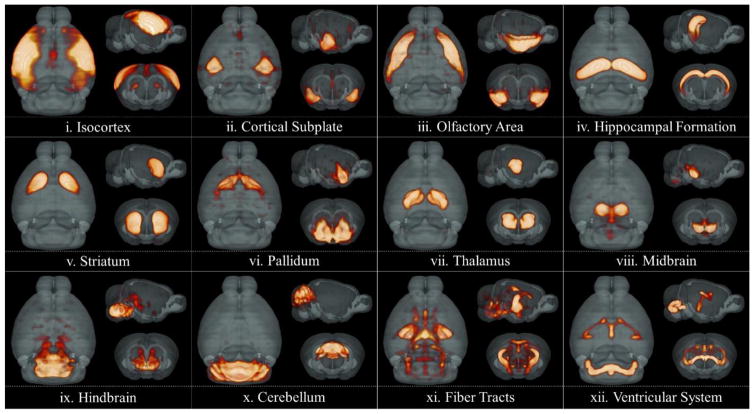
Based on the method proposed, gene expression energy signals of a whole mouse brain were decomposed into multiple components. After mapping the coefficient matrix back to 3D volume space, different spatial patterns were observed for different dictionary atoms. A visual inspection showed that voxels with high coefficients smoothly distributed in 3D space and forms tight clusters. The formed clusters correspond to various canonical anatomical regions spanning the entire brain - ranging from isocortex, olfactory area, striatum to thalamus, midbrain and cerebellum etc., conceptually validating sparse coding as a useful data-driven approach to extract region-specific gene signatures from transcriptome and obtain meaningful brain divisions (Figure 2). This clustering patterning agrees with the brain’s organizational principle that transcriptome similarities are strongest between spatial neighbors, both between cortical areas and between cortical layers (Bernard et al. 2012), which has been seen in a range of methods including unsupervised hierarchical clustering, analysis of variance (ANOVA) and etc. Interestingly, multiple white fiber pathways, as well as the ventricular system, were also extracted by DLSC.
Figure 2.
Visualization of selected 3D spatial maps of the coefficient matrix. Results were obtained using 200 dictionaries. 12 dictionaries corresponding to 12 major canonical regions were selected.
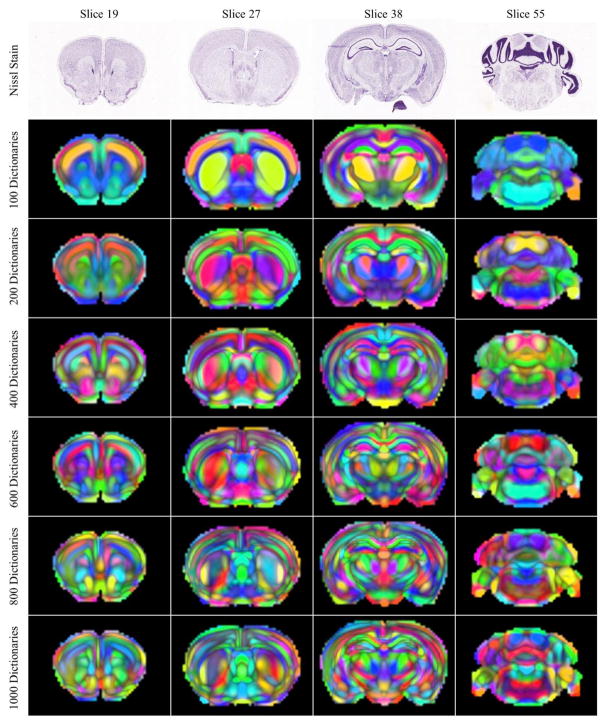
Different numbers of dictionaries (100, 200, 400, 600, 800, and 1000) were tested for matrix decomposition. Intuitively, larger numbers of dictionaries would be expected to result in finer parcellation of the mouse brain. It should be noted that when the dictionary number is set to 200 or below, the gene expression based laminar structures are not obvious. With a growing number of dictionaries, the coarsely parcellated subcortical areas were further parcellated into subregions and more details of layered and laminar architectures of neocortex were observed.
3.1.1 Hippocampal formation
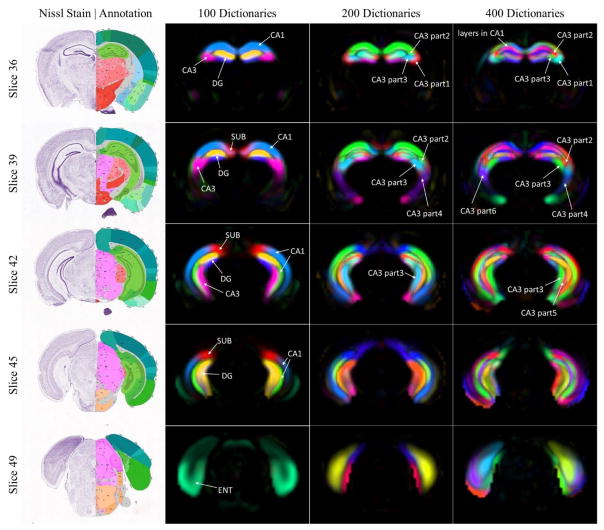
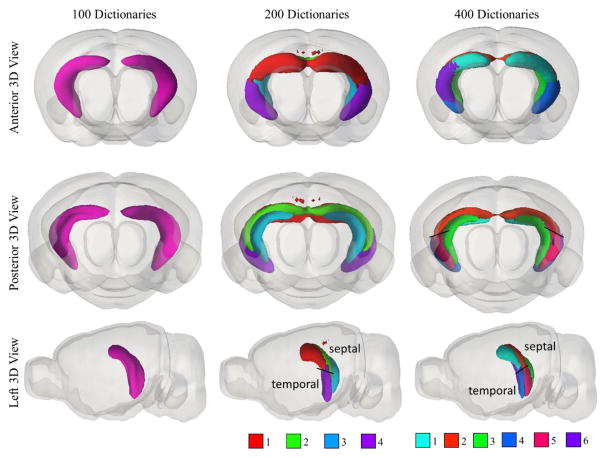
To show as an example, we analyzed the hippocampus-related components. The components obtained from 100, 200 and 400 dictionaries were identified by overlapping measurement with ARA (Figure 4). With 100 dictionaries, the proposed method successfully separated major anatomical structures in hippocampus including field CA1, field CA3, dentate gyrus (DG), subiculum (SUB), and entorhinal area (ENT). With more dictionaries, layered structures of these regions gradually emerge. Specifically, as shown in Figure 5, field CA3 was identified as a complete piece when 100 dictionaries were used. When 200 dictionaries were used, field CA3 was decomposed into 4 sub-components including 2 frontal components and 2 posterior components. When 400 dictionaries were used, 6 finer components related to field CA 3 were identified. For the lateral components, field CA3 was completely separated into septal and temporal parts as highlighted in Figure 5. These components might be associated the various pyramidal neurons that send and receive signals with other parts of the hippocampus and reflect the distribution of intrahippocampal projections (Ishizuka et al. 1990). A non-symmetric component was shown on the right hemisphere only. Having examined the ISH images, the unilateral component was a result of artefacts during image acquisition and preprocessing (Supplementary material Figure S1).
Figure 4.
Hippocampal formation related dictionaryies obtained from different dictionary numbers (100, 200, 400). A random color was chosen for each dictionary and the intensity is scaled by dictionary coefficients. Here 5 coronal planes of sections were selected for visualization and the corresponding Nissl stained image as well as anatomical annotation downloaded from ARA were shown on the left.
Figure 5.
3D renderings of spatial pattern of field CA3 related components obtained using different dictionary numbers. The color scheme of each region is listed at the bottom of subfigure and is the same as Figure 4.
3.1.2 Fiber tracts and ventricular system
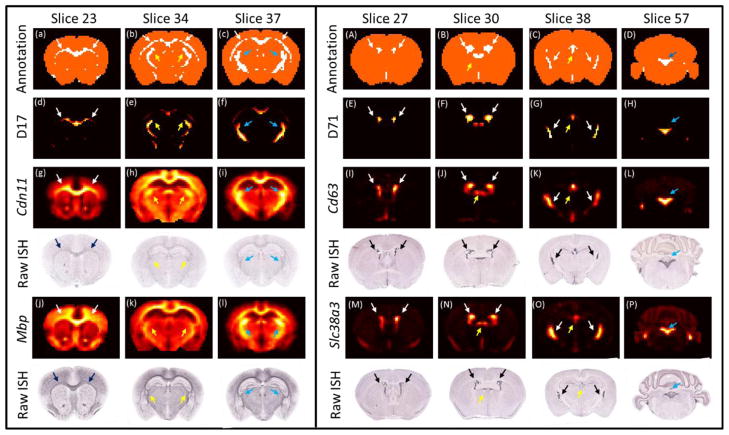
One of the most interesting findings is that the DLSC can extract expression patterns that correspond to fiber tracts and ventricular system. One example is dictionary 17 that corresponds to the white matter pathways. Specifically, the fiber tracts observed here are mainly corpus callosum (Figure 6a–c white arrows), internal capsule (Figure 6b yellow arrows) and fimbria (Figure 6c blue arrows). Even though the signals at other regions are relatively strong, the distinctly high expressions at corpus callosum and internal capsules agree well with the reference atlas for fiber tracts. Many transcripts that showed enhanced signals at these regions are also markers for oligodendrocyte (Cahoy et al. 2004). The two presented transcripts Mbp, Cdn11 encode myelin basic proteins (Figure 6g–i, j–l). Other transcripts that heavily use the dictionary for representation such as Plp1 and Cnp are also related to myelination, which is a featured function for oligodendrocyte. The increased myelin level is presumed the reason for the enhanced signals in white matter in comparison with other regions because it is known that oligodendrocytes produces myelin membranes in the white matter. Another example is Dictionary 71, which features enhanced expressions at lateral ventricle (Figure 6A–C white arrows), third (Figure 6B–C yellow arrows) and fourth ventricles (Figure 6C blue arrows). As seen in Figure 6, both transcripts Cd63 and Slc38a3 showed prominent signals at these regions (Figure 6 I–P), corroborating the spatial map of dictionary 71. Notably, both transcripts are markers for astrocyte (Cahoy et al., 2004; Ng et al., 2009). The significantly high expressions at the ventricles is reminiscent of that the subventricular zone is rich with astrocytes ((Quinones-Hinojosa and Chaichana, 2007)). The abundance of astrocytes is likely the reason for the enriched expression at ventricular regions. The above two examples demonstrate that DLSC can extract expression patterns that are restricted to white matter and ventricular systems possibly via cell-type markers that are enriched at these regions.
Figure 6.
Slice-based views of the spatial distribution of components that correspond to the fiber tracts (dictionary 17) and ventricular system (dictionary 71). Each column is a different slice. First row are the reference atlases for fiber tracts (left) and ventricular system (right). Second row are the spatial distribution of the components. Third and fifth rows are the normalized energy expression of selected genes. Fourth and sixth rows are the raw ISH data for the selected genes. Gene acronyms are on the left of ISH images.
3.2 Comparative analysis with principal component analysis (PCA) and independent component analysis (ICA)
To benchmark with the alternative matrix factorization methods, we performed PCA and ICA on the same gene expression matrix. For PCA, data was first centered and then whitened. Singular value decomposition algorithm was used as the solver. To visualize the spatial distributions, we projected each individual mode back to the brain space (Supplementary material Figure S3). The top four modes account for over 80% of variance. The first two modes have a very broad distribution across the brain. The third mode is also broadly distributed with enhanced specificity for the cerebellum, and the fourth mode is particularly prominent in the striatum and CA3. For modes that account for less variance, the spatial distributions span the entire brain and the agreement to the anatomy is less obvious. In summary, the first few modes contain spatial structures in rough concordance with classical anatomy. However, it is also apparent that finer structure cannot be revealed by PCA.
A comparison with the results from the application of ICA also confirmed that DLSC is a better fit in the context of deriving the transcriptome organizations. The basic goal of ICA is to determine a transformation so that the transformed components are statistically as independent from each other as possible. The goal is realized by finding a direction that maximizes the negentropy (Comon 1994). Therefore, ICA requires a strong assumption that the components are independent. In comparison, DLSC minimizes the total loss of reconstruction error and the ℓ1 penalty of the coefficient matrix, without imposing assumptions on the relationship between components. To ensure a fair comparison, 100 components were generated using ICA. The algorithm used was FastICA (Hyvärinen 1999). Spatial maps were obtained by projecting the coefficient matrix to the brain space and then classified into 10 major brain regions (Supplementary material Figure S4). The biggest difference observed between DLSC and ICA is that DSLC was able to produce components that cover most part of major anatomical brain regions including thalamus, striatum, midbrain, olfactory area etc. (Figure 2). In comparison, almost all components generated by ICA were in concordance with only a small portion of the major brain regions. Such example components were seen in thalamus, hindbrain, midbrain, cerebellum etc. A few exceptions were ventricular system, field CA3, field CA1 and dentate gyrus. The lack of components that correspond to the complete brain regions is probably a result of unsupported assumptions. ICA assumes the components to be independent and solves the matrix factorization by maximizing the statistical independence of the estimated components. However, it is likely that two genes are regulated by the same transcription factors and thereby their expressions are dependent. In comparison, the assumption of DLSC is the sparsity of the coefficient matrix and supported by that 70% genes are expressed in a limited number of cells. The advantage of sparse coding over ICA has also been demonstrated in other data modality such as functional magnetic resonance imaging (Lv et al. 2015).
3.3 Online Informatics Portal For Further Explorations
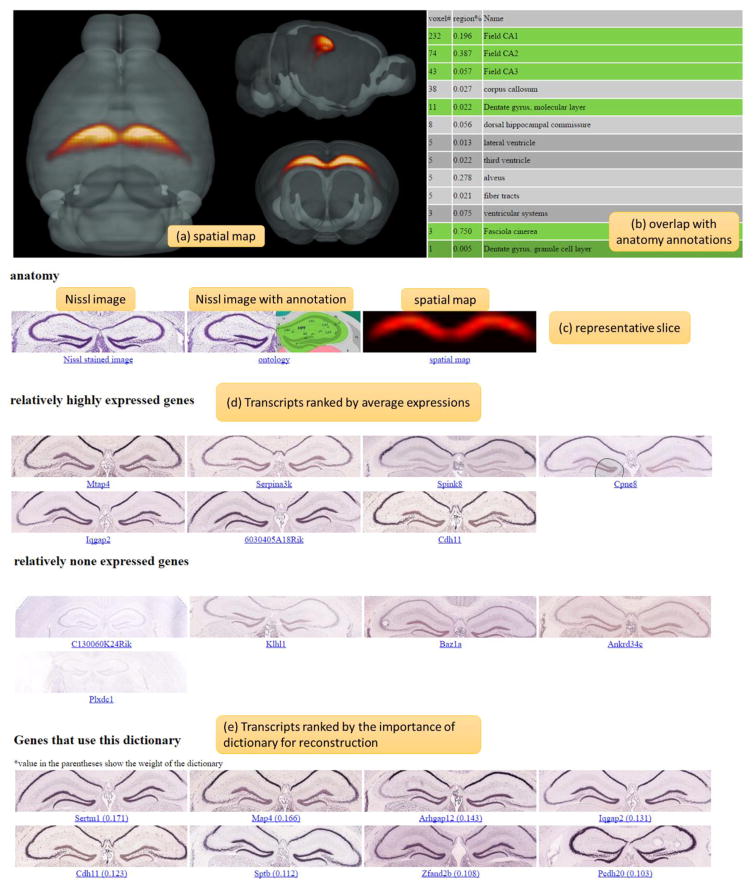
To allow other researchers to explore the comprehensive transcriptome architecture identified by the proposed framework, all the information was organized into web pages and can be easily accessed at: http://mbm.cs.uga.edu/mouse/transcriptome_architecture. To facilitate the exploration of components, the portal provides two main ways to view the transcriptome architecture - by dictionary number and by anatomical brain regions. Altogether, there are 6 levels of brain delineations with the dictionary number varying from 100, 200 to 1000 and 13 canonical brain divisions. For each component, there is a webpage showing both the anatomical and genomic information (Figure 7). As to the anatomical information, in addition to the selected Nissl stained image and its ontology that afford the context for interpretation, a 3D spatial map corresponding to its coefficient matrix (Figure 7(a)) was visualized. To quantify the composition of the obtained component, the percentage of the overlapping volume between the component and ARA was calculated. The top 20 regions along with the number of voxels occupied by the component and the overlap percentage were tabulated (Figure 7(b)). Each of the obtained components can be downloaded as a zip file for further investigation. With respect to the genetic information, the regionally enriched and restricted transcripts were retrieved and the related ISH raw data were shown alongside, offering a direct link to the original data in the database. For the convenience of comparison, we only visualized the slice with the highest expressions of the component (Figure 7(c)). The differentially expressed transcripts were not determined from the absolute expression levels, but ranked by the average expression energy within each component weighted by the dictionary coefficients. Transcripts with the top two highest (lowest) expression energies in a specific components were taken as a relatively expressed (non-expressed) gene in this component. In addition to the differentially expressed transcripts, we also included the transcripts that heavily used the dictionary for signal reconstructions (Figure 7e). To evaluate the importance of a dictionary for a particular transcript, we first calculated the error changes in reconstructions of each transcript after removing this particular dictionary and then weighted the changes by the ℓ2 norm of the raw signals because transcripts with higher signals overall tend to use more dictionaries for representation. The obtained scores were the indicator of the importance of this particular dictionary for each transcript. Accompanying the above-mentioned two ways to examine the components, a slice-by-slice view (Figure 3) was also enabled for comparisons on each slice between the components obtained from different dictionary numbers.
Figure 7.
Illustration of anatomic and genetic information of a dictionary component on the informatics portal. (a) 3D spatial map of the component. (b) The 20 regions that showed the highest overlaps with the spatial distribution of the component. (c) Nissl stained image, reference atlas and spatial distribution of the coronal slice that showed major expressions. (d) ISH raw images of transcripts that showed high and low expressions regionally. (e) ISH raw images of transcripts that use the dictionary for signal reconstructions.
Figure 3.
A comparison of transcriptome anatomy obtained for different dictionary numbers. A random color was chosen for each dictionary and the intensity was scaled by dictionary coefficients. 4 coronal slices were selected for visualization. The corresponding Nissl stain image was shown in the first row. From top to bottom, finer delineations of the mouse brain were shown.
4 Discussions
We have presented a data-driven DLSC framework that delineates the entire mouse brain into multiple components based on the whole-genome transcriptome. Visualizations of the components reveal meaningful patterns spanning the entire brain. When the input dictionary number is low, most of the obtained components correspond to the classical anatomical regions while other components, intriguingly, accord well with the white matter pathways and ventricular systems. At higher dictionary number, a deeper and more detailed parcellation was seen, reflecting a more complex nature of the brain organizational principle. However, one caveat is that a higher dictionary number does not always result in a more intricate parcellation. A main cause is the artifacts associated with tissue handling, image acquisition and registration integrity. Although DLSC has proved a robust analytical method and can de-noise images (Elad and Aharon 2006), some of the obtained components were clearly identified as products of artifacts by visual inspection (Supplementary material). Another reason is concerning to the limited resolution of current ISH image mapping. The voxel size is 200 micron on a side and exceedingly large to discern cells of different types and classes. Nonetheless, we have shown that the parcellation of fiber tracts and the ventricular systems is probably via markers for oligodendrocytes and astrocytes that are enriched in these regions.
As mentioned earlier, the two key assumptions of the DLSC framework are 1) each gene is expressed in a limited number of cells in the brain. 2) The integration of two gene expression follows a linear relationship. The second assumption is necessary for all matrix factorization methods. The comparative analysis of the results generated from ICA and PCA showed that DLSC was able to produce localized components that correspond to the major brain regions. In contrast, the modes obtained from PCA usually span multiple brain regions and finer structures cannot be directly resolved. Most of the components obtained from ICA either distributed across multiple brain regions or corresponded to a small portion of major brain regions. The explanation to these components is the unsupported assumption that gene expressions were independent from one another. Interestingly, the ventricular system was also revealed by ICA.
In addition to the proposed framework, we have contributed a comprehensive transcriptome architecture of the adult mouse brain. It is comprehensive on two levels. First, the input of the framework is the whole-genome ISH data of the entire mouse brain. Second, the components generated by the framework are brain-wide, covering not only the canonical anatomical areas but also white matter pathways and ventricular systems. Further work will include a detailed analysis of the relationship between the mouse brain connectomes and the revealed white matter pathways, as well as the functioning genes. Another focus will be a comprehensive characterization of co-expressed gene networks of the whole mouse brain. A deeper knowledge of these networks is an essential step toward understanding protein interactions, regulatory pathways and, ultimately, brain organization of structures and functions. Additionally, the genetic architecture, especially when it is coupled with systematic profiling in various stages of brain development and aging processes (Jiang et al. 2001; Mody et al. 2001), can serve as an informative and complementary approach to the on-going, large-scale brain mapping and decoding efforts (Tsien et al. 2013; Chen et al. 2015).
Supplementary Material
Figure S1. Visualization of the spatial maps of the 5 dictionaries that show unilateral patterns at hippocampal formation. In each panel, the first column is the spatial map of the dictionary at the slice that showed the highest expressions. The second to the fourth columns are the expression energies of the representative genes. Gene acronyms were at the bottom of the images. Results were generated using 200 dictionaries.
Figure S2. Examples for matrix factorization in the context of deriving transcriptome organization from gene expression data. Results were generated using 100 dictionaries. (d–e) The raw expression energies of Acdy5 and Pde10a. (f) Visualization of dictionary 20. X axis is the index of genes. Y axis is the weight of each gene in dictionary 20. The weights for the genes Pde10a and Acdy5 were highlighted in red. (g) The spatial map of dictionary 20 in 3D brain space.
Figure S3. Visualizations of modes obtained using PCA. The values in the parentheses are the percentage of variance explained by the mode.
Figure S4. Visualization of 33 components corresponding to anatomical regions using ICA. The components were assigned to 10 brain regions by calculating the overlaps between the reference atlas and the spatial maps. The brain regions were color-coded. Results were obtained using 100 components. The remaining 67 components were considered artefacts and shown in Figure S5 Figure S5.
Figure S5. Visualizations of 67 components obtained using ICA that were considered artefact components.
Table S1. Percentage of reconstruction errors of DLSC using different λ and number of dictionaries.
Table S2. The percentage of none-zero entries in the coefficient matrix obtained from DLSC using different λ and number of dictionaries
Table S3. The maximum mutual information between the obtained spatial maps and the reference atlas using different λ and number of dictionaries.
Acknowledgments
T. Liu is supported by NIH R01 DA-033393, NSF CAREER Award IIS-1149260, NIH R01 AG-042599, NSF BME-1302089, NSF BCS-1439051 and NSF DBI-1564736.
Footnotes
Information Sharing Statement
The analysis results and associated datasets used in this paper have been released on the website: http://mbm.cs.uga.edu/mouse/transcriptome_architecture
References
- Belgard TG, Marques AC, Oliver PL, et al. A transcriptomic atlas of mouse neocortical layers. Neuron. 2011;71:605–616. doi: 10.1016/j.neuron.2011.06.039. [DOI] [PMC free article] [PubMed] [Google Scholar]
- Bernard A, Lubbers LS, Tanis KQ, et al. Transcriptional Architecture of the Primate Neocortex. Neuron. 2012;73:1083–1099. doi: 10.1016/j.neuron.2012.03.002.Transcriptional. [DOI] [PMC free article] [PubMed] [Google Scholar]
- Bohland JW, Bokil H, Pathak SD, et al. Clustering of spatial gene expression patterns in the mouse brain and comparison with classical neuroanatomy. Methods. 2010;50:105–12. doi: 10.1016/j.ymeth.2009.09.001. [DOI] [PubMed] [Google Scholar]
- Cahoy J, Emery B, Kaushal A, et al. A Transcriptome Database for Astrocytes, Neurons, and Oligodendrocytes: A New Resource for Understanding Brain Development and Function. J Neuronscience. 2004;28:264–278. doi: 10.1523/JNEUROSCI.4178-07.2008. [DOI] [PMC free article] [PubMed] [Google Scholar]
- Chen H, Liu T, Zhao Y, et al. Optimization of large-scale mouse brain connectome via joint evaluation of DTI and neuron tracing data. Neuroimage. 2015;115:202–213. doi: 10.1016/j.neuroimage.2015.04.050. [DOI] [PMC free article] [PubMed] [Google Scholar]
- Comon P. Independent Component Analysis: A new Concept. IEEE Trans Signal Process. 1994;36:287–314. doi: 10.1016/0165-1684(94)90029-9. [DOI] [Google Scholar]
- Dong H. A Digital Color Brain Atlas of the C57BL/6J Male Mouse - by H. W. Dong. John Wiley & Sons; 2008. Allen Reference Atlas. [Google Scholar]
- Elad M, Aharon M. Image denoising via sparse and redundant representations over learned dictionaries. IEEE Trans image Process. 2006;15:3736–45. doi: 10.1109/ICIG.2009.101. [DOI] [PubMed] [Google Scholar]
- Hawrylycz M, Bernard A, Lau C, et al. Areal and laminar differentiation in the mouse neocortex using large scale gene expression data. Methods. 2010;50:113–21. doi: 10.1016/j.ymeth.2009.09.005. [DOI] [PubMed] [Google Scholar]
- Heintz N. Gene Expression Nervous System Atlas (GENSAT) Nat Neurosci. 2004;7:483. doi: 10.1038/nn0504-483. [DOI] [PubMed] [Google Scholar]
- Hyvärinen A. Fast and robust fixed-point algorithms for independent component analysis. IEEE Trans Neural Networks. 1999;10:626–634. doi: 10.1109/72.761722. [DOI] [PubMed] [Google Scholar]
- Ishizuka N, Weber J, Amaral D. Organization of intrahippocampal projections originating from CA3 pyramidal cells in the rat. J Comp Neurol. 1990;295:580–623. doi: 10.1002/cne.902950407. [DOI] [PubMed] [Google Scholar]
- Jiang CH, Tsien JZ, Schultz PG, Hu Y. The effects of aging on gene expression in the hypothalamus and cortex of mice. PNAS. 2001;98:1930–1934. doi: 10.1073/pnas.98.4.1930. [DOI] [PMC free article] [PubMed] [Google Scholar]
- Lein ES, Hawrylycz MJ, Ao N, et al. Genome-wide atlas of gene expression in the adult mouse brain. Nature. 2007;445:168–76. doi: 10.1038/nature05453. [DOI] [PubMed] [Google Scholar]
- Lein ES, Zhao X, Gage FH. Defining a molecular atlas of the hippocampus using DNA microarrays and high-throughput in situ hybridization. J Neurosci. 2004;24:3879–89. doi: 10.1523/JNEUROSCI.4710-03.2004. [DOI] [PMC free article] [PubMed] [Google Scholar]
- Lv J, Jiang X, Li X, et al. Sparse representation of whole-brain fMRI signals for identification of functional networks. Med Image Anal. 2015;20:112–34. doi: 10.1016/j.media.2014.10.011. [DOI] [PubMed] [Google Scholar]
- Mairal J, Bach F, Ponce J, Sapiro G. Online Learning for Matrix Factorization and Sparse Coding. J Mach Learn Res. 2010;11:19–60. [Google Scholar]
- Mairal J, Elad M, Sapiro G. Sparse representation for color image restoration. IEEE Trans Image Process. 2008;17:53–69. doi: 10.1109/TIP.2007.911828. [DOI] [PubMed] [Google Scholar]
- Mody M, Cao Y, Cui Z, et al. Genome-wide gene expression profiles of the developing mouse hippocampus. PNAS. 2001;98:8862–8867. doi: 10.1073/pnas.141244998. [DOI] [PMC free article] [PubMed] [Google Scholar]
- Molyneaux BJ, Arlotta P, Menezes JRL, Macklis JD. Neuronal subtype specification in the cerebral cortex. Nat Rev Neurosci. 2007;8:427–437. doi: 10.1038/nrn2151. [DOI] [PubMed] [Google Scholar]
- Mortazavi A, Williams BA, McCue K, et al. Mapping and quantifying mammalian transcriptomes by RNA-Seq. Nat Methods. 2008;5:621–628. doi: 10.1038/nmeth.1226. [DOI] [PubMed] [Google Scholar]
- Nelson SB, Sugino K, Hempel CM. The problem of neuronal cell types: a physiological genomics approach. Trends Neurosci. 2006;29:339–45. doi: 10.1016/j.tins.2006.05.004. [DOI] [PubMed] [Google Scholar]
- Ng L, Bernard A, Lau C, et al. An anatomic gene expression atlas of the adult mouse brain. Nat Neurosci. 2009;12:356–62. doi: 10.1038/nn.2281. [DOI] [PubMed] [Google Scholar]
- Thompson CL, Pathak SD, Jeromin A, et al. Genomic Anatomy of the Hippocampus. Neuron. 2008;60:1010–1021. doi: 10.1016/j.neuron.2008.12.008. [DOI] [PubMed] [Google Scholar]
- Tole S, Christian C, Grove EA. Early specification and autonomous development of cortical fields in the mouse hippocampus. Development. 1997;124:4959–4970. doi: 10.1242/dev.124.24.4959. [DOI] [PubMed] [Google Scholar]
- Tsien J, Li M, Osan R, et al. On initial Brain Activity Mapping of episodic and semantic memory code in the hippocampus. Neurobiol Learn Mem. 2013;105:200–210. doi: 10.1016/j.nlm.2013.06.019.On. [DOI] [PMC free article] [PubMed] [Google Scholar]
- Winden KD, Oldham MC, Mirnics K, et al. The organization of the transcriptional network in specific neuronal classes. Mol Syst Biol. 2009;5:1–18. doi: 10.1038/msb.2009.46. [DOI] [PMC free article] [PubMed] [Google Scholar]
- Woodhams P, Celio M, Ulfig N, Witter M. Morphological and functional correlates of borders in the entorhinal cortex and hippocampus. Hippocampus. 1993;3:303–312. doi: 10.1002/hipo.1993.4500030733. [DOI] [PubMed] [Google Scholar]
- Zeisel A, Manchado ABM, Codeluppi S, et al. Cell types in the mouse cortex and hippocampus revealed by single-cell RNA-seq. Science (80-) 2015;347:1138–42. doi: 10.1126/science.aaa1934. [DOI] [PubMed] [Google Scholar]
- Zhao X, Lein ES, He A, et al. Transcriptional profiling reveals strict boundaries between hippocampal subregions. J Comp Neurol. 2001;441:187–196. doi: 10.1002/cne.1406. [DOI] [PubMed] [Google Scholar]
Associated Data
This section collects any data citations, data availability statements, or supplementary materials included in this article.
Supplementary Materials
Figure S1. Visualization of the spatial maps of the 5 dictionaries that show unilateral patterns at hippocampal formation. In each panel, the first column is the spatial map of the dictionary at the slice that showed the highest expressions. The second to the fourth columns are the expression energies of the representative genes. Gene acronyms were at the bottom of the images. Results were generated using 200 dictionaries.
Figure S2. Examples for matrix factorization in the context of deriving transcriptome organization from gene expression data. Results were generated using 100 dictionaries. (d–e) The raw expression energies of Acdy5 and Pde10a. (f) Visualization of dictionary 20. X axis is the index of genes. Y axis is the weight of each gene in dictionary 20. The weights for the genes Pde10a and Acdy5 were highlighted in red. (g) The spatial map of dictionary 20 in 3D brain space.
Figure S3. Visualizations of modes obtained using PCA. The values in the parentheses are the percentage of variance explained by the mode.
Figure S4. Visualization of 33 components corresponding to anatomical regions using ICA. The components were assigned to 10 brain regions by calculating the overlaps between the reference atlas and the spatial maps. The brain regions were color-coded. Results were obtained using 100 components. The remaining 67 components were considered artefacts and shown in Figure S5 Figure S5.
Figure S5. Visualizations of 67 components obtained using ICA that were considered artefact components.
Table S1. Percentage of reconstruction errors of DLSC using different λ and number of dictionaries.
Table S2. The percentage of none-zero entries in the coefficient matrix obtained from DLSC using different λ and number of dictionaries
Table S3. The maximum mutual information between the obtained spatial maps and the reference atlas using different λ and number of dictionaries.


