

Abstract
Breast cancers vary by their origin and specific set of genetic lesions, which gives rise to distinct phenotypes and differential response to targeted and untargeted chemotherapies. To explore the functional differences of different breast cell types, we performed Stable Isotope Resolved Metabolomics (SIRM) studies of one primary breast (HMEC) and three breast cancer cells (MCF-7, MDAMB-231, and ZR75-1) having distinct genotypes and growth characteristics, using 13C6-glucose, 13C-1+2-glucose, 13C5,15N2-Gln, 13C3-glycerol, and 13C8-octanoate as tracers. These tracers were designed to probe the central energy producing and anabolic pathways (glycolysis, pentose phosphate pathway, Krebs Cycle, glutaminolysis, nucleotide synthesis and lipid turnover). We found that glycolysis was not associated with the rate of breast cancer cell proliferation, glutaminolysis did not support lipid synthesis in primary breast or breast cancer cells, but was a major contributor to pyrimidine ring synthesis in all cell types; anaplerotic pyruvate carboxylation was activated in breast cancer versus primary cells. We also found that glucose metabolism in individual breast cancer cell lines differed between in vitro cultures and tumor xenografts, but not the metabolic distinctions between cell lines, which may reflect the influence of tumor architecture/microenvironment.
Keywords: breast cancer metabolism, stable isotope-resolved metabolomics, mouse xenografts, 13C6-glucose, 13C-1-glucose, 13C-2-glucose, 13C5, 15N2-Gln, 13C3-glycerol, 13C8-octanoate, 1D/2D NMR, FT-ICR-MS
1. Introduction
Breast cancer continues to be a major disease afflicting 290,000 people every year in the US, of which ca. 40,000 died (ACS 2016). Although in recent years, improved surgical techniques, diagnostic procedures and targeted therapeutics such as trastuzumab and antiestrogen treatment have significantly improved the overall survival rates for those patients who can benefit (Hudis 2007) (Bliss, Kilburn et al. 2012), recurrence remains a problem. In addition, some forms of breast cancer are refractory to treatment, in particular the triple negative breast cancers and BRCA1 and 2 breast cancers. As with many cancers, 5-year survival rates decrease markedly with increasing stages as the options for treatment become limited (ACS 2016).
Although numerous genetic lesions that are responsible for the development of various subtypes of breast cancers have been identified, for example BRCA1,2, HER2/neu, among many others (Stephens, Tarpey et al. 2012), the underlying genetics describes only part of the problem, and is therefore insufficient from the diagnostic and treatment standpoints (Graur, Zheng et al. 2013). Cancers are also metabolic diseases, as the metabolic activity of transformed cells is altered to provide advantages in growth, survival and metastasis (Fan, Lane et al. 2009, Vander Heiden, Cantley et al. 2009, Linehan, Srinivasan et al. 2010, Le, Lane et al. 2012, Liu, Le et al. 2012, Marin-Valencia, Cho et al. 2012, Yuneva, Fan et al. 2012). Metabolic reprogramming is now regarded as one of the hallmarks of cancer (Hanahan and Weinberg 2011). Although the set of genetic lesions, the origin of the transformed cells, and their microenvironment differ among cancer cells (Fan, Lane et al. 2009, Marin-Valencia, Yang et al. 2012, Giussani M., Merlino G. et al. 2015), their metabolism is generally enhanced to provide sufficient metabolic energy and anabolic substrates to drive proliferation, which requires macromolecular biosynthesis. Often, cancer cell metabolism is also adapted to deal with an increasingly hostile extracellular (Gatenby and Gillies 2008) and intracellular environments, including ROS production from accelerated respiration (Fantin, St-Pierre et al. 2006, Telang 2007, Strovas, McQuaide et al. 2010, Weinberg, Hamanaka et al. 2010, Koppenol, Bounds et al. 2011).
An especially well-attested metabolic adaptation in cultured cancer cells and in tumors is accelerated lactic fermentation even in the presence of oxygen, the so-called Warburg effect. This results not only in increased glucose uptake, but also a diversion of the glycolytically produced pyruvate to lactate, and the co-export of the lactate with a proton, thereby acidifying the extracellular compartment (Tannock and Rotin 1989, Gillies and Gatenby 2007). Nevertheless, a significant fraction of the consumed glucose is used anabolically, including synthesis of hexose derivatives (Moseley, Lane et al. 2011), nucleotides and nucleic acids biosynthesis (via the pentose phosphate pathway, the pyrimidine pathway via glucose-and glutamine-derived aspartate (Fan, Tan et al. 2012, Lane and Fan 2015) the purine pathway via glucose derived serine, glycine, and one-carbon metabolism (Lee, Boros et al. 1998, Kominsky, Klawitter et al. 2009, Possemato, Marks et al. 2011, Fan, Tan et al. 2012, Locasale 2013, Labuschagne, van den Broek et al. 2014, Lane and Fan 2015), complex lipid biosynthesis (Swinnen, Brusselmans et al. 2006, Lane, Fan et al. 2009, Metallo, Gameiro et al. 2011), and protein synthesis (cf. Figure 1). Moreover, glucose is metabolized in the mitochondrial Krebs cycle as mitochondria remain active in many cancer cells, and in fact may respire at a higher rate than the untransformed cell counterparts (Telang 2007, Strovas, McQuaide et al. 2010). The respiratory activity is often, though not always perfectly, coupled to ATP synthesis (Gogvadze, Zhivotovsky et al. 2009) to supplement glycolytically-derived energy. Mitochondria of cancer cells are also active in oxidizing substrates other than glucose-derived pyruvate, notably glutamine (Yuneva, Zamboni et al. 2007, DeBerardinis and Cheng 2010) and in certain circumstances, fatty acids (Guppy, Leedman et al. 2002). As Figure 1 shows, the ultimate fate of the glutamine carbon is variable (Mazurek and Eigenbrodt 2003, DeBerardinis and Cheng 2010, Fan, Tan et al. 2012, Le, Lane et al. 2012), though the amide nitrogen is used in nucleobase synthesis, in the hexosamine pathway, or excreted as ammonium ions via glutaminase activity (DeBerardinis and Cheng 2010, Lane and Fan 2015).
Figure 1. Carbon fates in central metabolism.

Observed fates of glucose and glutamine-derived carbon in breast cancer cells. The inner dashed box represents mitochondrial reactions. 1 glucose transporter; 2 hexokinase; 3 phosphoglucomutase; 4 aldolase; 5 lactate dehydrogenase; 6 alanine amino transferase; 7 glucose/hexosamine pathway; 8 pentose phosphate pathway: oxidative branch; 9 pentose phosphate pathway: non-oxidative branch ; 10, pyrimidine nucleotide synthesis; 11 hexosamine pathway; 12 glycogen synthesis; 13 phosphoglycerate dehydrogenase; 14 glycerol-3-phosphate dehydrogenase 15 pyruvate dehydrogenase; 16 pyruvate carboxylase; 17 citrate synthase; 18, 18′ malate dehydrogenase; 19,19′ aspartate aminotransferase; 20 malic enzyme; 21 glutaminase; 22 ATP-dependent citrate lyase; 23 fatty acid synthesis; 24 purine biosynthesis.
Although glucose is generally the preferred carbon source for growth and survival for cancer cells by supporting glycolysis and the pentose phosphate pathway, Gln is also important by providing both carbon and nitrogen for pyrimidine and purine biosynthesis. Both of these substrates along with serine, glycerol and fatty acids may also be used for lipid biosynthesis. Here we report the use of multiple stable isotope tracers and SIRM to compare the fates of different carbon sources for lipid and central metabolism in estrogen-sensitive breast cancer cells, a triple negative breast cancer cell, and an untransformed human mammary epithelial cells (HMEC). These 13C-enriched carbon sources helped delineate specific metabolic pathways that are central to proliferation, and therefore enabled understanding of the metabolic basis for differential proliferation among the cell types.
2. Materials and Methods
2.1 Materials
Established cancer cell lines (Table 1) were purchased from ATCC. Primary HMEC cells were obtained from Lonza.
Table 1.
Cells used for Stable Isotope Resolved Metabolomics (SIRM) analysis.
| Cell Designation | optimal [E2]/nM | Doubling time/h | Tumorigenic? |
|---|---|---|---|
| HMEC | - | 48 | N |
| MDA-MB-231 | - | 18–20 | Y |
| MCF-7 | 10 | 30 | Y |
| ZR-75-1 | 80 | 80 | Y |
E2: 17-β-estradiol; HMEC: primary human mammary epithelial cells, MDA-MB-231: a triple negative breast carcinoma cell; MCF-7, ZR-75-1: estrogen-receptor positive breast carcinoma cells
Isotopically enriched precursors, [U-13C]-glucose, [13C-1], [13C-2] glucose, [U-13C,15N]-glutamine, [U-13C]-octanoate and [U-13C]-glycerol were purchased from Sigma Isotec (St. Louis, MO), and were at >99% isotope purity.
2.2 Cell growth and growth curves
Cells were cultured in RPMI containing 5.5 mM glucose + 4 mM Gln in which either the glucose contained 13C at all or specific position (C1 or C2) or the glutamine contained 13C and 15N at all positions. When present, [U-13C]-octanoate or [U-13C]-glycerol were added to a final concentration of 2 mM in the cell media. Cell growth was monitored by trypan blue exclusion and counting viable cells.
2.3 Mouse Xenografts
NOD/SCID Gamma (NSG) mice were obtained from Jackson Laboratories (Bar Harbor, Maine), were caged and fed according to the University of Louisville IACUC. Orthotopic xenografts were achieved by injecting cells at 1–10 million per mL in matrigel directly into the mammary fat pad of female mice in groups of 5. For estrogen-dependent cells, estradiol was supplied to the mice.
Once tumors reached a size of 0.5 to 1 cm, the mice were injected via the tail vein with either [U-13C]-glucose or [U-13C,15N]-glutamine 3 times with a spacing of 15 minutes, as previously described (Fan, Lane et al. 2011, Lane, Yan et al. 2015). At 1 and 45 minutes after the first injection, blood samples were taken introrbitally, placed into K2-EDTA tubes and allowed to stand for 1 minute at room temperature before being chilled on ice. The blood was then separated into plasma and packed cells by centrifugation at 3500 g for 15 min at 4 °C. Plasma was aspirated and flash frozen in liq. N2 for subsequent analysis. The mice were then sacrificed by cervical dislocation, and the tumors excised and flash frozen in liquid nitrogen. Lung, liver, heart, kidney and brain were sequentially dissected and also flash frozen in liquid nitrogen for metabolic analysis (Fan, Lane et al. 2011, Lane, Yan et al. 2015).
2.4 Metabolite extractions
Media at different time points were sampled and flash frozen for subsequent extraction using trichloracetic acid (Fan, Kucia M. et al. 2008) and analysis by NMR. Cells were quenched and extracted with 10% ice-cold trichloroacetic acid or acetonitrile:H2O:chloroform (2:1.5:1, v/v) as previously described (Fan 2010, Fan 2012). To calculate the relative consumption of 13C glucose and 13C and 12C lactate production, 100 μL aliquots of the media at t=0 and t=24 h were extracted and analyzed by 1H NMR, which distinguishes 13C and 12C lactate isotopomers (Lane and Fan 2007). Glucose was quantified from the H1a resonances, and the lactate from the C3H resonances. The amount of glucose consumed or lactate produced was calculated as the difference in glucose or lactate content in the media between zero and 24 h. The fraction of glucose consumed that was converted to 13C lactate, FGlc ○ Lac was calculated as: ,
| (1) |
The fractional enrichment of lactate, fLac was calculated as
| (2) |
as previously described (Lane and Fan 2007, Lane, Fan et al. 2008, Lane, Fan et al. 2009, Lane 2012, Fan and Lane 2016). In these experiments, cells were seeded at the same density. The amount of valine consumption over the experimental period was determined to be negligible compared with glucose and lactate, and thus was used as an internal concentration standard.
For the cells, both polar and non-polar (lipids) were analyzed by high resolution NMR and Fourier transform-ion cyclotron resonance-mass spectrometry (FT-ICR-MS).
2.5 Mass Spectrometry
Ultra high-resolution mass spectra were recorded by direct nanoelectrospray infusion on a Thermo LTQ-FT ICR-MS interfaced to an Advion Nanomate ESI at a resolution of 400,000 at m/z of 200 Da. Data were processed and assigned as previously described (Lane, Fan et al. 2008, Higashi, Fan et al. 2014).
2.6 NMR spectroscopy
NMR spectra were recorded at 14.1 T or 18.8 T on Varian Inova spectrometers at 293 K and compounds were identified and quantified as previously described (Fan and Lane 2008, Fan and Lane 2012).
1D 1H NMR spectra were recorded with an acquisition time of 2 s and a relaxation delay of 3 s during which the residual HOD resonance was suppressed using a weak transmitter pulse. The FIDs were zero filled to 128 k points, and apodized using an unshifted Gaussian and a 0.5 Hz line broadening exponential function. 1D HSQC spectra were recorded with an acquisition time of 0.15 s and a relaxation delay of 1.35 s with GARP decoupling. The FIDs were zerofilled to 8192 points and apodized using an unshifted Gaussian and a 4 Hz line broadening exponential. TOCSY spectra were recorded with an acquisition time of 0.5 s in t2 and 0.05 s in t1. The data table was zerofilled to 8192 by 2048 points, and apodized using an unshifted Gaussian and a line broadening exponential of 1 Hz in both dimensions. 2D 1H{13C}-HSQC were recorded with an acquisition time of 0.15 s in t2 and 0.0125 s in t1. Data in t1 were linear predicted once and zerofilled to 2028 points, and apodized using an unshifted Gaussian plus a line broadening exponential of 4 Hz in t1, and 1 Hz in t2.
Spectra were referenced to DSS, which also served as a concentration standard.
Quantitative isotopomer distributions in metabolites were determined of both polar and non-polar (lipid) extracts by 1 and 2D NMR spectra as previously described (Lane and Fan 2007, Lane, Fan et al. 2008, Lane, Fan et al. 2009, Lane 2012, Fan and Lane 2016).
3. Results
We have investigated the utilization of different substrates in three breast carcinoma and one primary breast cell lines under standardized growth conditions. These cell lines have different doubling rates and dependence on estradiol (Table 1).
3.1. 13C6-glucose reveals differential capacity of glycolysis and glucose consumption among breast cell lines
The four breast cancer cell lines were grown in 13C6-glucose (Glc) for 24 h before the polar extracts of both cells and media were analyzed by 1H NMR.
Table 2 compares the normalized amounts of 13C6-Glc consumed, 13C3-lactate (Lac) released, and fractional conversion of 13C6-Glc to 13C3-Lac (FGlc ○ Lac) in the media. The FGlc ○ Lac ranged from 0.28 to 0.62, with ZR-75-1 showing the highest value, which together with the highest 13C3-Lac release in the medium suggested that the slow-growing ZR-75-1 had the highest glycolytic capacity among the four cell lines. It is also interesting to note that the fastest growing MDA-MB231 were similar to the primary HMEC in terms of FGlc ○ Lac and 13C3-Lac release into the medium, which indicated that glycolytic capacity was not always linked to proliferation rates. Furthermore, 1H NMR analysis readily quantified both 13C labeled and unlabeled lactate (12C3-Lac), which showed that the MDA-MB-231 had lower extent of 12C3-Lac release relative to HMEC and ZR-75-1 cells (Table 2). This result suggested that HMEC and ZR75-1 produced more lactate from sources other than glucose (Lane, Fan et al. 2011). However, this lactate production did not involve classical glutaminolysis since little 13C-Lac was derived from 13C-glutamine (data not shown).
Table 2.
Comparison of medium glucose consumption and lactate release by four breast cell lines.
| Norm. nmoles/ml consumed or produced a | |||||
|---|---|---|---|---|---|
|
| |||||
| Cell lines | 12C3-Lac | 13C3-Lac | 13C6-Glc | FGlc ○ Lac | % 12C3/13C3-Lac |
|
| |||||
| HMEC | 6.15 | 69.85 | −78.26 | 0.45 | 8.80 |
| MCF7 | 0 | 8.62 | −15.44 | 0.28 | 0 |
| ZR751 | 8.37 | 120.07 | −96.75 | 0.62 | 6.97 |
| MDAMB231 | 2.23 | 57.24 | −64.27 | 0.45 | 3.89 |
Glucose consumed or lactate produced over 24 h period was quantified from 1H NMR data and normalized to the valine content of the medium as described in the Methods. FGlc ○ Lac is the fraction of the glucose consumed and excreted as 13C3 lactate and % 12C3/13C3-Lac is the percent of the medium lactate that was not derived from 13C6-glucose.
3.3 Breast cell lines exhibit differential capacity for oxidative and non-oxidative branches of the pentose phosphate pathway (PPP)
Proliferating cells require active pentose phosphate pathway (PPP) to supply ribose-5-phosphate (R5P) for the synthesis of nucleotides, DNA, and RNA. The operation of PPP was demonstrated in the four cell lines with the use of 13C6-glucose, which showed the expected 13C incorporation into the ribose moiety of different nucleotides (Figure 2).
Figure 2. 2D 1H TOCSY Spectra of four breast cell lines grown in the presence of 13C6-glucose show differential capacity for ribose incorporation into nucleotides.

TCA extracts were prepared from cells grown for 24 h in the presence of 13C6-glucose. 2D TOCSY contour maps were shown along with the corresponding 1D high-resolution 1H spectra. Dashed boxes delineate 13C satellite cross-peaks for the H1′ (x-axis) to H2′ and H3′ (y-axis) in the ribosyl unit of adenine (AXP) and H1′ to H2/H3′ in the ribosyl unit of uracil (UXP) nucleotides. Such 13C labeling patterns are consistent with the presence of 13C5-ribose subunits in both types of nucleotides, which in turn suggests the operation of PPP via the oxidative and/or non-oxidative branches. Values in parenthesis denote fractional 13C enrichment in the ribosyl unit of AXP or UXP at the 1′ position. A. HMEC; B. MCF-7; C. ZR-75-1; D. MDA-MB-231
Volume integration of the central 12C and 13C satellite cross-peaks provided the fractional 13C enrichment (Lane and Fan 2007) in the ribosyl unit of adenine (AXP) and uracil (UXP) nucleotides at the 1′ position. These values differed among the four cell lines with the slow growing ZR75-1 having the lowest values for both AXP and UXP among the four cell lines, which could point to a lower PPP capacity for ZR75-1 than for the other three cell lines. Alternatively, ZR75-1 may derive its ribose from non-glucose source(s) and/or have a lower capacity for nucleotide synthesis.
The PPP can also supply NADPH for fatty acid biosynthesis (see below) and redox homeostasis via glutathione metabolism. However, the PPP generates NADPH only via the oxidative and not the non-oxidative branch. The relative contribution of these two branches of PPP is not readily delineated using 13C6-glucose as tracer. We thus investigated the capacity for these two branches of PPP using an equimolar mixture of 13C-1- and 13C-2- glucose tracers with 2D 1H TOCSY NMR analysis of the positional isotopomers in the ribose rings of purine and pyrimidine nucleotides. If only the oxidative branch (Ox PPP) is operative, then the 13C1 atom would be lost as 13CO2, and 13C2 would be incorporated into 13C1′ (●) of the nucleotide riboses (Figure 3), resulting in a pair of horizontal 13C satellite cross-peaks for UXP-1′ and AXP-1′ in the TOCSY spectra (Figure 4). In contrast, if the non-oxidative branch of the PPP (NOx PPP) is active, then the ribose labeling patterns become more complex, as 13C labels at C1 or C2 positions of glucose is metabolized into F6P at C1 or C2 and GAP at C2 or C3 via glycolysis, followed by 13C scrambling (●) when GAP is incorporated into the intermediates of PPP including F6P, Sed7P, R5P, and X5P via the reversible reactions of transketolase (TK), transaldolase (TA). Further metabolism of R5P via nucleotide synthesis and F6P via glycolysis results in 13C labels respectively at C1′ to C5′ position of the ribose subunit of nucleotides as well as at C1 to C3 position of lactate and Ala (Figure 3).
Figure 3. 13C atom tracing of 13C-1+13C-2-glucose transformations via glycolysis, PPP, and nucleotide (NT) biosynthesis.

TCA extracts were prepared from cells grown for 24 h in the presence of equimolar 13C-1- and 13C-2-glucose. ● denotes 12C while
 ,
,
 represent 13C derived from OxPPP and NOxPPP, respectively. Ox PPP and NOx PPP: oxidative and non-oxidative branches of the pentose phosphate pathway, respectively; Glc: glucose; F6P: fructose-6-phosphate; GAP: glyceraldehyde-3-phosphate; Pyr: pyruvate; Lac: lactate; R5P: ribose-5-phosphate; X5P: xylulose-5-phosphate; Sed7P: sedoheptulose-7-phosphate; NXP: nucleotides; TK: transketolase; TA: transaldolase
Figure 4. 2D 1H TOCSY Spectra of three breast cell lines grown in the presence of 13C-1-+13C-2-glucose reveal differential capacity for oxidative and non-oxidative branches of the pentose phosphate pathway.

TCA extracts were prepared from cells grown for 24 h in the presence of 13C-1-+13C-2 glucose. 13C labeling patterns in the ribosyl subunits of nucleotides. These labeling pattern showed that both oxidative and non-oxidative branches of the PPP were active. Dashed lines indicated 13C satellite cross-peaks at given atomic positions of metabolites.
Figure 4 showed strong 13C enrichment at C2′ of AXP/UXP (vertical pair of 13C satellites for the C1′-2′ cross-peaks) and to a lesser extent at C3′ of AXP (vertical pair of 13C satellites for the C1′-3′ cross-peak), in addition to the intense C1′ of AXP and UXP (horizontal pair of 13C satellites for the C1′-2′/C1′-3′ cross-peaks) in HMEC, MCF7, and MDAMB-231 cells. This demonstrates that the NOx PPP was active as 13C labels in C2′ and C3′ of ribose can only be derived from 13C-1- + 13C-2-glucose via NOx PPP (cf. Figure 3). By quantifying the fractional enrichment (F) at C1′ and C2′ of the ribose units of AXP and UXP via the central 12C and 13C satellite cross-peaks (Fan, Tan et al. 2012), we determined that the ratio of F1′AXP to F2′AXP or F1′UXP to F2′UXP was higher in the carcinoma MCF7 and MDAMB-231 than the primary HMEC cell lines (Table 3). This result suggested that Ox PPP was relatively more active than NOx PPP in the cancer versus the primary breast cell lines, thereby contributing to more NADPH production in the former. We further noted that the 13C labeling at C2 (vertical pair of 13C satellites, Figure S1) was relatively more extensive than that at C3 (horizontal pair of 13C satellites, Figure S1) of lactate and Ala in HMEC versus MCF7 and MDAMB-231 cell lines, which pointed to relatively higher PPP than glycolytic capacity in HMEC compared with the two cancer cell lines. This is because Ox PPP operation would lead to the loss of C3 labels while NOx PPP contributed to C2 labels of lactate and Ala (Figure 3), thereby leading to selective 13C enrichment at C2 of these two metabolites in HMEC cells. The absolute fluxes through the branches of the PPP have not been determined in these experiments, which also requires a full accounting of the carbon flow into the excreted lactate and alanine.
Table 3.
Fractional enrichment in nucleotide riboses from 13C-1+13C-2 glucose.
| Cell lines | a F1′AXP | F2′AXP | F1′AXP/F2′AXP | F1′UXP | F2′UXP | F1′UXP/F2′UXP |
|---|---|---|---|---|---|---|
|
| ||||||
| HMEC | 0.321 | 0.425 | 0.757 | 0.262 | 0.343 | 0.764 |
| MCF7 | 0.405 | 0.346 | 1.169 | 0.468 | 0.265 | 1.767 |
| MDAMB-231 | 0.356 | 0.273 | 1.307 | 0.432 | 0.243 | 1.782 |
Fractional 13C enrichment was determined from relevant central 12C and 13C satellite cross-peaks in Fig. 4.
3.3. Both glucose and glutamine fuel Krebs cycle and pyrimidine biosynthesis
Both glucose and Gln can be metabolized through the Krebs cycle to produce Asp, which is the precursor to pyrimidine ring synthesis (Figure 5).
Figure 5.
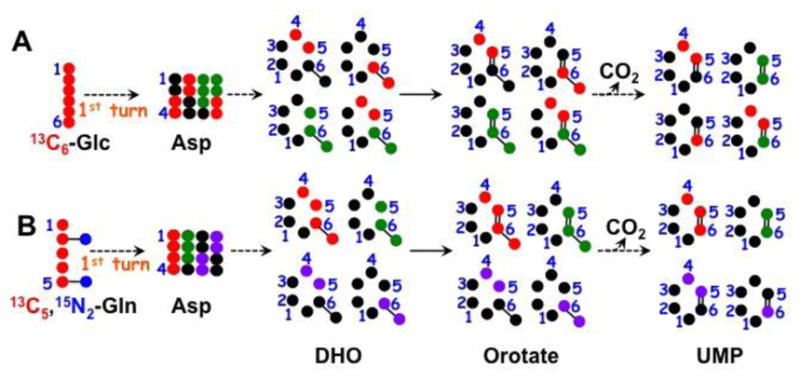
13C tracing from 13C6-Glc or 13C5,15N2-Gln into uracil ring. The two sets of atom tracing depict the transformation of 13C6-Glc (A) or 13C5,15N2-Gln (B) into Asp via the first turn of the Krebs cycle, and then into the uracil ring of UMP via the pyrimidine synthesis pathway. ●: 12C;
: 13C from pyruvate dehydrogenase-initiated Krebs cycle in A or from glutaminolysis+Krebs cycle in B;
: 13C from pyruvate carboxylase-initiated Krebs cycle ;
 : 13C from glutaminolysis+Krebs cycle+malic enzyme (Le, Lane et al. 2012); DHO : dihydroorotate.
We investigated these pathways by 2D 1H TOCSY analysis, which revealed the 13C labeling patterns of uracil rings in UXP of three breast cell lines grown in 13C6-glucose or 13C5,15N2-Gln. As shown in Figure 6 and Table 4, 13C atoms from both tracers were incorporated into the uracil ring at C5 and/or C6 in HMEC, MCF7, and ZR75-1 cells. 13C5,15N2-Gln contributed more substantially to these uracil carbons than 13C6-Glc in HMEC and ZR75-1 cells as we have observed previously for lung cancer cells (Fan, Tan et al. 2012). However, the opposite was evident for MCF7 cells. In addition, MCF7 and ZR75-1 cells showed a higher fractional enrichment in 13C6-Glc-derived uracil at C5,6 than HMEC. This 13C isotopomer is likely to be produced from the anaplerotic pyruvate carboxylation (PC) pathway, as shown in Figure 5 (denoted by ●) (Le, Lane et al. 2012, Sellers, Fox et al. 2015). Thus, the two anaplerotic pathways involving PC and glutaminolysis may be differentially utilized by different breast cell lines.
Figure 6. 13C incorporation from 13C6-glucose versus 13C5,15N2-Gln into pyrimidine nucleotides in three breast cell lines.

Cells were grown for 24 h in the presence of 5 mM each labeled glutamine (A) or glucose (B) tracer. 2D TOCSY spectra were recorded at 600 or 800 MHz using a mixing time of 50 ms along. The 2D TOCSY contour maps were shown along with the 1D high-resolution 1H spectra. Dashed boxes depicted the 13C satellites of C5 to C6 cross-peaks of the uracil ring in UXP with horizontal pairs, vertical pairs, and 4-corner satellites representing 13C labeling at C5, C6, and C5,6 of uracil, respectively.
Table 4.
Fractional 13C enrichment at C5, C6, and C5,6 of UXP in three breast cell lines.
| 13C6-Glc | 13C5,15N2-Gln | |||||
|---|---|---|---|---|---|---|
|
| ||||||
| Cell lines | a F5UXP | F6UXP | F5,6UXP | F5UXP | F6UXP | F5,6UXP |
|
| ||||||
| HMEC | 0.160 | 0.150 | 0.151 | 0.228 | 0.388 | 0.695 |
| MCF-7 | 0.272 | 0.352 | 0.327 | 0.194 | 0.235 | 0.397 |
| ZR75-1 | 0.121 | 0.147 | 0.389 | 0.459 | 0.396 | 0.739 |
F is the fractional enrichment defined as 13C/(12C+13C) for the designated sites. UXP is UMP+UDP+UTP and 5,6 are the positions in the uracil ring
3.4 Phospholipid biosynthesis differs among breast cell lines and sources
In addition to providing Asp for pyrimidine ring synthesis, glucose or Gln metabolism via the Krebs cycle supplies citrate as precursor for phospholipid biosynthesis, which is required for cell proliferation. Thus, the critical enzymes of fatty acid biosynthesis are commonly up regulated in cancer cells (Kuhajda 2000, Vazquez-Martin, Colomer et al. 2008, Daniëls VW., Smans K. et al. 2014). We have previously shown extensive de novo synthesis of complex lipids from glucose in the tamoxifen-resistant MCF-7 variant LCC2 cell line (Lane, Fan et al. 2009). Here, we compared 13C incorporation from 13C6-glucose into glycerophospholipids of HMEC, MCF-7 (Figure 7A,B), and ZR75-1 (Figures 8A) versus the faster growing MDA-MB-231 cells (Figures 7C). Both glycerol backbone and fatty acyl chains of PLs were strongly labeled in HMEC, MCF-7, and ZR75-1 cells grown in the presence of 13C6-glucose. The 13C satellite cross-peak patterns of the glycerol backbone (peaks 2, 4, 5, 8, and 10, Fig. 7) indicated the presence of the 13C3-isotopomer species only, which is consistent with its synthesis from dihydroxyacetone-3-phosphate (DHAP) in the glycolytic pathway. The 13C-labels in the fatty acyl chains were presumably derived from 13C-acetyl CoA, generated from citrate via the action of ATP-dependent citrate lyase in the cytoplasm. In contrast, the MDAMB-231 cells were significantly 13C labeled only in the glycerol backbone (ca. 25–30% enrichment), despite the much faster cell proliferation rate (Table 1). This suggested an alternative source of fatty acids such as internal lipid droplets.
Figure 7.

MDAMB-231 cells synthesize less lipids from glucose than other breast cell lines despite its higher proliferation rate. HMEC (A), MCF-7 (B) and MDA-MB-231 (C) cells were grown for 24 h in the presence of 13C6-glucose and extracted as described in the Methods. The lipid extracts were dissolved in d4-methanol, and TOCSY spectra were recorded at 14.1 T with an isotropic mixing time of 50 ms at 25 °C. Both HMEC (A) and MCF-7 (B) cells showed extensive 13C enrichment (as 13C satellite cross-peaks, green boxes) in the glycerol subunit and fatty acyl chains, which was less in extent for the glycerol subunit and absent for the fatty acyl chains in MDAMB-231 cells (C). Blue boxes denote covalent linkages of protons attached to 12C of the glycerol backbone and fatty acyl chains. 1/3, 2: 13C satellites, 12C-attached unsaturated protons, respectively; 3, 4: 12C-attached, 13C satellite of H2 of glycerol backbone, respectively; 5, 6/7: 13C satellite,12C-attached H1 of glycerol backbone, respectively; 8/10, 9: 13C satellites, 12C-attached H3 of glycerol backbone, respectively; 11, 12: : 13C satellites, 12C-attached H2 of fatty acyl chains, respectively; 13, 14: 12C-attached, 13C satellite of H11 of fatty acyl chains, respectively; 15, 16: 12C-attached, 13C satellite of H3 of fatty acyl chains, respectively.
Figure 8. Differential incorporation of carbon from different sources into phospholipids of ZR-75-1 cells.

Cells were grown in the presence of 20% oxygen and 13C6-glucose (A), 13C5,15N2-glutamine (B), 13C3-glycerol (C) or 13C8-octanoate (D) for 72 h, and extracted for phospholipids (PL) with methanol. The TOCSY spectra were recorded at 18.8 T, 20 °C. Blue and green boxes respectively denote 1H connectives between 12C-attached protons and 13C satellites of 13C-attached protons. See Fig. 7 for the assignment of each numbered peaks.
In addition to glucose, glutamine can be used for lipid synthesis via reductive carboxylation under certain conditions (Frezza, Zheng et al. 2011, Mullen, Wheaton et al. 2011, Yang, Lane et al. 2013) and/or malic enzyme action (Le, Lane et al. 2012). Fig. 8B shows the low incorporation of glutamine carbon into the lipid pool, at either the fatty acyl chains or the glycerol backbone in ZR75-1 cells, whereas glucose carbon was extensively incorporated into both subunits. Neither were glutamine carbons significantly incorporated into the lipids of HMEC, MDAMB-231, or MCF-7 cells (data not shown). We estimated from the TOCSY spectra that at most 5% of the C2,3,4 or terminal CH3 of the acyl chains was derived from 13C5-Gln, which was much lower than the extent of incorporation of either 13C6-glucose (ca. 60%) or 13C8-octanoate carbons (ca. 30%), indicating that glucose or exogenous fatty acids was preferred over Gln for the synthesis of intact lipid. This differed from the case for the free fatty acid pool, where reductive carboxylation has been shown to contribute significantly to the de novo synthesis of this pool under some conditions (Frezza, Zheng et al. 2011, Mullen, Wheaton et al. 2011, Yang, Lane et al. 2013).
Moreover, 13C3-glycerol was a good substrate for the glycerol backbone of lipids in ZR75-1 cells (13C enrichment = 20–25%), but not for the fatty acyl chains, whereas the opposite was observed for 13C8-octanoate. The lack of 13C incorporation from 13C8-octanoate into the glycerol backbone was as expected as fatty acids are not gluconeogenic substrates.
Interestingly, the TOCSY 13C labeling patterns of fatty acyl chains at the ester end – C4H2-C3H2-C2H2-C1O2 in 13C8-octanoate-treated ZR75-1 cells could not be simply accounted for by direct incorporation or incorporation of the β-oxidation product (13C2-acetyl CoA) of this fatty acid into lipids. As shown in Fig. 8D, the 13C satellite cross-peak patterns of H2 (peak 11) and H3 (peak 16) (Lane and Fan 2007, Lane, Fan et al. 2009) revealed not only 13C2-13C3- (
 ) but also 13C2-12C3 (
 ) and 12C2-13C3 (
 )-fatty acyl chains. These labeling patterns were similarly observed for H3 and H4 (not shown). With 13C8-octanoate as the fatty acyl precursor for lipid synthesis, we would expect uniform 13C labeling at C2-4 of fatty acyl chains via direct incorporation, which was inconsistent with the 1H TOCSY data. The 13C2-12C3 and 12C2-13C3-fatty acyl isotopomers could be derived from 13C labeled acetyl CoA via the de novo fatty acid synthesis pathway in which octanoate-derived AcCoA mixes with an unlabeled pool of AcCoA, producing 12C112C213C313C4, 13C113C212C312C4 as well as all 13C, and similarly for the terminal carbons. This then implicated β-oxidation of 13C8-octanoate into 13C2-AcCoA. The pattern for C3,C4 however, requires that singly labeled AcCoA is present, which may be derived via the Krebs cycle and malic enzyme activity (Figure 9).
Figure 9. 13C incorporation from 13C8-octonate into fatty acyl chains of lipids in ZR75-1 cells via beta-oxidation and malic enzyme activity.
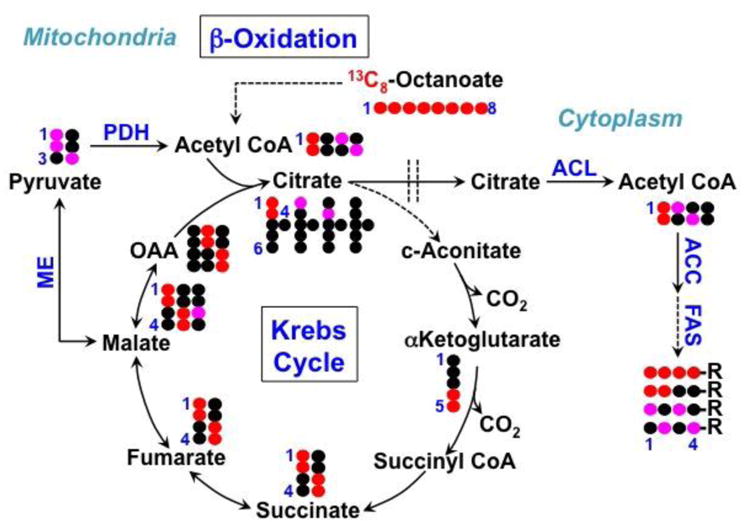
The 13C atom in 13C8-octanoate is traced into lipids via the reactions of β-oxidation, Krebs cycle, malic enzyme (ME), pyruvate dehydrogenase (PDH), ATP-citrate lyase (ACL), acetyl CoA carboxylase (ACC), and fatty acid synthase (FAS). Double dashed lines delineate mitochondria from the cytoplasm. OAA: oxaloacetate.
The fractional enrichment at the C2,3,4 positions of fatty acyl chains derived from 13C8-octanoate (30%) was significant relative to that derived from 13C6-glucose (60%), indicating that exogenous fatty acids are good substrates for complex lipid biosynthesis, as has been shown for other cancer cells (Kamphorst, Cross et al. 2013). However, it would be difficult to quantitatively compare the contribution of scavenged exogenous 13C8-octanoate relative to 13C6-glucose to lipid metabolism with the present data due to lack of knowledge on their respective contribution to β-oxidation.
The same sets of lipid extracts from Fig. 7 were also analyzed by FT-ICR-MS for 13C isotopologues of various lipid species. While NMR analysis provided information on the 13C positional isotopomers of lipids as a whole, it cannot distinguish the labeling patterns of individual phospholipids. With the high-resolution and accurate mass capability of FT-ICR-MS, a large number of lipids and their 13C isotopologue distribution can be obtained directly from crude lipid extracts (Lane, Fan et al. 2009, Higashi 2011).
As shown in Figure 10A, the FT-ICR-MS profiling of lipidic extracts of HMEC, MCF-7, and MDAMB-231 cells showed distinct lipid isotopologue distributions for a number of lipid species. The expanded spectral region denoted by the blue box (Fig. 10B) illustrated in details the 13C isotopologue distribution of PC[32:1] (phosphatidyl choline with 32 total acyl carbons and 1 unsaturation site), where the 13C3 isotopologue (m3, m/z 735.568128) along with those containing even (meven) and odd (modd) numbers (up to 28) of 13C were evident while the monoisotopic or all 12C (m0) species was absent. This indicated that most of the cellular inventory of PC[32:1] had turned over in all three cell lines. As we have shown previously (Lane, Fan et al. 2009), the m3, meven, and modd isotopologues correspond to glycerolipids with 13C3-glycerol backbone only, 13C2n-fatty acyl chains, and 13C3-glycerol backbone+13C2n-fatty acyl chains when cells are grown in 13C6-glucose. The isotopologue distributions of this lipid are quite different in the three cell lines, and overall lower 13C incorporation in MDA-MB-231 than in either MCF-7 or HMEC (Fig. S3), which is consistent with the NMR data (Fig. 7).
Figure 10. FT-ICR-MS analysis of lipids extracted from three breast cell lines reveals distinct capacity of 13C6-glucose in fueling de novo lipid synthesis.

Lipids were extracted from cells grown in the presence of 13C6-glucose and analyzed by FT-ICR-MS as described in the Methods. A. the m/z range of MDAMB-231, MCF-7, and HMEC extracts dominated by diacylglycerophospholipids; B the expanded m/z range dominated respectively by is PC 32:1+H labeled in all 3 cell types. The prominent, labeled peaks are the isotopologues (blue box from A); C. expansion red box of panel A: assignments are as follows: MDA is PS-pmg 40:7 +H (820.548398 m/z for m0 ; MCF7 is PE 40:7+Na -m0 (812.513658 m/z) is at the base of the prominent peak (unlabeled). HMEC is PC-pmg 40:7 +H. The m0 (818.602868 m/z) was not detected.
Similarly, the red box region in Fig. 10C displayed the 13C isotopologues assigned to PS-pmg 40:7 +H (MDAMB-231). The m0 (820.548398 m/z) is at the base of prominent peak (labeled 820.62431 m/z). Up to m11 its isotopologues are at the base of the labeled peaks, or not visible at this scale. Starting at 832.58805 m/z, the prominent peaks are the isotopologues. MCF7 is PE 40:7 +Na. The m0 (812.513658 m/z) is at the base of the prominent peak (unlabeled). Up to m19 the isotopologues are at the base of the labeled peaks, or not visible at this scale. Starting at 832.58660 m/z, the prominent peaks are the isotopologues. HMEC is PC-pmg 40:7 +H. The m0 (818.602868 m/z) was not detected. Up to m15 the isotopologues are at the base of the labeled peaks, or not visible at this scale. Starting at 834.66458 m/z, the prominent peaks are the isotopologues.
3.5 Metabolic activities traced by 13C6-glucose in mouse xenografts of ZR-75-1 and MDA-MB-231 cells differed from those in vitro but the metabolic differences between the two cell xenografts recapitulate those in vitro
Cells in culture may differ metabolically from those in vivo due to the influence of 3D cell architecture and/or tumor microenvironment. We therefore performed SIRM analysis in orthotopic mouse xenografts of ZR75-1 and MDAMB-231 cells for comparison with those in vitro. Figure 11A shows representative 1D 1H{13C}-HSQC spectra of extracts from the xenografts of the two cell lines with 13C6-glucose introduced as bolus injections via the tail vein (Lane, Yan et al. 2015). The xenografts of the two cell lines showed large metabolic differences (Fig. 11A), e.g. abundance of 13C-lactate (Lac), -Gln, and -glycogen was enhanced in the ZR75-1 over MDAMB-231 xenografts, while that of 13C-Ala, -Glu, succinate, -Asp, -Gly, as well as the ribosyl subunit of AXP and UXP showed the opposite trend. These data were consistent with heightened glycolysis and glycogen metabolism but reduced Krebs cycle, Gly synthesis, as well as PPP and/or nucleotide biosynthesis in ZR75-1 versus MDAMB231 tumors (Figure 11B, Table 2). These metabolic differences in the two tumor xenografts largely recapitulated those in the corresponding cell lines in vitro (Fig. 11B, Table 2). On the other hand, there were large differences between in vivo and in vitro glucose metabolism in individual cell lines. For example, the abundance ratios among 13C-3-lactate, 13C-1′-AXP, 13C-1′-UXP, and 13C-4-Glu were dramatically different between in vivo and in vitro conditions for both ZR75-1 (cf. black lines in Fig. 11A,B) and MDAMB-231 (cf. red lines in Fig. 11A,B) cells. These differences presumably reflect the influence of tumor architecture or TME on tumor cell metabolism.
Figure 11. 13C6-glucose transformations in ZR75-1 and MDAMB-231 cells as mouse xenografts show similar metabolic distinctions as observed in vitro.

Orthotopic tumors were grown from ZR75-1 or MDAMB-231 cells as described in the Methods. Mice were treated with 20 mg each 13C6-glucose via three tail vein injections at a 15-min interval (Lane, Yan et al. 2015). The tumors were harvested, polar metabolites extracted, and analyzed by 1D 1H{13C}-HSQC at 14.1 T and 20 °C in A. ZR75-1 and MDAMB231 cells in B were cultured in DMEM medium containing 0.1% 13C6-glucose for 24 h before extraction of polar metabolites with 10% trichloroacetic acid (MDAMB231) or 60% acetonitrile (ZR75-1) and 1D HSQC analysis as described in Methods. Some of the metabolites in B such as lactate (Lac), Ala, Glu, Asp, and adenine nucleotides (AXP) displayed different chemical shifts between the extracts of the two cell lines due to their pH difference.
4. Discussion
The breast cancer cells investigated had wildly different growth rates in culture with doubling times ranging from 18–20 h for the aggressive triple negative MDA-MB-231 to 80 h for the estrogen sensitive ZR75-1 line (cf. Table 1). The rate of cell growth is determined by numerous factors, but a common requirement for cell doubling is the uptake of different nutrients to support both energetic and anabolic demands from growth such as macromolecular biosynthesis. Here, we demonstrated the use of different 13C-labeled substrates coupled with NMR and FT-ICR-MS analysis to probe the fate of these substrates in a primary breast and three breast cancer cell lines varying in growth rates. The methodologies revealed the differential fate of various substrates transformed through central metabolic pathways that are essential for energy and biomass production. Although preliminary, the findings suggested some notable aspects of breast cancer cell metabolism for further investigations.
For example, glycolytic capacity as estimated from 13C6-glucose-derived lactate production and release to the media (Table 2), did not appear to be always the key to determining the rate of breast cancer cell proliferation, as ZR75-1 cells had higher capacity than the faster growing MCF-7 and MDAMB-231 cells (cf. Tables 1,2). Similar observations have previously been reported in other systems (Jain M, Nilsson R et al. 2012, Dolfi, Chan et al. 2013). It should be noted that the medium lactate production was a proxy measure of glycolytic capacity, and did not take into account the contribution of intracellular fates of glycolytic pyruvate, although the latter constitutes only a small fraction of the total pyruvate derived from glucose in cancer cells (data not shown; (Fan, Kucia et al. 2008, Le, Lane et al. 2012, Dong, Yuan et al. 2013).
We also found that glucose was by far the preferred source of nucleotide ribose produced via PPP in the breast cancer cell lines studied, as the 13C enrichment in the ribose subunit of the free nucleotide pool was high with 13C6-glucose as the source. Breast cancer cells (MDA-MB-231 and MCF-7) appeared to favor ribose synthesis via the oxidative branch of PPP, thereby leading to more NADPH production, relative to the primary HMEC cells. Different types of cells use widely different ratios of the oxidative and non-oxidative branches of the PPP from mainly oxidative (Lee, Boros et al. 1998, Centelles, Ramos-Montoya et al. 2007, Yang, Lane et al. 2013) to almost completely non-oxidative (Boros, Puigjaner et al. 1997, Ying, Kimmelman et al. 2012) or more evenly balanced (Boren, Cascante et al. 2001, Vizan, Boros et al. 2005, Kominsky, Klawitter et al. 2009).
Although anaplerosis (e.g. pyruvate carboxylation (Sellers, Fox et al. 2015) and glutaminolysis (DeBerardinis and Cheng 2010, Ochoa-Ruiz and Diaz-Ruiz 2012) is expected to be activated in cancer cells due to growth demand, PC activation appeared to be more closely associated with breast cancer cells than enhanced glutaminolysis, as the latter fueled uracil ring synthesis more extensively in HMEC than MCF-7 cells (cf. Table 4). This is consistent with a recent report that PC was overexpressed in cancerous versus non-cancerous breast cells (Phannasil, Thuwajit et al. 2015). Glutaminolysis also appeared to be an insignificant source for phospholipid biosynthesis in breast cancer or primary breast cell lines but glucose, glycerol and octanoate were good substrates for new membrane lipid production. We further noted that phospholipid synthesis from octanoate appeared to be substantially mediated via β-oxidation, as opposed to direct incorporation via acyl chain elongation. Although contorted, the βoxidation route could serve the purpose of generating energy and reducing equivalents, which are also required for lipid synthesis, in addition to producing the acetyl CoA precursor for the synthesis of fatty acyl chains. Finally, glucose transformations through the central pathways in ZR75-1 or MDAMB-231 cells appeared to be influenced by the tumor architecture or microenvironment but the metabolic distinctions between the two cell lines appeared to be maintained from in vitro cultures to in vivo xenografts.
5. Conclusions
In conclusion, by employing different stable isotope tracers and stable isotope-resolved metabolomics (SIRM) approaches, we demonstrated the differential use of 13C6-glucose, 13C-1/2-glucose, 13C5,15N2-Gln, 13C3-glycerol, and 13C8-octanoate by different human breast cell lines via glycolysis, PPP, the Krebs cycle, nucleotide biosynthesis, and lipid turnover pathways. Although preliminary, we found that glycolysis was not strongly associated with the rate of breast cancer cell proliferation, glutaminolysis did not support lipid synthesis in primary breast or breast cancer cells but contributed extensively to pyrimidine ring synthesis in all cell types, anaplerotic pyruvate carboxylation was activated in breast cancer versus primary cells, and glucose metabolism in individual breast cancer cell lines could be influenced by tumor architecture/microenvironment but not the metabolic distinctions between the cell lines.
The quantitative metabolic differences between cell lines are very clear also in the orthotopic xenografts. The uptake and utilization of glucose and glutamine is quantitatively different in the two xenografts. The metabolic reprogramming that occurs indicates that there may be multiple solutions to the demands of cell proliferation. In these studies we have shown that ER+ and triple negative cells have quite different metabolic phenotypes.
Supplementary Material
Highlights.
Nutrient utilization in different breast cancer cell lines is determined by stable isotope resolved metabolomics
There are clear metabolic differences between estrogen – dependent and triple negative cell lines, especially in lipid synthesis
Differences in metabolic phenotypes are recapitulated in orthotopic mouse xenografts.
Acknowledgments
This work was funded by the Komen Foundation [BCTR0503648], NIH [5R21CA133668-02, 1U24DK097215-01A1], and the Kentucky Challenge for Excellence. No funding agency had a role in the design or execution of the research.
Abbreviations
- DSS
2,2-dimethyl silapentane-5-sulfonate
- ER+
estrogen receptor positive
- FID
free induction decay
- FT-ICR-MS
fourier transform-ion cyclotron resonance-mass spectrometry
- HMEC
human mammary epithelial cell
- PPP
Pentose Phosphate Pathway
- TCA
trichloracetic acid
- SIRM
Stable Isotope Resolved Metabolomics
- TME
tumor microenvironment
Footnotes
Chemical compounds studied in this article:
13C6-glucose (PubChem CID:5793); 13C5,15N2-Glutamine (PubChem CID:5961); 13C3-glycerol (PubChem CID:753); 13C8-octanoate (PubChem CID:11939) ; lactate (PubChem CID:91435); ATP ; (PubChem CID:5927); UTP(PubChem CID:6133); aspartate (PubChem CID:5460541); glutamate (PubChem CID:5128032); alanine (PubChem CID:5950)
Publisher's Disclaimer: This is a PDF file of an unedited manuscript that has been accepted for publication. As a service to our customers we are providing this early version of the manuscript. The manuscript will undergo copyediting, typesetting, and review of the resulting proof before it is published in its final citable form. Please note that during the production process errors may be discovered which could affect the content, and all legal disclaimers that apply to the journal pertain.
References
- ACS. Breast Cancer Facts & Figures 2015–2016. Atlanta: American Cancer Society; 2016. pp. 1–38. [Google Scholar]
- Bliss J, Kilburn L, Coleman R, Forbes J, Coates A, Jones S, Jassem J, Delozier T, Andersen J, Paridaens R, van de Velde C, Lønning P, Morden J, Reise J, Cisar L, Menschik T, Coombes R. Disease-related outcomes with long-term follow-up: an updated analysis of the intergroup exemestane study. J Clin Oncol. 2012;30:709–717. doi: 10.1200/JCO.2010.33.7899. [DOI] [PubMed] [Google Scholar]
- Boren J, Cascante M, Marin S, Comin-Anduix B, Centelles JJ, Lim S, Bassilian S, Ahmed S, Lee WNP, Boros LG. Gleevec (ST1571) influences metabolic enzyme activities and glucose carbon flow toward nucleic acid and fatty acid synthesis in myeloid tumor cells. Journal of Biological Chemistry. 2001;276(41):37747–37753. doi: 10.1074/jbc.M105796200. [DOI] [PubMed] [Google Scholar]
- Boros LG, Puigjaner J, Cascante M, Lee WNP, Brandes JL, Bassilian S, Yusuf FI, Williams RD, Muscarella P, Melvin WS, Schirmer WJ. Oxythiamine and dehydroepiandrosterone inhibit the nonoxidative synthesis of ribose and tumor cell proliferation. Cancer Research. 1997;57(19):4242–4248. [PubMed] [Google Scholar]
- Centelles JJ, Ramos-Montoya A, Lim S, Bassilian S, Boros LG, Marin S, Cascante M, Lee WNP. Metabolic profile and quantification of deoxyribose synthesis pathways in HepG2 cells. Metabolomics. 2007;3(2):105–111. [Google Scholar]
- Daniëls VW, Smans K, Royaux I, Chypre M, Swinnen JV, ZN Cancer cells differentially activate and thrive on de novo lipid synthesis pathways in a low-lipid environment. PLoS One. 2014;9(9):e106913. doi: 10.1371/journal.pone.0106913. [DOI] [PMC free article] [PubMed] [Google Scholar]
- DeBerardinis RJ, Cheng T. Q’s next: the diverse functions of glutamine in metabolism, cell biology and cancer. Oncogene. 2010;29(3):313–324. doi: 10.1038/onc.2009.358. [DOI] [PMC free article] [PubMed] [Google Scholar]
- Dolfi SC, Chan LL-Y, Qiu J, Tedeschi PM, Bertino JR, Hirshfield KM, Oltvai ZN, Vazquez A. The metabolic demands of cancer cells are coupled to their size and protein synthesis rates. Cancer & Metabolism. 2013;1:20. doi: 10.1186/2049-3002-1-20. [DOI] [PMC free article] [PubMed] [Google Scholar]
- Dong C, Yuan T, Wu Y, Wang Y, Fan TW, Miriyala S, Lin Y, Yao J, Shi J, Kang T, Lorkiewicz P, St Clair D, Hung MC, Evers BM, Zhou BP. Loss of FBP1 by Snail-mediated repression provides metabolic advantages in basal-like breast cancer. Cancer Cell. 2013;23(3):316–331. doi: 10.1016/j.ccr.2013.01.022. [DOI] [PMC free article] [PubMed] [Google Scholar]
- Fan TW. Metabolomics-Edited Transcriptomics Analysis (META) In: Fan TW, Lane AN, Hiagshi RM, editors. Handbook of Metabolomics. Totoya: Humana; 2012. p. 17. [Google Scholar]
- Fan TW, Kucia M, Jankowski K, Higashi RM, Ratajczak J, Ratajczak MZ, Lane AN. Rhabdomyosarcoma cells show an energy producing anabolic metabolic phenotype compared with primary myocytes. Mol Cancer. 2008;7:79. doi: 10.1186/1476-4598-7-79. [DOI] [PMC free article] [PubMed] [Google Scholar]
- Fan TW, Lane AN. Structure-based profiling of Metabolites and Isotopomers by NMR. Progress in NMR Spectroscopy. 2008;52:69–117. [Google Scholar]
- Fan TW, Lane AN, Higashi RM, Farag MA, Gao H, Bousamra M, Miller DM. Altered Regulation of Metabolic Pathways in Human Lung Cancer Discerned by 13C Stable Isotope-Resolved Metabolomics (SIRM)) Molecular Cancer. 2009;8:41. doi: 10.1186/1476-4598-8-41. [DOI] [PMC free article] [PubMed] [Google Scholar]
- Fan TW-M. Metabolomics-Edited Transcriptomics Analysis (Meta) In: McQueen CA, editor. Comprehensive Toxicology. Vol. 2. Oxford: Academic Press; 2010. pp. 685–706. [Google Scholar]
- Fan TW-M, Kucia M, Jankowski K, Higashi RM, Rataczjak MZ, Rataczjak J, Lane AN. Proliferating Rhabdomyosarcoma cells shows an energy producing anabolic metabolic phenotype compared with Primary Myocytes. Molecular Cancer. 2008;7:79. doi: 10.1186/1476-4598-7-79. [DOI] [PMC free article] [PubMed] [Google Scholar]
- Fan TW-M, Lane AN. Assignment strategies for NMR resonances in metabolomics research. In: Lutz N, Sweedler JV, Weevers RA, editors. Methodologies for Metabolomics: Experimental Strategies and Techniques. Cambridge: Cambridge University Press; 2012. [Google Scholar]
- Fan TW-M, Lane AN. Applications of NMR Spectroscopy to Systems Biochemistry. Prog NMR Spectrosc. 2016;92:18–53. doi: 10.1016/j.pnmrs.2016.01.005. [DOI] [PMC free article] [PubMed] [Google Scholar]
- Fan TW-M, Lane AN, Higashi RM, Yan J. Stable Isotope Resolved Metabolomics of Lung Cancer in a SCID Mouse Model. Metabolomics. 2011;7:257–269. doi: 10.1007/s11306-010-0249-0. [DOI] [PMC free article] [PubMed] [Google Scholar]
- Fan TW-M, Tan JL, McKinney MM, Lane AN. Stable Isotope Resolved Metabolomics Analysis of Ribonucleotide and RNA Metabolism in Human Lung Cancer Cells. Metabolomics. 2012;8:517–527. doi: 10.1007/s11306-011-0337-9. [DOI] [PMC free article] [PubMed] [Google Scholar]
- Fantin VR, St-Pierre J, Leder P. Attenuation of LDH-A expression uncovers a link between glycolysis, mitochondrial physiology, and tumor maintenance. Cancer Cell. 2006;9:425–434. doi: 10.1016/j.ccr.2006.04.023. [DOI] [PubMed] [Google Scholar]
- Frezza C, Zheng L, Folger O, Rajagopalan KN, MacKenzie ED, Jerby L, Micaroni M, Chaneton B, Adam J, Hedley A, Kalna G, Tomlinson IPM, Pollard PJ, Watson DG, Deberardinis RJ, Shlomi T, Ruppin E, Gottlieb E. Haem oxygenase is synthetically lethal with the tumour suppressor fumarate hydratase. Nature. 2011;477:225–228. doi: 10.1038/nature10363. [DOI] [PubMed] [Google Scholar]
- Gatenby RA, Gillies RJ. Hypoxia and metabolism - Opinion - A microenvironmental model of carcinogenesis. Nature Reviews Cancer. 2008;8(1):56–61. doi: 10.1038/nrc2255. [DOI] [PubMed] [Google Scholar]
- Gillies RJ, Gatenby RA. Adaptive landscapes and emergent phenotypes: why do cancers have high glycolysis? Journal of Bioenergetics and Biomembranes. 2007;39(3):251–257. doi: 10.1007/s10863-007-9085-y. [DOI] [PubMed] [Google Scholar]
- Giussani M, Merlino G, Cappelletti V, Tagliabue E, DMG Tumor-extracellular matrix interactions: Identification of tools associated with breast cancer progression. Semin Cancer Biol. 2015;35:3–10. doi: 10.1016/j.semcancer.2015.09.012. [DOI] [PubMed] [Google Scholar]
- Gogvadze V, Zhivotovsky B, Orreniu S. The Warburg effect and mitochondrial stability in cancer cells. Molecular Aspects of Medicine. 2009;31:60–74. doi: 10.1016/j.mam.2009.12.004. [DOI] [PubMed] [Google Scholar]
- Graur D, Zheng Y, Price N, Azevedo RBR, Zufall RA, Elhaik E. On the Immortality of Television Sets: “Function” in the Human Genome According to the Evolution-Free Gospel of ENCODE. Genome Biol Evol. 2013;5:578–590. doi: 10.1093/gbe/evt028. [DOI] [PMC free article] [PubMed] [Google Scholar]
- Guppy M, Leedman P, Zu X, Russell V. Contribution by different fuels and metabolic pathways to the total ATP turnover of proliferating MCF-7 breast cancer cells. Biochemical Journal. 2002;364(1):309–315. doi: 10.1042/bj3640309. [DOI] [PMC free article] [PubMed] [Google Scholar]
- Hanahan D, Weinberg RA. Hallmarks of Cancer: The Next Generation. Cell. 2011;144(5):646–674. doi: 10.1016/j.cell.2011.02.013. [DOI] [PubMed] [Google Scholar]
- Higashi RM. In: Structural Mass Spectrometry for Metabolomics Handbook of Metabolomics Methods. Fan TW, Higashi RM, Lane AN, editors. New York: Humana Press; 2011. [Google Scholar]
- Higashi RM, Fan TW-M, Lorkiewicz PK, Moseley HNB, Lane AN. Stable Isotope Labeled Tracers for Metabolic Pathway Elucidation by GC-MS and FT-MS. In: Raftery D, editor. Mass Spectrometry Methods in Metabolomics. Vol. 1198. Humana Press; USA: 2014. pp. 147–167. [DOI] [PMC free article] [PubMed] [Google Scholar]
- Hudis CA. Trastuzumab — Mechanism of Action and Use in Clinical Practice. N Engl J Med. 2007;357:39–51. doi: 10.1056/NEJMra043186. [DOI] [PubMed] [Google Scholar]
- Jain M, Nilsson R, Sharma S, Madhusudhan N, Kitami T, Souza AL, Kafri R, Kirschner MW, Clish CB, MVK Metabolite profiling identifies a key role for glycine in rapid cancer cell proliferation. Science. 2012;366:1040–1044. doi: 10.1126/science.1218595. [DOI] [PMC free article] [PubMed] [Google Scholar]
- Kamphorst JJ, Cross JR, Fan J, de Stanchina E, Mathew R, White EP, Thompson CB, Rabinowitz JD. Hypoxic and Ras-transformed cells support growth by scavenging unsaturated fatty acids from lysophospholipids. Proceedings of the National Academy of Sciences of the United States of America. 2013;110(22):8882–8887. doi: 10.1073/pnas.1307237110. [DOI] [PMC free article] [PubMed] [Google Scholar]
- Kominsky DJ, Klawitter J, Brown JL, Boros LG, Melo JV, Eckhardt SG, Serkova NJ. Abnormalities in Glucose Uptake and Metabolism in Imatinib-Resistant Human BCR-ABL-Positive Cells. Clinical Cancer Research. 2009;15(10):3442–3450. doi: 10.1158/1078-0432.CCR-08-3291. [DOI] [PubMed] [Google Scholar]
- Koppenol WH, Bounds PL, Dang CV. Otto Warburg’s contributions to current concepts of cancer metabolism. Nature Reviews Cancer. 2011;11(5):325–337. doi: 10.1038/nrc3038. [DOI] [PubMed] [Google Scholar]
- Kuhajda FP. Fatty-acid synthase and human cancer: new perspectives on its role in tumor biology. Nutrition. 2000;16(3):202–208. doi: 10.1016/s0899-9007(99)00266-x. [DOI] [PubMed] [Google Scholar]
- Labuschagne C, van den Broek N, Mackay G, Vousden K, Maddocks OD. Serine, but not glycine, supports one-carbon metabolism and proliferation of cancer cells. Cell Rep. 2014;7:1248–1258. doi: 10.1016/j.celrep.2014.04.045. [DOI] [PubMed] [Google Scholar]
- Lane AN. In: NMR applications in metabolomics Handbook of Metabolomics. Fan TW-M, Lane AN, Higashi RM, editors. Humana; 2012. [Google Scholar]
- Lane AN, Fan TW. Quantification and identification of isotopomer distributions of metabolites in crude cell extracts using 1H TOCSY. Metabolomics. 2007;3:79–86. [Google Scholar]
- Lane AN, Fan TW, Higashi RM. Isotopomer-based metabolomic analysis by NMR and mass spectrometry. Biophysical Tools for Biologists. 2008;84:541–588. doi: 10.1016/S0091-679X(07)84018-0. [DOI] [PubMed] [Google Scholar]
- Lane AN, Fan TWM. Regulation of mammalian nucleotide metabolism and biosynthesis. Nucleic Acids Res. 2015;43:2466–2485. doi: 10.1093/nar/gkv047. [DOI] [PMC free article] [PubMed] [Google Scholar]
- Lane AN, Fan TW-M, Bousamra M, II, Higashi RM, Yan J, Miller DM. Stable Isotope-Resolved Metabolomics (SIRM) in Cancer Reseach with Clinical Applications of Non-Small Cell Lung Cancer. Omics. 2011;15:173–182. doi: 10.1089/omi.2010.0088. [DOI] [PMC free article] [PubMed] [Google Scholar]
- Lane AN, Fan TWM, Xie X, Moseley HN, Higashi RM. Stable isotope analysis of lipid biosynthesis by high resolution mass spectrometry and NMR. Anal Chim Acta. 2009;651:201–208. doi: 10.1016/j.aca.2009.08.032. [DOI] [PMC free article] [PubMed] [Google Scholar]
- Lane AN, Yan J, Fan TWM. 13C Tracer Studies of Metabolism in Mouse Tumor Xenografts. Bio-protocol. 2015;5:e1650. doi: 10.21769/bioprotoc.1650. [DOI] [PMC free article] [PubMed] [Google Scholar]
- Le A, Lane AN, Hamaker M, Bose S, Barbi J, Tsukamoto T, Rojas CJ, Slusher BS, Zhang H, Zimmerman LJ, Liebler DC, Slebos RJC, Lorkiewicz PK, Higashi RM, Fan TWM, Dang CV. Myc induction of hypoxic glutamine metabolism and a glucose-independent TCA cycle in human B lymphocytes. Cell Metabolism. 2012;15:110–121. doi: 10.1016/j.cmet.2011.12.009. [DOI] [PMC free article] [PubMed] [Google Scholar]
- Le A, Lane AN, Hamaker M, Bose S, Gouw A, Barbi J, Tsukamoto T, Rojas CJ, Slusher BS, Zhang H, Zimmerman LJ, Liebler DC, Slebos RJ, Lorkiewicz PK, Higashi RM, Fan TW, Dang CV. Glucose-Independent Glutamine Metabolism via TCA Cycling for Proliferation and Survival in B Cells. Cell metabolism. 2012;15(1):110–121. doi: 10.1016/j.cmet.2011.12.009. [DOI] [PMC free article] [PubMed] [Google Scholar]
- Lee WNP, Boros LG, Puigjaner J, Bassilian S, Lim S, Cascante M. Mass isotopomer study of the nonoxidative pathways of the pentose cycle with [1,2-13C2]glucose. Am J Physiol Endocrinol Metab. 1998;274(5):E843–851. doi: 10.1152/ajpendo.1998.274.5.E843. [DOI] [PubMed] [Google Scholar]
- Linehan WM, Srinivasan R, Schmidt LS. The genetic basis of kidney cancer: a metabolic disease. Nature Reviews Urology. 2010;7:277–285. doi: 10.1038/nrurol.2010.47. [DOI] [PMC free article] [PubMed] [Google Scholar]
- Liu W, Le A, Lane AN, Fan TW-M, Dang CV, Phang JM. The reprogramming of proline and glutamine metabolism contributes to the proliferative and metabolic responses to c-MYC. Proc Natl Acad Sci USA. 2012;109:8983–8988. doi: 10.1073/pnas.1203244109. [DOI] [PMC free article] [PubMed] [Google Scholar]
- Locasale JW. Serine, glycine and one-carbon units: cancer metabolism in full circle. Nature Reviews Cancer. 2013;13(8):572–583. doi: 10.1038/nrc3557. [DOI] [PMC free article] [PubMed] [Google Scholar]
- Marin-Valencia I, Cho SK, Rakheja D, Hatanpaa KJ, Kapur P, Mashimo T, Jindal A, Vemireddy V, Good LB, Raisanen J, Sun XK, Mickey B, Choi C, Takahashi M, Togao O, Pascual JM, DeBerardinis RJ, Maher EA, Malloy CR, Bachoo RM. Glucose metabolism via the pentose phosphate pathway, glycolysis and Krebs cycle in an orthotopic mouse model of human brain tumors. Nmr in Biomedicine. 2012;25(10):1177–1186. doi: 10.1002/nbm.2787. [DOI] [PMC free article] [PubMed] [Google Scholar]
- Marin-Valencia I, Yang CD, Mashimo T, Cho S, Baek H, Yang XL, Rajagopalan KN, Maddie M, Vemireddy V, Zhao ZZ, Cai L, Good L, Tu BP, Hatanpaa KJ, Mickey BE, Mates JM, Pascual JM, Maher EA, Malloy CR, DeBerardinis RJ, Bachoo RM. Analysis of Tumor Metabolism Reveals Mitochondrial Glucose Oxidation in Genetically Diverse Human Glioblastomas in the Mouse Brain In Vivo. Cell Metabolism. 2012;15(6):827–837. doi: 10.1016/j.cmet.2012.05.001. [DOI] [PMC free article] [PubMed] [Google Scholar]
- Mazurek S, Eigenbrodt E. The tumor metabolome. Anticancer Research. 2003;23(2A):1149–1154. [PubMed] [Google Scholar]
- Metallo CM, Gameiro PA, Bell EL, Mattaini KR, Yang J, Hiller K, Jewell CM, Johnson ZR, Irvine DJ, Guarente L, Kelleher JK, Vander Heiden MGV, Iliopoulos O, Stephanopoulos G. Reductive glutamine metabolism by IDH1 mediates lipogenesis under hypoxia. Nature. 2011;481:380–384. doi: 10.1038/nature10602. [DOI] [PMC free article] [PubMed] [Google Scholar]
- Moseley HNB, Lane AN, Belshoff AC, Higashi RM, Fan TWM. Non-Steady State Modeling of UDP-GlcNAc Biosynthesis is Enabled by Stable Isotope Resolved Metabolomics (SIRM) BMC Biology. 2011;9:37. [Google Scholar]
- Mullen AR, Wheaton WW, Jin ES, Chen P-H, Sullivan LB, Cheng T, Yang Y, Linehan WM, Chandel NS, DeBerardinis RJ. Reductive carboxylation supports growth in tumour cells with defective mitochondria. Nature. 2011;481:385–388. doi: 10.1038/nature10642. [DOI] [PMC free article] [PubMed] [Google Scholar]
- Ochoa-Ruiz E, Diaz-Ruiz R. Anaplerosis in cancer: Another step beyond the warburg effect. American Journal of Molecular Biology. 2012;2:291–303. [Google Scholar]
- Phannasil P, Thuwajit C, Warnnissorn M, Wallace JC, MacDonald MJ, Jitrapakdee S. Pyruvate Carboxylase Is Up-Regulated in Breast Cancer and Essential to Support Growth and Invasion of MDA-MB-231 Cells. PLoS One. 2015;10:e0129848. doi: 10.1371/journal.pone.0129848. [DOI] [PMC free article] [PubMed] [Google Scholar]
- Possemato R, Marks KM, Shaul YD, Pacold ME, Kim D, Birsoy K, Sethumadhavan S, Woo HK, Jang HG, Jha AK, Chen WW, Barrett FG, Stransky N, Tsun ZY, Cowley GS, Barretina J, Kalaany NY, Hsu PP, Ottina K, Chan AM, Yuan B, Garraway LA, Root DE, Mino-Kenudson M, Brachtel EF, Driggers EM, Sabatini DM. Functional genomics reveal that the serine synthesis pathway is essential in breast cancer. Nature. 2011;476:346–350. doi: 10.1038/nature10350. [DOI] [PMC free article] [PubMed] [Google Scholar]
- Sellers K, Fox MP, Bousamra M, Slone S, Higashi RM, Miller DM, Wang Y, Yan J, Yuneva MO, Deshpande R, Lane AN, Fan TWM. Pyruvate carboxylase is critical for non-small-cell lung cancer proliferation. J Clin Invest. 2015;125(2):687–698. doi: 10.1172/JCI72873. [DOI] [PMC free article] [PubMed] [Google Scholar]
- Stephens PJ, Tarpey PS, Davies H, Van Loo P, Greenman C, Wedge DC, Nik-Zainal S, Martin S, Varela I, Bignell GR, Yates LR, Papaemmanuil E, Beare D, Butler A, Cheverton A, Gamble J, Hinton J, Jia MM, Jayakumar A, Jones D, Latimer C, Lau KW, McLaren S, McBride DJ, Menzies A, Mudie L, Raine K, Rad R, Chapman MS, Teague J, Easton D, Langerod A, Lee MTM, Shen CY, Tee BTK, Huimin BW, Broeks A, Vargas AC, Turashvili G, Martens J, Fatima A, Miron P, Chin SF, Thomas G, Boyault S, Mariani O, Lakhani SR, van de Vijver M, Van ’Tveer L, Foekens J, Desmedt C, Sotiriou C, Tutt A, Caldas C, Reis JS, Aparicio S, Salomon AV, Borresen-Dale AL, Richardson AL, Campbell PJ, Futreal PA, Stratton MR, Osbreac The landscape of cancer genes and mutational processes in breast cancer. Nature. 2012;486(7403):400. doi: 10.1038/nature11017. [DOI] [PMC free article] [PubMed] [Google Scholar]
- Strovas T, McQuaide S, Anderson J, Nandakumar V, Kalyuzhnaya M, Burgess L, Holl M, Meldrum D, Lidstrom M. Direct measurement of oxygen consumption rates from attached and unattached cells in a reversibly sealed, diffusionally isolated sample chamber. Adv Biosci Biotechnol. 2010;5:398–408. doi: 10.4236/abb.2010.15053. [DOI] [PMC free article] [PubMed] [Google Scholar]
- Swinnen JV, Brusselmans K, Verhoeven G. Increased lipogenesis in cancer cells: new players, novel targets. Current Opinion in Clinical Nutrition and Metabolic Care. 2006;9(4):358–365. doi: 10.1097/01.mco.0000232894.28674.30. [DOI] [PubMed] [Google Scholar]
- Tannock IF, Rotin D. Acid pH in Tumors and Its Potential for Therapeutic Exploitation. Cancer Res. 1989;49:4373–4384. [PubMed] [Google Scholar]
- Telang S, Lane AN, Nelson KK, Arumugam S, Chesney JA. The oncoprotein H-RasV12 increases mitochondrial metabolism. Molec Cancer. 2007;6:77. doi: 10.1186/1476-4598-6-77. [DOI] [PMC free article] [PubMed] [Google Scholar]
- Vander Heiden MG, Cantley LC, Thompson CB. Understanding the Warburg effect: the metabolic requirements of cell proliferation. Science (New York, NY) 2009;324(5930):1029–1033. doi: 10.1126/science.1160809. [DOI] [PMC free article] [PubMed] [Google Scholar]
- Vazquez-Martin A, Colomer R, Brunet J, Lupu R, Menendez JA. Overexpression of fatty acid synthase gene activates HER1/HER2 tyrosine kinase receptors in human breast epithelial cells. Cell Proliferation. 2008;41:59–85. doi: 10.1111/j.1365-2184.2007.00498.x. [DOI] [PMC free article] [PubMed] [Google Scholar]
- Vizan P, Boros LG, Figueras A, Capella G, Mangues R, Bassilian S, Lim S, Lee W-NP, Cascante M. K-ras Codon-Specific Mutations Produce Distinctive Metabolic Phenotypes in Human Fibroblasts. Cancer Res. 2005;65(13):5512–5515. doi: 10.1158/0008-5472.CAN-05-0074. [DOI] [PubMed] [Google Scholar]
- Weinberg F, Hamanaka R, Wheaton WW, Weinberg S, Joseph J, Lopez M, Kalyanaraman B, Mutlu GM, Budinger GRS, Chandel NS. Mitochondrial metabolism and ROS generation are essential for Kras-mediated tumorigenicity. Proceedings of the National Academy of Sciences of the United States of America. 2010;107(19):8788–8793. doi: 10.1073/pnas.1003428107. [DOI] [PMC free article] [PubMed] [Google Scholar]
- Yang Y, Lane AN, Ricketts CJ, Carole Sourbier C, Wei M-H, Shuch B, Pike L, Wu M, Rouault TA, Boros LG, Fan TW-M, Linehan WM. Metabolic Reprogramming for Producing Energy and Reducing Power in Fumarate Hydratase Null Cells from Hereditary Leiomyomatosis Renal Cell Carcinoma. PLos One. 2013;8:e72179. doi: 10.1371/journal.pone.0072179. [DOI] [PMC free article] [PubMed] [Google Scholar]
- Ying HQ, Kimmelman AC, Lyssiotis CA, Hua SJ, Chu GC, Fletcher-Sananikone E, Locasale JW, Son J, Zhang HL, Coloff JL, Yan HY, Wang W, Chen SJ, Viale A, Zheng HW, Paik JH, Lim C, Guimaraes AR, Martin ES, Chang J, Hezel AF, Perry SR, Hu J, Gan BY, Xiao YH, Asara JM, Weissleder R, Wang YA, Chin L, Cantley LC, DePinho RA. Oncogenic Kras Maintains Pancreatic Tumors through Regulation of Anabolic Glucose Metabolism. Cell. 2012;149(3):656–670. doi: 10.1016/j.cell.2012.01.058. [DOI] [PMC free article] [PubMed] [Google Scholar]
- Yuneva M, Zamboni N, Oefner P, Sachidanandam R, Lazebnik Y. Deficiency in glutamine but not glucose induces MYC-dependent apoptosis in human cells. Journal of Cell Biology. 2007;178(1):93–105. doi: 10.1083/jcb.200703099. [DOI] [PMC free article] [PubMed] [Google Scholar]
- Yuneva MO, Fan TWM, Allen TD, Higashi RM, Ferraris DV, Tsukamoto T, Matés JM, Alonso FJ, Wang C, Seo Y, Chen X, Bishop JM. The Metabolic Profile of Tumors Depends on Both the Responsible Genetic Lesion and Tissue Type. Cell Metabolism. 2012;15:157–170. doi: 10.1016/j.cmet.2011.12.015. [DOI] [PMC free article] [PubMed] [Google Scholar]
Associated Data
This section collects any data citations, data availability statements, or supplementary materials included in this article.