

Abstract
Background
Chronic postsurgical pain (CPSP) affects half a million children annually in the United States, with dire socioeconomic consequences, including long-term disability into adulthood. The few studies of CPSP in children are limited by sample size, follow-up duration, non-homogeneity of surgical procedure and factors evaluated.
Methods
In a prospective study of 144 adolescents undergoing a single major surgery (spine fusion), we evaluated demographic, perioperative, surgical and psychosocial factors as predictors of a continuum of postsurgical pain: immediate, pain maintenance at 2–3 months (chronic pain/CP) and persistence of pain a year (persistent pain/PP) after surgery.
Results
We found an incidence of 37.8% and 41.8% for CP and PP. CP and acute pain were both significant predictors for developing PP (p-value <0.001 and 0.003). Preoperative pain and higher postoperative opioid requirement was significantly associated with CP (p = 0.015, p = 0.002), while Childhood Anxiety Sensitivity Index (p = 0.002) and surgical duration (p = 0.014) predicted PP. The final regression models had reasonable predictive accuracy (c-statistic of 0.73 and 0.83 for CP and PP, respectively). Anxiety scores and catastrophizing for child and parent were found to be significantly correlated (p = 0.005, p = 0.013 respectively). Pain trajectories revealed that 65% of patients who developed PP reported CP and high pain trends; however, 33% of those who developed PP could not be identified using solely pain criteria.
Conclusion
Persistent postsurgical pain in children is a significant problem. It can be predicted in part by combinations of psychological and clinical variables, which may provide evidence-based measures to prevent development of CPSP in the future.
Significance
In a homogeneous cohort of adolescents undergoing spine fusion, we report a high incidence of persistent postsurgical pain (41.8%) predicted by child anxiety, perioperative pain, and surgical duration. Our results stress timely preventive and therapeutic strategies.
1. Introduction
Chronic postsurgical pain (CPSP; Perkins and Kehlet, 2000), defined by the International Association for Study of Pain (IASP), as pain lasting longer than 2 months after surgery (Macrae and Davies, 1999), is a sizeable problem in children, with an incidence of 22–68.8% (Landman et al., 2011; Page et al. 2013b). This implies that of 1.5 million children who undergo major surgery every year in the United States, about 225,000–1,000,000 children develop CPSP. Chronic pain affects a child’s daily functioning, academics, activities and mood (Walker and Greene, 1989; Roth-Isigkeit et al., 2005) and is a major stressor for parents/caregivers, given the financial and social constraints involved (Hunfeld et al., 2001). Hence, it is necessary to understand the risk factors of CPSP in children, in order to develop preventive measures and therapies to minimize the incidence of CPSP.
Since pain experience is affected by severity of operative procedure and pain tolerance within populations, (Kotzer, 2000) we chose to evaluate pain following a single painful surgery namely, spine fusion, in adolescents. About 2–4% of otherwise healthy adolescents have idiopathic scoliosis/kyphosis and every year, about 38,000 children undergo spinal fusion in the United States (Webpage). Few studies report an improvement in pain up to 24 months after spine fusion, (Merola et al., 2002) however, the changes in patient satisfaction and other pain domains are low to moderate (Carreon et al., 2011), and 15% have continuing pain even 5 years later (Upasani et al., 2008). Studies report that preoperative pain levels, anxiety sensitivity in children as well as parental pain catastrophizing (Connelly et al., 2014; Rabbitts et al., 2015a,b), play a role in shaping pain responses and affects late recovery after surgery in children (Page et al. 2013a). However, the few studies that have evaluated pain and its maintenance after surgery in children are limited by sample size, follow-up duration, non-homogeneity of surgical procedure and factors evaluated.
Hence, we conducted a prospective study to evaluate demographic, psychosocial and perioperative factors as predictors of short- and long-term pain outcomes in opioid naïve subjects with idiopathic scoliosis undergoing spine fusion. We hypothesized that preoperative pain, anxiety and catastrophizing in children and parents, scoliosis severity (degree of curve) and surgical complexity (surgical duration and number of vertebral levels fused; Kotzer, 2000)), would be associated with persistent postoperative pain.
2. Methods
A prospective observational cohort study was conducted in 144 adolescents with idiopathic scoliosis undergoing posterior spine fusion under standard intraoperative anaesthesia and postoperative analgesia with morphine patient-controlled analgesia (PCA). The study was approved by the institutional review board. This study is registered with Clinicaltrials.gov identifiers NCT01839461 and NCT01731873, and is part of a larger pharmacogenomics study. Written informed consent was obtained from parents and assent was obtained from children before enrolment. All patients were recruited prospectively and all perioperative data were collected prospectively. The perioperative questionnaire data were collected prospectively for most of the patients (79%); in the remaining 30 patients (21%) who did not complete them prospectively, questionnaires were administered after surgery.
2.1 Participants
Healthy non-obese subjects with an American Society of Anesthesiologists (ASA) physical status ≤2 (mild systemic disease), aged 10–18 years, with a diagnosis of idiopathic scoliosis and/or kyphosis, undergoing elective spinal fusion were recruited. Exclusion criteria included pregnant or breastfeeding women, use of opioids in the past 6 months, liver or renal diseases and developmental delays.
During surgery, all patients were administered standardized total intravenous anaesthesia (propofol/remifentanil). All subjects were followed by perioperative pain service receiving a standardized pain protocol including use of morphine PCA, methocarbamol every 8 h, diazepam as needed every 4 h and other adjuncts (acetaminophen/ketorolac).
2.2 Data collection
2.2.1 Preoperative
Prior to surgery, data regarding demographic factors (sex, age and race) and weight was obtained. Patient pain scores (numerical rating scale/0–10 NRS; von Baeyer, 2009) on the day of surgery, pain medication use and physician consults for pain over the last 6 months were ascertained to rule out history of chronic pain. The Numerical Rating Scale (NRS) for pain intensity has been validated as a pain measure in children aged 7–17 years (von Baeyer, 2009). Anxiety scores for both child and a parent were assessed using 0–10 Visual Analogue Scale (VAS), a validated simple scale to measure anxiety. The VAS anxiety has been used previously in children and values ≥30 (0–100 scale; or 3/10 on 0–10 scale) were found to be correlated with higher postoperative pain (Bringuier et al., 2009). Scoliosis severity was assessed by degree of scoliosis curve as reported by the surgeon in their preoperative note. We would like to point out that the Cobbs’ angle reading by radiography lacks accuracy due to subjective reading variations (Ritter et al., 2016). Questionnaires were administered as described in the ‘follow-up’ section below.
2.2.2 Intraoperative
Duration of surgery and number of vertebral levels fused were chosen as a proxy variable for measuring surgical complexity as in prior studies (Kotzer, 2000). Intraoperative doses of propofol and remifentanil administered were also noted.
2.2.3 Postoperative days (POD) 1 and 2
Perioperative factors including pain scores were collected every 4 h in the postoperative period; morphine and diazepam doses administered were also noted.
2.2.4 Follow-up after hospital discharge
Upon discharge, all patients received similar prescriptions for pain management and similar protocols for physical therapy. They were seen during regular postsurgical visits by surgeons who managed any pain-related issues. Questionnaires were administered per schedule presented in Table 1 to obtain psychosocial and pain measures. They were administered in a standard fashion without prompting answers and giving patients time to think, at a time of their choice. Patients were blinded to the hypotheses of the study.
Table 1.
Data collection schema.
| Data collected | Time points
|
||||
|---|---|---|---|---|---|
| Preoperative | Intraoperative | 0–48 h* | 48 h to 12 months | >12 months to 5 yearsa | |
| Child measures | |||||
| Demographics | x | ||||
| Pain score | |||||
| Anxiety score | |||||
| Surgical duration | x | ||||
| Vertebral levels fused | |||||
| Propofol dose | |||||
| Remifentanil dose | |||||
| Pain scores | x | ||||
| Opioid consumption | |||||
| Diazepam use | |||||
| Analgesic adjuncts | |||||
| One-time Questionnaire administered for those who did not have preoperative questionnaires | x | ||||
| EMR review of pain and functional assessment recorded during annual orthopaedic follow-up | x | ||||
| Questionnaires | |||||
| CASI | x | 48–72 ha | |||
| PCS-C | 4–6 weeks3 | ||||
| FDI | 4–6 monthsa | ||||
| Pain assessment | 10–12 months3 | ||||
| Parent measures | |||||
| Questionnaires | x | X (for those who did not have preoperative questionnaires) | |||
| PPH | |||||
| PCS-P | |||||
CASI, Childhood Anxiety Sensitivity Index; PCS-C, Pain Catastrophizing Scale (Child version); PCS-P, Pain Catastrophizing Scale (Parent version); PPH, Parent Pain History; FDI, Functional Disability Index.
Time calculated from end of surgery.
2.2.4.1 Child questionnaires
These were administered to assess child anxiety, catastrophizing and functional disability per schedule in Table 1.
Child Anxiety Sensitivity Index/CASI is an 18-item self-report tool designed to measure symptoms of anxiety in children and adolescents, with total scores ranging from 18 to 54. It is a measure of anxiety sensitivity in children and refers to the degree to which one interprets anxiety-related symptoms as being associated with potentially harmful somatic, psychological or social consequences; the questions include statements like ‘When my stomach hurts/when I notice that my heart is beating fast, I worry I might be really sick/there is something wrong with me’ – this measures the fear and worry that symptoms are indicative of a serious health problem (somatic); ‘It scares me when I feel like I am going to faint’ that measures the psychological fear associated with the anticipation of fainting and other questions about their fear of ‘going to throw up’ etc.; ‘I don’t want other people to know when I feel afraid’ that measures social concerns and being in control (Silverman et al., 2003). The CASI has demonstrated high internal consistency in both clinical and non-clinical samples (aged 8–15.8 years), good test–retest reliability and good construct validity (Silverman et al., 2003).
Pain Catastrophizing Scale/PCS–child versions PCS-C is a 13-item self-report measure assessing the extent to which children worry, amplify, and feel helpless about their current or anticipated pain experience (Crombez et al., 2003). Responses to questions that assess rumination (Questions 8–11), feeling of helplessness (questions 1–5, 12) and magnification (questions 6, 7, 13) are scored 0–4 based on report of severity. PCS-C has good internal consistency (α = 0.90) and correlates highly with pain intensity (r = 0.49) and disability (r = 0.50; Crombez et al., 2003).
Functional disability Index (FDI) is a 15-item scale that assesses the extent to which children experience difficulties in completing specific tasks (e.g. walking to the bathroom, eating regular meals and being at school all day; Walker and Greene, 1991). It is used as a 5-point Likert scale and yields total scores ranging from 0 to 60. It been used with many paediatric populations, including children with chronic pain (Kashikar-Zuck et al., 2002) and postsurgical pain (Page et al. 2013).
2.2.4.2 Parent questionnaires
Questionnaires were administered to the parent preoperatively to assess pain history and catastrophizing.
Parental catastrophizing about their adolescent’s pain was measured using the Pain Catastrophizing Scale-Parent (PCS-P) Version (Goubert et al., 2006).
Parent Pain History (PPH) assesses parental history of a variety of pain conditions and treatment as a marker for parent pain. Twelve pain conditions are identified (including migraines, shoulder/neck pain, fibromyalgia and lower back pain), and parents indicate whether or not they have experienced each type of pain, and whether they sought medical treatment for each. Each yes/no response for the questions is scored 1/0, resulting in scores between 0 and 24. This type of pain history questionnaire has been used in prior studies of pain history in parents of young adults and children with pain syndromes (Kashikar-Zuck et al., 2008).
2.2.4.3 Pain assessment
During their hospital stay, pain scores were prospectively obtained every 4 h. Upon follow-up administration of questionnaires, they were asked to rate their present pain score (NRS), pain score they experienced most of the time over the previous month, open-ended questions about the nature and site of pain, use of medications/alternative therapies/physician consults for pain, and whether pain affects sleep or daily life activities. Besides, for patients who attended scheduled annual postoperative check-ups after a year postsurgery (usually for 5 years after surgery), pain assessments and any functional disability documented by surgeons were noted.
2.3 Outcomes
Pain outcomes evaluated are: (1) acute postoperative pain: since the time spent in the immediate postoperative period is captured well by the area under curve (AUC) for pain scores over time on postoperative day 1 and 2 (POD1 and POD2), AUC calculated using trapezoidal rule was used as the acute pain outcome; (2) chronic pain/CP, considered positive if patient reported having NRS ≥4/10 over the previous month or at the time of administration of the pain assessment (described above) at 2–3 months post-surgery; and (3) persistent pain/PP was considered positive if the patient reported pain score of NRS ≥4/10 at the time or over the previous month, during 10–12 months pain assessment, or reported that pain affected daily life activities/sleep any time during follow-up beyond a year. Although CP and PP are in effect both CPSP outcomes, we have given them different names to differentiate the time points involved. Although cut-offs of ≥3/10 have been used in cancer patients, cut-offs for NRS pain scores ≥4/10 (moderate/severe pain) were found to be predictive of pain satisfaction, need for more analgesia and sleep disturbances/associated with functional disability (Gerbershagen et al., 2011). Moreover, this cutoff of ≥4/10 has been used to define chronic back pain in previous studies (Serlin et al., 1995; Jensen et al., 2001). We recognize that lower pain scores still signify existence of chronic pain and our definitions may underestimate the problem.
2.4 Statistical analysis
Individual covariates [age, sex, race and morphine dose in mg/kg POD1 and 2, preoperative anxiety score (VAS), preoperative pain score, duration of surgery, vertebral levels fused, propofol and remifentanil doses used during surgery (per kg), use of intravenous acetaminophen/ketorolac (Yes/No), diazepam doses (mg/kg), and sequential scores for CASI, PCS-C, PCS-P and PPH] were analysed to identify those associated with AUC using simple linear regression models. Similarly, the same factors as well as AUC were evaluated to identify factors associated with CP and PP using univariate logistic regression models; those associated at a p < 0.10 were entered into multivariable models and stepwise selection used to derive a final model for each outcome where only variables with a p < 0.05 were retained (Bursac et al., 2008). Correlation between two continuous variables was examined using either Spearman’s or Pearson’s correlation coefficient as appropriate. Linear trajectories of pain scores were estimated for different combinations of PP and CP outcomes for subjects who had both CP and PP outcomes reported. (i.e. CP = No, PP = No; CP = No, PP = Yes; CP = Yes, PP = No; and CP = Yes, PP = Yes).
Power calculation was done using PASS (Power and Sample Size,© 2008, Kaysville, Utah). Assuming an incidence of our main binary outcome (Y = persistent pain) to be 20–30% (based on prior studies which show an incidence of 22% (Page et al. 2013b) to 29.5% (Landman et al., 2011; Cudilo et al., 2014), and our pilot data), for a logistic regression of (Y) on a continuous, normally distributed variable (X). With a sample size of 100, we have 80% power to detect an effect size of 2–2.7 at a 0.05 significance level (α = 0.05). This assumes X’s multiple correlations with covariates already in the model is 0.5. With lower multiple correlation between X and other covariates, we can achieve the same power with less samples, or detect a smaller effect size. The sample size required increases to 118 assuming an expected loss to follow-up of 15%.
3. Results
3.1 Demographics, recruitment and follow-up
Demographic data for the entire cohort are given in Table 2 – mostly female (73.4%) and Caucasian (84.9%). Recruitment timeline is described in Fig. 1. To our surprise, none of the potential candidates for the study were on opioids preoperatively, and hence was not a criterion that affected exclusion. While acute postoperative pain data were collected for 144 patients (100% of recruited subjects), CP outcome at 2–3 months was available in 127 patients (88%) and PP at/beyond 1 year postsurgery, in 110 patients (76%).
Table 2.
Distribution of variables of interest in the entire cohort and patient groups with and without chronic/persistent pain.
| Variable | Chronic pain (CP)
|
Persistent pain (PP)
|
|||||
|---|---|---|---|---|---|---|---|
| Entire cohort Mean ± SD |
No CP n = 79 Mean ± SD |
Yes CP n = 48 Mean ± SD |
p-Value | No PP n = 64 Mean ± SD |
Yes PP n = 46 Mean ± SD |
p-Value | |
| Age (years) | 14.44 ± 1.97 | 14.21 ± 1.86 | 14.67 ± 1.85 | 0.186 | 14.23 ± 1.87 | 14.65 ± 1.92 | 0.257 |
| Weight (kg) | 56.57 ± 15.58 | 56.85 ± 14.41 | 56.38 ± 13.32 | 0.855 | 57.07 ± 14.53 | 56.55 ± 14.28 | 0.976 |
| VAS Anxiety (Child) | 4.49 ± 2.76 | 4.57 ± 2.72 | 4.05 ± 2.98 | 0.396 | 4.44 ± 2.92 | 4.63 ± 2.89 | 0.780 |
| VAS Anxiety (Parent) | 5.86 ± 2.71 | 5.90 ± 2.57 | 5.86 ± 2.83 | 0.950 | 5.49 ± 2.3 | 5.88 ± 2.72 | 0.501 |
| Preoperative pain score | 0.53 ± 1.26 | 0.28 ± 0.91 | 1.02 ± 1.67 | 0.005 | 0.33 ± 1.02 | 1.04 ± 1.66 | 0.014 |
| Scoliosis curve (degrees) | 57.85 ± 13.63 | 58.49 ± 11.44 | 57.51 ± 16.33 | 0.716 | 59.19 ± 14.01 | 55.39 ± 12.93 | 0.163 |
| Number of vertebral levels fused | 11.5 ± 1.99 | 11.38 ± 1.71 | 11.46 ± 2.29 | 0.841 | 11.58 ± 1.84 | 11.22 ± 2.21 | 0.364 |
| Surgical duration (hours) | 4.88 ± 1.27 | 4.70 ± 1.08 | 5.00 ± 1.45 | 0.179 | 4.75 ± 1.08 | 5.15 ± 1.39 | 0.094 |
| Pain AUC POD1&2 | 198.23 ± 73.19 | 189.04 ± 67.61 | 220.05 ± 78.98 | 0.028 | 190.8 ± 65.28 | 219.48 ± 78.26 | 0.049 |
| Morphine dose POD1&2 mg/kg | 1.73 ± 0.74 | 1.57 ± 0.61 | 2.01 ± 0.78 | 0.001 | 1.77 ± 0.67 | 2.00 ± 0.72 | 0.085 |
| Diazepam dose POD1&2 mg/kg | 0.18 ± 0.13 | 0.17 ± 0.14 | 0.20 ± 0.11 | 0.234 | 0.17 ± 0.11 | 0.20 ± 0.13 | 0.342 |
| Acetaminophen IV %Yes | 66.9% | 70.5% | 63.0% | 0.391 | 67.4% | 55.6% | 0.200 |
| Ketorolac IV Yes% | 54.0% | 60.3% | 45.7% | 0.116 | 59.7% | 37.8% | 0.027 |
| PCS_Rumination (Parent) | 10.68 ± 3.82 | 10.04 ± 4.55 | 10.83 ± 4.34 | 0.947 | 9.27 ± 3.94 | 12.00 ± 3.96 | 0.536 |
| PCS_Helplessness (Parent) | 8.45 ± 5.87 | 7.92 ± 6.10 | 7.42 ± 5.26 | 0.868 | 6.47 ± 5.74 | 10.43 ± 5.13 | 0.181 |
| PCS Magnification (Parent) | 4.01 ± 2.71 | 3.96 ± 3.09 | 3.42 ± 2.47 | 0.557 | 3.33 ± 2.41 | 4.00 ± 2.58 | 0.566 |
| PCS_Total (Parent) | 22.51 ± 12.20 | 21.92 ± 12.64 | 21.67 ± 11.25 | 0.947 | 19.07 ± 11.18 | 26.43 ± 10.91 | 0.282 |
| CASI | 27.89 ± 6.07 | 27.70 ± 6.02 | 28.43 ± 5.72 | 0.588 | 25.91 ± 5.58 | 30.14 ± 5.48 | 0.006 |
| PCS_Rumination (Child) | 7.9 ± 4.22 | 8.08 ± 4.25 | 7.7 ± 4.14 | 0.695 | 7.4 ± 3.97 | 8.74 ± 4.79 | 0.220 |
| PCS_Helplessness (Child) | 5.99 ± 5.55 | 5.71 ± 5.24 | 6.31 ± 5.44 | 0.622 | 5.46 ± 5.59 | 6.87 ± 5.23 | 0.302 |
| PCS_Magnification (Child) | 3.03 ± 2.90 | 2.80 ± 2.46 | 2.82 ± 2.94 | 0.964 | 2.62 ± 3.00 | 3.3 ± 2.56 | 0.338 |
| PCS_Total (Child) | 17.46 ± 11.13 | 16.58 ± 10.72 | 16.83 ± 11.18 | 0.919 | 15.47 ± 11.09 | 18.90 ± 11.44 | 0.225 |
| FDI 4–6 weeks | 13.43 ± 10.21 | 8.08 ± 7.43 | 20.56 ± 9.19 | 0.017* | 8.88 ± 7.81 | 23.17 ± 7.91 | 0.011* |
| FDI 4–6 months | 4.88 ± 4.27 | 3.00 ± 4.21 | 7.29 ± 3.15 | 1.00 ± 1.15 | 8.50 ± 3.51 | ||
| FDI 10–12 months | 5.90 ± 6.56 | 2.80 ± 5.72 | 9.00 ± 6.32 | 0.25 ± 0.50 | 9.67 ± 5.89 | ||
IV, Intravenous; POD, Postoperative day; AUC, Area under Curve; VAS, Visual Analogue Scale; FDI, Functional Disability Index; CASI, Child Anxiety Sensitivity Index; PCS, Pain Catastrophizing Scale.
p-Value of overall FDI difference between groups.
Figure 1.
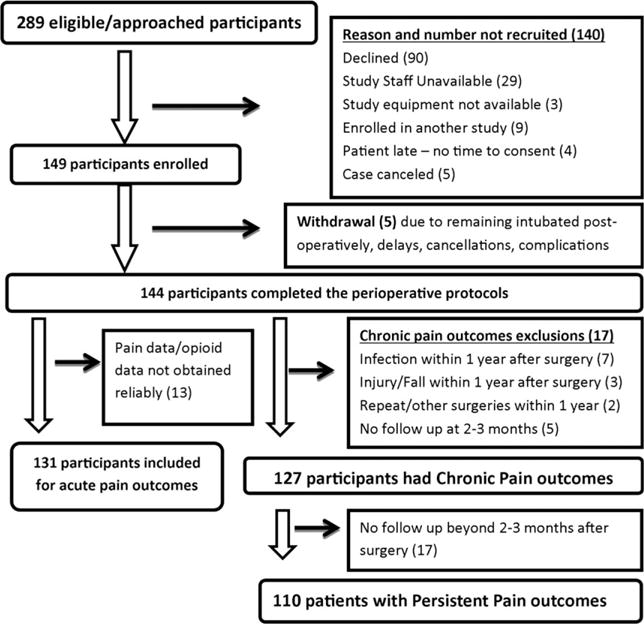
This figure depicts the recruitment and follow-up timeline for the study. Reasons for not recruiting eligible screened/approached patients, reasons for withdrawal and follow-up losses are described in detail.
Patients who did not complete follow-ups either had relocated and/or we were unable to reach them with the contact details provided by them. Hence, outcomes were not available for them. Given the observed data in the study, there is no reason to believe the missingness mechanism depends on the unobserved outcomes. Hence, we assumed missing at random, and analyses were done using only the observed data. This decreased our sample size, but remained within limits of our power calculations as we had accounted for 15% loss to follow-up. We compared the patients who did not have follow-ups (age 14.6 ± 1.8 years, weight 58.3 ± 17.4 kg, 71.4% female, 90.5% Caucasian) with those who had follow-ups (age 14.4 ± 2.0 years, 73.7% female, 83.9% Caucasian) for demographics, and found them to be similar (p = 0.625 age; p = 0.794 sex; p = 0.741 race).
3.2 Descriptive statistics
Details of preoperative and intraoperative measures for the cohorts are given in Table 2. The degree of scoliosis curve preoperatively ranged from 13 to 110 degrees. Number of vertebral levels fused varied from three to 19. Most patients had upper thoracic to lumbar fusions (25% had T3-L3 and 10% each had T2-L3, T3-L1 or T3-L4 spine fusions).
To understand the dynamics between parent and child behavioural characteristics, we examined correlations between parent and child anxiety scores, as well as PCS scores. Spearman’s correlation coefficient between VAS scores (anxiety) for child and parent was 0.27 (p = 0.005) and between overall PCS scores for child and parent was 0.28 (p = 0.013; Fig. 2). Thus, parent and child anxiety showed significant low-moderate correlations. Child anxiety, but not catastrophizing, also correlated with AUC, as in Fig. 2. Preoperative pain scores were >3 in eight patients. Average preoperative pain score was 0.5 ± 1.3.
Figure 2.

The correlation between anxiety (Visual Analogue Scale) and catastrophizing scores (based on Patient Catastrophizing Scale-child questionnaire) of child with corresponding scores of parent are presented in the upper panel and correlation with acute pain outcome (area under curve of pain scores over postoperative days 1 and 2) are presented in the lower panel. Spearman’s correlation coefficient r between anxiety scores for child and parent was 0.27 (p = 0.005) and between overall PCS scores for child and parent was 0.28 (p = 0.013). Anxiety of child correlates with pain AUC (Spearman’s correlation coefficient r = 0.23, p = 0.021), but the child overall catastrophizing score does not.
3.2.1 Postoperative pain POD1 and 2
Correlations of pain AUC, morphine requirements and preoperative pain scores are depicted in Fig. 3. Higher AUC correlated with higher morphine dose requirements [Pearson’s correlation coefficient 0.21 (p = 0.014)]. Doses in mg/kg for diazepam are given in Table 2. Intravenous (IV) acetaminophen was used in 67.4% and IV ketorolac in 54.6% of the cohort in standard doses. Scoliosis curve was not found to be associated with AUC by linear regression (p = 0.496).
Figure 3.

This figure shows the correlation of the acute pain outcome (area under curve of pain scores over postoperative days 1 and 2 or AUC) with the predictors significant by multiple regression. We see that patients who have higher preoperative pain scores have higher postoperative pain AUC (Spearman’s correlation coefficient r of 0.32, p < 0.001) and morphine consumption is correlated with pain AUC (Pearson’s correlation coefficient r = 0.21, p = 0.014).
3.2.2 Chronic and persistent pain
On follow-up, 37.8% (48/127) had CP and 41.8% (46/110) had PP. The classifiers of PP and pain descriptive data are provided in Table 3. Of patients with CP/PP, 52% complained of back pain and pain was described by words that indicated an inflammatory, musculoskeletal or neuropathic component (about a third each). Medications used to treat pain were mostly (89%) over the counter analgesics like non-steroidal anti-inflammatory agents (ibuprofen, naproxen) and acetaminophen, although two patients were on prescription medications like tapentadol, oxycodone, celecoxib and methocarbamol (Table 3). Scores of FDI were significantly higher in patients with CP (p = 0.017) and PP (p = 0.011) compared with those without (Table 4).
Table 3.
Descriptors of perioperative pain – incidence, nature, site and treatment details.
| Variable | Description | % |
|---|---|---|
| Preoperative pain score distribution | 0/10 | 83 |
| 1–3/10 | 12 | |
| 4–5/10 | 5 | |
| Chronic pain incidence | 48/127 | 37.8 |
| Persistent pain incidence | 46/110 | 41.8 |
| Classification of persistent pain | Pain affecting daily life/sleep | 18 |
| Pain >2 years | 53 | |
| Pain >= 4 | 29 | |
| Site of pain (chronic/persistent) | Back (Upper, middle, lower) | 52 |
| Shoulder (shoulder, between shoulder blades) | 18 | |
| Chest (chest, rib cage) | 4 | |
| Neck | 5 | |
| Lower extremity (Groin, Hip, Leg) | 9 | |
| Upper extremity (Hand) | 3 | |
| Nature of pain (chronic/persistent) | Inflammatory (sharp/stabbing/achy/throbbing) | 30 |
| Musculoskeletal (Tightness/crampy) | 32 | |
| Neuropathic (Tingling/burning/numbness/shooting) | 38 | |
| Therapy (for chronic/persistent pain) | Medications (Opioids 11%, Non-opioids 89%) | 43 |
| Alternative therapy (Chiropractor, natural remedies) | 35 | |
| Physician/pain consults | 22 |
Table 4.
Results of univariate analysis: Effect of individual variables on acute, chronic and persistent pain outcomes.
| Outcomes Independent variable | Acute pain
|
Chronic pain
|
Persistent pain
|
|||
|---|---|---|---|---|---|---|
| p-Value | Estimate | p-Value | Odds Ratio (95% C.I.) | p-Value | Odds ratio (95% C.I.) | |
| Sex male versus female | 0.181 | 19.19 | 0.830 | 0.91 (0.39–2.13) | 0.730 | 0.86 (0.36–2.06) |
| Race White versus other | 0.894 | 2.34 | 0.317 | 0.60 (0.23–1.62) | 0.133 | 0.45 (0.16–1.28) |
| Age (years) | 0.204 | 4.18 | 0.186 | 1.14 (0.94–1.40) | 0.257 | 1.13 (0.92–1.39) |
| Preoperative pain score (NRS) | <0.001* | 18.43 | 0.005* | 1.57 (1.14–2.17) | 0.014* | 1.50 (1.09–2.09) |
| Surgical duration (hours) | 0.213 | −6.29 | 0.179 | 1.23 (0.91–1.66) | 0.094* | 1.32 (0.95–1.82) |
| Number of vertebral levels fused | 0.385 | −2.88 | 0.841 | 1.02 (0.84–1.23) | 0.364 | 0.91 (0.75–1.11) |
| Morphine dose mg/kg POD 1&2 | 0.014* | 21.53 | 0.001* | 2.57 (1.43–4.63) | 0.085* | 1.66 (0.93–2.94) |
| Pain AUC POD1&2 | – | – | 0.028* | 1.01 (1.00–1.01) | 0.049* | 1.01 (1.00–1.01) |
| Ketorolac Yes versus No | 0.228 | −15.57 | 0.116 | 0.55 (0.27–1.16) | 0.027* | 0.41 (0.19–0.90) |
| IV Acetaminophen Yes versus No | 0.863 | 2.42 | 0.391 | 0.71 (0.33–1.54) | 0.200 | 0.60 (0.27–1.32) |
| Diazepam dose mg/kg POD1&2 | 0.019* | 116.70 | 0.234 | 5.65 (0.33–97.48) | 0.342 | 5.23 (0.17–158.65) |
| VAS Anxiety (Parent) | 0.434 | 2.22 | 0.950 | 0.99 (0.85–1.17) | 0.501 | 1.07 (0.88–1.29) |
| Parent Pain History | 0.842 | −0.37 | 0.469 | 0.96 (0.87–1.07) | 0.618 | 0.97 (0.88–1.08) |
| PCS_Rumination (parent) | 0.906 | 0.28 | 0.972 | 1.00 (0.89–1.12) | 0.536 | 1.04 (0.91–1.20) |
| PCS_Helplessness (Parent) | 0.776 | −0.42 | 0.868 | 1.01 (0.93–1.09) | 0.181 | 1.06 (0.97–1.16) |
| PCS_Magnification (Parent) | 0.497 | −2.16 | 0.557 | 0.95 (0.80–1.13) | 0.566 | 1.06 (0.87–1.30) |
| PCS_Total (parent) | 0.782 | −0.22 | 0.947 | 1.00 (0.96, 1.04) | 0.282 | 1.03 (0.98, 1.08) |
| VAS Anxiety (Child) | 0.012* | 7.01 | 0.396 | 0.94 (0.80–1.09) | 0.780 | 1.02 (0.87–1.20) |
| CASI | 0.135 | 2.19 | 0.588 | 1.02 (0.95–1.10) | 0.006* | 1.16 (1.04–1.28) |
| PCS_Rumination (Child) | 0.572 | 1.20 | 0.695 | 0.98 (0.88–1.09) | 0.220 | 1.08 (0.96–1.21) |
| PCS_Helplessness (Child) | 0.896 | 0.21 | 0.622 | 1.02 (0.94–1.11) | 0.302 | 1.05 (0.96–1.15) |
| PCS_Magnification (Child) | 0.901 | 0.39 | 0.964 | 1.00 (0.85–1.19) | 0.338 | 1.09 (0.91–1.30) |
| PCA_Total (Child) | 0.653 | 0.36 | 0.919 | 1.00 (0.96–1.05) | 0.225 | 1.03 (0.98–1.07) |
| Functional Disability Index | – | – | 0.017* | 1.20 (1.03, 1.39) | 0.011* (t-test) | |
| Remifentanil (mcg/kg) | 0.450 | −0.11 | 0.391 | 1.00 (0.99–1.01) | 0.368 | 1.00 (0.99–1.01) |
| Propofol dose (mg/kg) | 0.971 | −0.01 | 0.499 | 1.00 (1.00–1.00) | 0.179 | 1.01 (1.00–1.02) |
| Chronic Pain | – | – | – | – | <0.001* | 8.33 (3.44–20.17) |
NRS, Numerical Rating Scale; IV, Intravenous; POD, Postoperative day; AUC, Area Under Curve; VAS, Visual Analogue Scale; FDI, Functional Disability Index; CASI, Child Anxiety Sensitivity Index; PCS, Patient Catastrophizing Scale.
p-Value <0.1 – cut-off level of significance for selection of covariate for inclusion in multiple regression.
3.3 Predictors
The predictive accuracy of the final multiple regression models are as follows: the acute pain model had R2 = 0.14, and the c-statistics for predicting CP and PP were 0.73 and 0.83, respectively.
3.4 Predictors of acute postoperative pain
Four variables correlated with acute pain outcome in the univariate analyses (Table 4; Fig. 3). The most significant variable was existence of preoperative pain (p < 0.001). Postoperative pain was also positively associated with doses of pain medications (morphine and diazepam) and with preoperative anxiety scores. In multivariate analysis (Table 5), significant predictors for acute postoperative pain included morphine requirement over POD 1 and 2 (p = 0.016) and preoperative pain score (p < 0.001).
Table 5.
Results of multiple regression: Final models with significant covariates and odds ratios for acute and chronic pain outcomes.
| Predictors of pain outcomes | |||||
|---|---|---|---|---|---|
|
| |||||
| Standard t | |||||
| Outcome | Parameter | Estimate | Error | Value | Pr > |t| |
| Acute pain: AUC | Preoperative pain score | 17.66 | 4.85 | 3.64 | <0.001 |
| POD1 & 2 | Morphine consumption mg/kg POD1 and 2 | 20.02 | 8.22 | 2.43 | 0.016 |
|
| |||||
| Outcome | Parameter | OR | 95% CI | Pr > ChiSq | |
|
| |||||
| Chronic pain | Morphine consumption mg/kg POD1 and 2 | 2.63 | 1.43–4.85 | 0.002 | |
| Preoperative pain score | 1.50 | 1.05–2.07 | 0.015 | ||
| Persistent pain | Surgical duration | 2.16 | 1.17–4.00 | 0.014 | |
| AUC POD 1 and 2 | 1.02 | 1.01–1.03 | 0.003 | ||
| CASI | 1.24 | 1.09–1.42 | 0.002 | ||
| Chronic Paina | 8.33 | 3.44–20.17 | <0.001 | ||
AUC, Area Under Curve for pain scores over postoperative day (POD) 1 and 2; CASI, Child Anxiety Sensitivity Questionnaire scores.
Chronic pain was not included as a covariate in multiple regression since it was evaluated as an outcome separately and may be influenced by some of the same factors.
3.5 Predictors of chronic pain
Compared to patients without CP, patients with CP had significantly higher preoperative pain scores, as well as higher pain AUC and opioid consumption in the immediate postoperative period, in univariate analyses (Table 4). In multivariate analysis, morphine consumption on postoperative days 1 and 2 was a strong predictor of maintenance of pain at 2–3 months after surgery (OR = 2.63, 95% CI 1.43–4.85, p = 0.002). Also, having pain before surgery increased the odds of developing CP (OR = 2.63, 95% CI 1.05–2.07, p = 0.015). Odds ratios are presented in Table 5.
3.6 Predictors of persistent pain
Univariate analyses showed that compared to patients without PP, those with PP had higher pain AUC in the immediate postoperative period (Table 4). They also had a higher use of ketorolac, higher CASI scores and marginally increased surgical duration and morphine consumption. Importantly, presence of CP at 2–3 months was a strong risk factor for developing PP (p < 0.001) as was the pain score before surgery (p = 0.014). CP was however not included in the multivariate regression as it has been individually evaluated as an outcome. The final logistic regression model included surgical duration (every hour increase in the duration of surgery increased the odds of developing PP by 2.16 times (95% CI 1.17–4, p = 0.014), pain during the first two postoperative days (OR 1.02; 95% CI 1.01–1.03, p = 0.003) and CASI. The odds of pain persistence at 1 year or more was 1.24 higher for every unit increase in CASI score (95% CI 1.09–1.42, p = 0.002). Odds ratios are presented in Table 5.
3.7 Univariate analysis excluding patients who did not have preoperative questionnaires
We conducted a nested univariate analysis comparing covariates as described above, for CP and PP outcomes, excluding the subpopulation of patients who did not complete preoperative questionnaires (N = 30). Within this subset, the factors that were significantly different between patients who developed CP and did not develop CP, and similarly for PP versus no PP, were similar to that observed in the entire study cohort. For CP, the significant factors were morphine dose (p = 0.030), AUC of pain scores on POD1 and 2 (p = 0.050), use of ketorolac (p = 0.01) and preoperative pain score (p < 0.001). For PP, CP (p < 0.001), preoperative pain (p = 0.003), morphine dose (p = 0.030), AUC POD1 and 2 (p = 0.03), CASI (p = 0.040) and use of ketorolac (p = 0.010) are similar. The only difference was that surgical duration was not found to be a significant factor for PP, in this subpopulation, on univariate analysis. Due to the small size of this subpopulation, multivariate analysis was not conducted as the results would be less reliable.
3.8 Pain trajectories
Pain trajectories were analysed for groups of patients with and without chronic and persistent pain to understand the course of pain over time in these groups (Fig. 4). Of the 110 patients who developed PP, three patients did not have CP outcomes. Hence, pain trajectories of only 107 patients for whom both CP and PP outcomes were reported, are presented. The majority of patients who ultimately developed PP also reported CP (30/46, 65%), and had high pain scores in the perioperative period and through the entire follow-up period. Similarly, individuals who do not report PP exhibited low perioperative pain scores and decreasing pain scores over time. Interestingly, almost all patients (85%) who went on to develop pain lasting over years had a pain score >2/10 one year after surgery. However, there was a subset of individuals who reported PP but did not report CP (n = 15, 33% of those reporting PP). Of note, these individuals had initial pain scores similar to individuals who never reported CP or PP, which is possibly explained by risk factors other than uncontrolled pain in the early stages.
Figure 4.

Linear pain trajectories and their 95% prediction intervals of four combinatorial patient cohorts with and without chronic and persistent pain are plotted, based on the linear trajectory models. The numbers of patients in each group are mentioned (N) – of note, pain trajectories of total of 107 patients who had both CP and PP outcomes reported are presented. Although the PP outcome was reported for 110 patients, there were three of these patients for whom CP was not reported, leaving an intersection of 107 patients. Time point ‘0’ on the x-axis is the preoperative pain score. While 75% of the patients had clear cut pain trajectories (either low or high pain scores all along from preoperative to years later), the most worrisome group is the CP = No, PP = Yes group. Patients in this category would likely not be identified as at risk for developing pain in the future if they were followed up for only 1 year after surgery. It is likely that a patient with pain score<2/10 at 1 year after surgery is highly unlikely to go on to develop pain later, or the converse. Coloured bands represent 95% prediction intervals and the lines represent fitted linear regression lines of the pain trajectory.
4. Discussion
In this comprehensive prospective study of pain after spine fusion in relatively healthy adolescents, we found a high incidence of persisting pain at 3 months (37.8%) and beyond 1 year (41.8%) postsurgery, and have identified factors contributing to the pain continuum. Patients experiencing higher pain postoperatively and having pain scores >3/10 (CP) at 3 months after surgery had higher risk for persistent postsurgical pain lasting beyond a year (PP). Subjects with higher preoperative pain scores had increased risk of pain in the immediate postoperative period as well as 3 months after surgery. We also found that Childhood Anxiety Sensitivity Index scores and surgical duration were important predictors of persistent postsurgical pain.
The incidence of CP (37.8%) and PP (41.8%) in our study population is a little higher than that reported in literature. Children undergoing spine fusion were reported to have 15–29.5% incidence of pain in the moderate–severe range at 2 years (Landman et al., 2011; Sieberg et al., 2013) and up to 15% five years after spine surgery (Sieberg et al., 2013). This could be because other studies used only pain scores to define persistence of pain, while we have included pain affecting sleep and daily activities, in our definition of PP, which accounted for about 18% of the patients with PP. What is striking is that more patients had pain beyond 1 year, than at 3 months after surgery. This has been previously reported, as a statistically significant increase in pain from 2 to 5 years after spine surgery (Upasani et al., 2008). Another interesting observation is that more patients reported pain a year after surgery compared to only 17% who reported NRS >0 prior to surgery. Due to spine distraction that occurs during surgery, as well as possible shoulder and hip imbalance resulting from future growth and compensation, it must be noted that pain after spine fusion may not only be localized to the incisional area (back) but can also affect the neck, shoulders, rib cage, hips and extremities (Wong et al., 2007; Weiss and Goodall, 2008). Since the data gathered were limited to specific time points that were a few months apart, we do not have reliable interim data about the course of pain therapies administered between the specific time points and how that might have affected the transition to PP. Future studies should examine postoperative therapies at additional time points and their effect on the course of CPSP.
Similar to adult studies in patients undergoing breast cancer surgery (Katz et al., 2005), amputation (Jensen et al., 1985) and several others (Perkins and Kehlet, 2000), preoperative pain was found to be a risk factor for postoperative pain as well as CP. Hence, preoperative pain seems to be a common risk factor for pain persistence after many surgeries, including spine fusion. Patients with presurgical pain have preexisting central sensitization to pain, which is amplified by the nociceptive input of surgical trauma, thus leading to pain maintenance (Wylde et al., 2013). Thus, patients with preoperative pain might benefit from preemptive analgesia or regional blockade; in fact, use of double epidural catheters have been suggested for improved pain management after spine fusion procedures (Klatt et al., 2013), although the effect of such measures on CP/PP has not been studied. A caveat worth mentioning is that the preoperative score was collected on the day of surgery, and may have been affected by anxiety towards the operation and other factors.
Univariate analysis identified VAS score for anxiety as a significant factor for acute pain. This supports the conclusion of a systematic review that perioperative anxiety influences postoperative pain experiences of children and adolescents undergoing elective procedures (Chieng et al., 2014). Another study reported that parent and child anxiety scores at 48–72 h after surgery were found to predict pain intensity at 2 weeks (Rabbitts et al. 2015) and 12 months (Page et al. 2013) after surgery. We believe that VAS scores for anxiety are not the most optimal variable to predict postoperative pain because they are limited to the particular situation. In contrast, anxiety sensitivity or CASI is strongly correlated with, but distinct from trait anxiety, (Muris et al., 2001) and predicts state anxiety. Similar to our results that CASI predicts persistence of pain, anxiety sensitivity was reported to predict the maintenance of moderate/severe CPSP from 6 to 12 months after surgery in children (Page et al. 2013). It has been shown that higher anxiety sensitivity leads to fear of pain, which is linked to increased pain disability (Martin et al., 2007). Higher anxiety sensitivity also indicates the patient might misinterpret physiological arousal sensations as being pain-related, fear of pain causes avoidance behaviour and maladaptive coping styles (Asmundson and Taylor, 1996), thus leading to the persistence of pain. Education regarding coping processes, behavioural therapy and use of anti-anxiolytics, introduced early in the healing process, or even possibly before surgery, may benefit such patients, and prevent development of CP/PP, and merits further study.
We found that acute postoperative pain on day 1 and 2 after spine surgery is a significant predictor of CP and PP, and CP is an independent predictor for PP. This is in concordance with previous reports in adults and children. A study of two different surgical models (total knee arthroplasty for osteoarthritis and breast surgery for cancer) in adults found that pain intensity on day 2 was an independent predictive factor for pain at 3 months after surgery (Masselin-Dubois et al., 2013). Similarly, in children undergoing major orthopaedic or general surgery, those who reported a NRS ≥3/10 two weeks after discharge were found to be more than three times as likely to develop moderate/severe CPSP at 6 months and more than twice as likely to develop moderate/severe CPSP at 12 months (Page et al. 2013). Thus, pain scores in the early postoperative period provide an early warning system for identifying predisposition to PP. However, pain trajectory analysis showed that 33% of those who developed PP did not follow this pattern. This is concerning because these children would not be identified during early postoperative follow-ups, using pain as a sole criterion. This points to the fact that a combinations of several factors predict risk. Although we were able to predict reasonably well CP (c-statistic = 0.73) and PP (c-statistic = 0.83), it is likely that there are factors we have not studied or identified that may further contribute to predicting these pain phenomena. On the other hand, subjects who did not develop PP had lower average pain scores during the perioperative period and beyond, providing further evidence that preoperative and postoperative pain play an important role in predicting PP development.
Although we did not find an association between parent pain or anxiety and development of CPSP in adolescents after surgery, we did find significant correlations between parental and child anxiety scores and PCS, which might indicate an indirect influence of parent behaviour on CPSP development in anxious children. This is an area that warrants further study. Also, contrary to expectation, surgical duration was not found to predict acute pain; however, it proved to be an important risk factor for developing PP.
The strengths of our study include the use of a relatively homogenous adolescent population undergoing single surgical procedure with high propensity for pain, use of standardized anaesthesia and pain protocols and a long period of follow-up. To minimize possible information bias, validated standardized questionnaires were used at similar time points and researchers were trained to ask the questions in a standard fashion and not be coercive. It addresses the drawback of some previous studies which due to their cross-sectional design, were unable to determine direction of influence between anxiety sensitivity and pain (Martin et al., 2007) and others with shorter follow-ups did not evaluate PP (Rabbitts et al. 2015). One of the drawbacks of our study is the loss to follow-up of study subjects (34/144, about 24%). However, the groups that followed up and those that were lost to follow-up were balanced for baseline measures. We also did not evaluate certain other factors (like presurgery sleep duration, patient perception of self-image and genetics (Buchheit et al., 2012; Sadhasivam et al., 2014) which could influence pain (Sieberg et al., 2013). Another drawback is that questionnaire data were not collected preoperatively in a small group of patients. Since retrospective reporting of pain intensity and pain catastrophizing could be inaccurate and possibly affected by surgical experience, we conducted a sub-analysis excluding the aforesaid patients’ data. It is encouraging that the results of the sub-analysis were similar to the analysis including the entire cohort; moreover, we found that the questionnaire data over time for the patients who had repeat measures were stable with comparable psychological measures (CASI or PCS) over the entire period. It is also likely that the cut-offs used for the dichotomization of chronic pain outcomes might have led us to underestimate the incidence of CPSP. Although NRS scoring of pain and the questionnaires used in children have been validated and found reliable for children aged 10–18 years, bias from lack of complete understanding in the younger age group cannot be entirely ruled out.
Our study describes the trajectory and nature of pain experienced by children undergoing spine fusion, and the role of biophysical factors. This will allow better anticipation of a patient’s risk for CPSP, and targeted initiation of early interventions to prevent pain progression. Our findings support aggressive multimodal therapy to control pain in the perioperative period. Along with anti-inflammatory drugs, muscle relaxants and opioids, calcium-channel modulators (like gabapentin) that prevent neuropathic pain, preemptive analgesics like N-methyl-D-aspartate receptor antagonists (like ketamine) and regional anaesthesia should be considered (Andreae and Andreae, 2013). Although use of epidural and other multimodal analgesics have been shown to decrease need for opioid pain medications after spine fusion (Rusy et al., 2010; Taenzer and Clark, 2010), their long-term effect on development of CPSP needs to be further evaluated. It is important to recognize that patients who have preoperative pain and difficult pain control immediately after surgery will need intensive follow-up, early consultation with pain specialists for appropriate therapy focused on the nature of pain, physical and behavioural therapy, which may prevent development of persistent pain. Our findings may be generalizable to pain following other invasive surgeries in children and adults. Future research is needed in the evaluation of genetic and parental factors that might influence these outcomes, to further improve the ability to predict individual risk of developing CPSP.
Acknowledgments
We acknowledge Kayla Stallworth, and Hope Esslinger, CCRC IV, previous research coordinators for the department of anaesthesia, Cincinnati Children’s Hospital, for their help with patient recruitment in the earlier stages of the study.
Funding sources
The project described was supported by the 5K23HD082782 through the EUNICE KENNEDY SHRIVER NATIONAL INSTITUTE OF CHILD HEALTH & HUMAN DEVELOPMENT, National Institutes of Health (PI: Chidambaran), National Center for Research Resources and the National Center for Advancing Translational Sciences, National Institutes of Health, through Grant 8 UL1 TR000077 through the T1 Junior Faculty Award and Clinical Research Feasibility Funds (PI: Chidambaran). The content is solely the responsibility of the authors and does not necessarily represent the official views of the NIH. It was also supported by the APSF/ASA Safety Scientist Career Development Award by the Anesthesia Patient Safety Foundation (PI: Chidambaran).
Footnotes
Conflicts of interest
None declared.
Clinical trial number
Author contributions
V.C. was involved in design, conduct, data analysis, interpretation and manuscript draft; L.D., M.H. and V.P. were involved in data coordination and analysis; D.L.M. and E.M.C. were involved in conduct of the study; K.S. was the research coordinator for the study; S.K.Z., L.J.M. and S.S. contributed to design of the study, data interpretation and manuscript revisions. P.S. is the orthopaedic surgeon who did many of the surgeries and clinical follow-ups of the patients after surgery. All authors thus are responsible for the reported research, have read the manuscript, attest to the validity and legitimacy of the data and its interpretation, and agree to its submission.
References
- Andreae MH, Andreae DA. Regional anaesthesia to prevent chronic pain after surgery: A Cochrane systematic review and meta-analysis. Br J Anaesth. 2013;111:711–720. doi: 10.1093/bja/aet213. [DOI] [PMC free article] [PubMed] [Google Scholar]
- Asmundson GJ, Taylor S. Role of anxiety sensitivity in pain-related fear and avoidance. J Behav Med. 1996;19:577–586. doi: 10.1007/BF01904905. [DOI] [PubMed] [Google Scholar]
- von Baeyer CL. Numerical rating scale for self-report of pain intensity in children and adolescents: Recent progress and further questions. Eur J Pain. 2009;13:1005–1007. doi: 10.1016/j.ejpain.2009.08.006. [DOI] [PubMed] [Google Scholar]
- Bringuier S, Dadure C, Raux O, Dubois A, Picot MC, Capdevila X. The perioperative validity of the visual analog anxiety scale in children: A discriminant and useful instrument in routine clinical practice to optimize postoperative pain management. Anesth Analg. 2009;109:737–744. doi: 10.1213/ane.0b013e3181af00e4. [DOI] [PubMed] [Google Scholar]
- Buchheit T, Van de Ven T, Shaw A. Epigenetics and the transition from acute to chronic pain. Pain Med. 2012;13:1474–1490. doi: 10.1111/j.1526-4637.2012.01488.x. [DOI] [PMC free article] [PubMed] [Google Scholar]
- Bursac Z, Gauss CH, Williams DK, Hosmer DW. Purposeful selection of variables in logistic regression. Source Code Biol Med. 2008;3:17. doi: 10.1186/1751-0473-3-17. [DOI] [PMC free article] [PubMed] [Google Scholar]
- Carreon LY, Sanders JO, Diab M, Sturm PF, Sucato DJ, Spinal Deformity Study Group. Patient satisfaction after surgical correction of adolescent idiopathic scoliosis. Spine (Phila Pa 1976) 2011;36:965–968. doi: 10.1097/BRS.0b013e3181e92b1d. [DOI] [PubMed] [Google Scholar]
- Chieng YJ, Chan WC, Klainin-Yobas P, He HG. Perioperative anxiety and postoperative pain in children and adolescents undergoing elective surgical procedures: A quantitative systematic review. J Adv Nurs. 2014;70:243–255. doi: 10.1111/jan.12205. [DOI] [PubMed] [Google Scholar]
- Connelly M, Fulmer RD, Prohaska J, Anson L, Dryer L, et al. Predictors of postoperative pain trajectories in adolescent idiopathic scoliosis. Spine (Phila Pa 1976) 2014;39:E174–E181. doi: 10.1097/BRS.0000000000000099. [DOI] [PubMed] [Google Scholar]
- Crombez G, Bijttebier P, Eccleston C, Mascagni T, Mertens G, Goubert L, Verstraeten K. The child version of the pain catastrophizing scale (PCS-C): A preliminary validation. Pain. 2003;104:639–646. doi: 10.1016/S0304-3959(03)00121-0. [DOI] [PubMed] [Google Scholar]
- Cudilo E, Sadhasivam S, Hossain M, Esslinger H, Chidambaran V. Adolescents. Fort Lauderdale, FL: Society of Pediatric Anesthesia; 2014. Incidence and predictors of chronic post-surgical pain (CPSP) and persistent pain after spine fusion. http://www2.pedsanesthesia.org/meetings/2014winter/syllabus/submissions/aandp/walkarounds/PR2-115.pdf. [Google Scholar]
- Gerbershagen HJ, Rothaug J, Kalkman CJ, Meissner W. Determination of moderate-to-severe postoperative pain on the numeric rating scale: A cut-off point analysis applying four different methods. Br J Anaesth. 2011;107:619–626. doi: 10.1093/bja/aer195. [DOI] [PubMed] [Google Scholar]
- Goubert L, Eccleston C, Vervoort T, Jordan A, Crombez G. Parental catastrophizing about their child’s pain. The parent version of the Pain Catastrophizing Scale (PCS-P): A preliminary validation. Pain. 2006;123:254–263. doi: 10.1016/j.pain.2006.02.035. [DOI] [PubMed] [Google Scholar]
- Hunfeld JA, Perquin CW, Duivenvoorden HJ, Hazebroek-Kampschreur AA, Passchier J, van Suijlekom-Smit LW, van der Wouden JC. Chronic pain and its impact on quality of life in adolescents and their families. J Pediatr Psychol. 2001;26:145–153. doi: 10.1093/jpepsy/26.3.145. [DOI] [PubMed] [Google Scholar]
- Jensen TS, Krebs B, Nielsen J, Rasmussen P. Immediate and long-term phantom limb pain in amputees: Incidence, clinical characteristics and relationship to pre-amputation limb pain. Pain. 1985;21:267–278. doi: 10.1016/0304-3959(85)90090-9. [DOI] [PubMed] [Google Scholar]
- Jensen MP, Smith DG, Ehde DM, Robinsin LR. Pain site and the effects of amputation pain: Further clarification of the meaning of mild, moderate, and severe pain. Pain. 2001;91:317–322. doi: 10.1016/S0304-3959(00)00459-0. [DOI] [PubMed] [Google Scholar]
- Kashikar-Zuck S, Vaught MH, Goldschneider KR, Graham TB, Miller JC. Depression, coping, and functional disability in juvenile primary fibromyalgia syndrome. J Pain. 2002;3:412–419. doi: 10.1054/jpai.2002.126786. [DOI] [PubMed] [Google Scholar]
- Kashikar-Zuck S, Lynch AM, Slater S, Graham TB, Swain NF, Noll RB. Family factors, emotional functioning, and functional impairment in juvenile fibromyalgia syndrome. Arthritis Rheum. 2008;59:1392–1398. doi: 10.1002/art.24099. [DOI] [PubMed] [Google Scholar]
- Katz J, Poleshuck EL, Andrus CH, Hogan LA, Jung BF, Kulick DI, Dworkin RH. Risk factors for acute pain and its persistence following breast cancer surgery. Pain. 2005;119:16–25. doi: 10.1016/j.pain.2005.09.008. [DOI] [PubMed] [Google Scholar]
- Klatt JW, Mickelson J, Hung M, Durcan S, Miller C, Smith JT. A randomized prospective evaluation of 3 techniques of postoperative pain management after posterior spinal instrumentation and fusion. Spine (Phila Pa 1976) 2013;38:1626–1631. doi: 10.1097/BRS.0b013e31829cab0b. [DOI] [PubMed] [Google Scholar]
- Kotzer AM. Factors predicting postoperative pain in children and adolescents following spine fusion. Issues Compr Pediatr Nurs. 2000;23:83–102. doi: 10.1080/01460860050121411. [DOI] [PubMed] [Google Scholar]
- Landman Z, Oswald T, Sanders J, Diab M. Prevalence and predictors of pain in surgical treatment of adolescent idiopathic scoliosis. Spine (Phila Pa 1976) 2011;36:825–829. doi: 10.1097/BRS.0b013e3181de8c2b. [DOI] [PubMed] [Google Scholar]
- Macrae WA, Davies HTO. Chronic Postsurgical Pain. Seattle: IASP Press; 1999. [Google Scholar]
- Martin AL, McGrath PA, Brown SC, Katz J. Anxiety sensitivity, fear of pain and pain-related disability in children and adolescents with chronic pain. Pain Res Manag. 2007;12:267–272. doi: 10.1155/2007/897395. [DOI] [PMC free article] [PubMed] [Google Scholar]
- Masselin-Dubois A, Attal N, Fletcher D, Jayr C, Albi A, Fermanian J, Bouhassira D, Baudic S. Are psychological predictors of chronic postsurgical pain dependent on the surgical model? A comparison of total knee arthroplasty and breast surgery for cancer. J Pain. 2013;14:854–864. doi: 10.1016/j.jpain.2013.02.013. [DOI] [PubMed] [Google Scholar]
- Merola AA, Haher TR, Brkaric M, Panagopoulos G, Mathur S, et al. A multicenter study of the outcomes of the surgical treatment of adolescent idiopathic scoliosis using the Scoliosis Research Society (SRS) outcome instrument. Spine (Phila Pa 1976) 2002;27:2046–2051. doi: 10.1097/00007632-200209150-00015. [DOI] [PubMed] [Google Scholar]
- Muris P, Merckelbach H, Schmidt H, Gadet B, Bogie N. Anxiety and depression as correlates of self-reported behavioural inhibition in normal adolescents. Behav Res Ther. 2001;39:1051–1061. doi: 10.1016/s0005-7967(00)00081-4. [DOI] [PubMed] [Google Scholar]
- Page MG, Campbell F, Isaac L, Stinson J, Katz J. Parental risk factors for the development of pediatric acute and chronic postsurgical pain: A longitudinal study. J Pain Res. 2013a;6:727–741. doi: 10.2147/JPR.S51055. [DOI] [PMC free article] [PubMed] [Google Scholar]
- Page MG, Stinson J, Campbell F, Isaac L, Katz J. Identification of pain-related psychological risk factors for the development and maintenance of pediatric chronic postsurgical pain. J Pain Res. 2013b;6:167–180. doi: 10.2147/JPR.S40846. [DOI] [PMC free article] [PubMed] [Google Scholar]
- Perkins FM, Kehlet H. Chronic pain as an outcome of surgery. A review of predictive factors. Anesthesiology. 2000;93:1123–1133. doi: 10.1097/00000542-200010000-00038. [DOI] [PubMed] [Google Scholar]
- Rabbitts JA, Groenewald CB, Tai GG, Palermo TM. Presurgical psychosocial predictors of acute postsurgical pain and quality of life in children undergoing major surgery. J Pain. 2015a;16:226–234. doi: 10.1016/j.jpain.2014.11.015. [DOI] [PMC free article] [PubMed] [Google Scholar]
- Rabbitts JA, Zhou C, Groenewald CB, Durkin L, Palermo TM. Trajectories of postsurgica pain in children: Risk factors and impact of late pain recovery on long-term health outcomes after major surgery. Pain. 2015b;156:2383–2389. doi: 10.1097/j.pain.0000000000000281. [DOI] [PMC free article] [PubMed] [Google Scholar]
- Ritter R, Nagasse Y, Ribeiro I, Yamazato C, de Oliveira FM, Kusabara R. Comparison of Cobb angle measurement in scoliosis by residents and spine experts. Coluna/Columna. 2016;15:13–16. [Google Scholar]
- Roth-Isigkeit A, Thyen U, Stoven H, Schwarzenberger J, Schmucker P. Pain among children and adolescents: Restrictions in daily living and triggering factors. Pediatrics. 2005;115:e152–e162. doi: 10.1542/peds.2004-0682. [DOI] [PubMed] [Google Scholar]
- Rusy LM, Hainsworth KR, Nelson TJ, Czarnecki ML, Tassone JC, et al. Gabapentin use in pediatric spinal fusion patients: A randomized, double-blind, controlled trial. Anesth Analg. 2010;110:1393–1398. doi: 10.1213/ANE.0b013e3181d41dc2. [DOI] [PubMed] [Google Scholar]
- Sadhasivam S, Chidambaran V, Olbrecht VA, Esslinger HR, Zhang K, Zhang X, Martin LJ. Genetics of pain perception, COMT and postoperative pain management in children. Pharmacogenomics. 2014;15:277–284. doi: 10.2217/pgs.13.248. [DOI] [PMC free article] [PubMed] [Google Scholar]
- Serlin RC, Mendoza TR, Nakamura Y, Edwards KR, Cleeland CS. When is cancer pain mild, moderate or severe? Grading pain severity by its interference with function. Pain. 1995;61:277–284. doi: 10.1016/0304-3959(94)00178-H. [DOI] [PubMed] [Google Scholar]
- Sieberg CB, Simons LE, Edelstein MR, DeAngelis MR, Pielech M, Sethna N, Hresko MT. Pain prevalence and trajectories following pediatric spinal fusion surgery. J Pain. 2013;14:1694–1702. doi: 10.1016/j.jpain.2013.09.005. [DOI] [PMC free article] [PubMed] [Google Scholar]
- Silverman WK, Goedhart AW, Barrett P, Turner C. The facets of anxiety sensitivity represented in the childhood anxiety sensitivity index: Confirmatory analyses of factor models from past studies. J Abnorm Psychol. 2003;112:364–374. doi: 10.1037/0021-843x.112.3.364. [DOI] [PubMed] [Google Scholar]
- Taenzer AH, Clark C. Efficacy of postoperative epidural analgesia in adolescent scoliosis surgery: A meta-analysis. Paediatr Anaesth. 2010;20:135–143. doi: 10.1111/j.1460-9592.2009.03226.x. [DOI] [PubMed] [Google Scholar]
- Upasani VV, Caltoum C, Petcharaporn M, Bastrom TP, Pawelek JB, et al. Adolescent idiopathic scoliosis patients report increased pain at five years compared with two years after surgical treatment. Spine (Phila Pa 1976) 2008;33:1107–1112. doi: 10.1097/BRS.0b013e31816f2849. [DOI] [PubMed] [Google Scholar]
- Walker LS, Greene JW. Children with recurrent abdominal pain and their parents: More somatic complaints, anxiety, and depression than other patient families? J Pediatr Psychol. 1989;14:231–243. doi: 10.1093/jpepsy/14.2.231. [DOI] [PubMed] [Google Scholar]
- Walker LS, Greene JW. The functional disability inventory: Measuring a neglected dimension of child health status. J Pediatr Psychol. 1991;16:39–58. doi: 10.1093/jpepsy/16.1.39. [DOI] [PubMed] [Google Scholar]
- Webpage. Information and Support. Retrieved June 13th, 2016, from http://www.scoliosis.org/info.php.
- Weiss HR, Goodall D. The treatment of adolescent idiopathic scoliosis (AIS) according to present evidence. A systematic review. Eur J Phys Rehabil Med. 2008;44:177–193. [PubMed] [Google Scholar]
- Wong GT, Yuen VM, Chow BF, Irwin MG. Persistent pain in patients following scoliosis surgery. Eur Spine J. 2007;16:1551–1556. doi: 10.1007/s00586-007-0361-7. [DOI] [PMC free article] [PubMed] [Google Scholar]
- Wylde V, Palmer S, Learmonth ID, Dieppe P. The association between pre-operative pain sensitisation and chronic pain after knee replacement: An exploratory study. Osteoarthritis Cartilage. 2013;21:1253–1256. doi: 10.1016/j.joca.2013.05.008. [DOI] [PubMed] [Google Scholar]