

Abstract
Background
The classification of effects caused by mixtures of agents as synergistic, antagonistic or additive depends critically on the reference model of ‘null interaction’. Two main approaches are currently in use, the Additive Dose (ADM) or concentration addition (CA) and the Multiplicative Survival (MSM) or independent action (IA) models. We compare several response surface models to a newly developed Hill response surface, obtained by solving a logistic partial differential equation (PDE). Assuming that a mixture of chemicals with individual Hill-type dose-response curves can be described by an n-dimensional logistic function, Hill’s differential equation for pure agents is replaced by a PDE for mixtures whose solution provides Hill surfaces as ’null-interaction’ models and relies neither on Bliss independence or Loewe additivity nor uses Chou’s unified general theory.
Methods
An n-dimensional logistic PDE decribing the Hill-type response of n-component mixtures is solved. Appropriate boundary conditions ensure the correct asymptotic behaviour. Mathematica 11 (Wolfram, Mathematica Version 11.0, 2016) is used for the mathematics and graphics presented in this article.
Results
The Hill response surface ansatz can be applied to mixtures of compounds with arbitrary Hill parameters. Restrictions which are required when deriving analytical expressions for response surfaces from other principles, are unnecessary. Many approaches based on Loewe additivity turn out be special cases of the Hill approach whose increased flexibility permits a better description of ‘null-effect’ responses. Missing sham-compliance of Bliss IA, known as Colby’s model in agrochemistry, leads to incompatibility with the Hill surface ansatz. Examples of binary and ternary mixtures illustrate the differences between the approaches. For Hill-slopes close to one and doses below the half-maximum effect doses MSM (Colby, Bliss, Finney, Abbott) predicts synergistic effects where the Hill model indicates ‘null-interaction’. These differences increase considerably with increasing steepness of the individual dose-response curves.
Conclusion
The Hill response surface ansatz contains the Loewe additivity concept as a special case and is incompatible with Bliss independent action. Hence, when synergistic effects are claimed, those dose combinations deserve special attention where the differences between independent action approaches and Hill estimations are large.
Keywords: Synergistic effects, Hill response surface, Loewe additivity, Bliss independence, Colby’s formula
Background
Quantifying the effect of an active substance upon application to its target organism is a central topic in life sciences. The description and prediction of dose-response curves of pure compounds and estimating the combined effect of simultaneous administration of several active ingredients (a.i.s) is a field of active research in pharmacology, anesthesiology, toxicology, environmental science, and agrochemistry. The detection of virtually any kind of interaction between drugs is, e.g., of utmost importance for risk assessment in the registration process of chemicals in general. While synergistic adverse effects present a challenge to say the least, synergistic effects in drug administration are desirable as they might be used to reach the same goal with less effort. Disregarding the steadily growing area of possible interactions of chemicals with their environment, this article concentrates on interactions between a.i.s in the life-sciences. The terms ‘agent’, ‘drug’, ‘chemical’, and ‘a.i.’ are used interchangeably.
In 1989, Berenbaum [1] summarized the state of the art describing synergistic effects in pharmacology. Since then, numerous attempts to quantify non-additive effects have been published, mainly in the fields of chemotherapy [2], anesthesiology [3], toxicology [4], physiology [5], environmental science [6, 7], and pharmacology [8], to quote only a few reviews.
Generally, biological effects of an a.i. follow a dose-response relation, starting from a no-effect level (NOEL) and ending at the maximum effect corresponding to a saturation dose. In order to quantitatively describe interactions between substances, it is necessary to define a reference behaviour, namely the response of a system of compounds acting independently. Deviations from this ideal reference can then be classified as synergistic or antagonistic, being aware of the fact that these deviations can be caused by a multitude of physico-chemical and biochemical effects, especially in whole organisms (for a recent study see e.g. [9]).
Whenever the effect observed after applying a mixture exceeds the expectation, the action of the agents is called synergistic, and if it is smaller than expected it is antagonistic. This seemingly simple definition is not simple at all, as there is an ongoing debate since the beginning of the last century on how to correctly define this reference of ‘no interaction’. In the literature, synergy is defined either phenomenologically or based on assumptions on the modes of action of the a.i.s involved. The observed effects like zero-interaction, synergism or antagonism, are often quantified by calculating interaction- [10] or combination-indices [11], however, often based on differing definitions of additivity [2, 4].
Mainly two types of reference models are currently in use [12, 13]. One class of models, the Additive Dose Model (ADM) pioneered by Loewe [14], assumes an additive behaviour of doses, similar modes of action and consequently parallel dose-response curves with identical slopes. Its basic concept is that of equipotent doses, which means that an arbitrary dose of a.i. A can be replaced by an isoeffective dose of a.i. B. The terms ‘effect summation’, ‘dose addition’, and ‘concentration addition (CA)’ are used in this context. As the joint action of the a.i.s is not independent in this model, the term ‘mutually exclusive’ [11] is more appropriate here. Implicitly the model assumes that the maximum possible effect achievable by the mixture is that of its most potent partner. A generalized concentration addition (GCA) model [6] extended the original ADM approach [10, 14–16] to mixtures with partially overlapping agonists.
The other class of models, called Multiplicative Survival Models (MSM), assumes that the effects caused by the two a.i.s are mutually non-exclusive and originate from different modes of action, and hence the asymptotically achievable effect is the sum of the individually possible ones. In agrochemical research, it is associated with the names of Colby [17] and Limpel [18], while in toxicology these models of independent action (IA) have been described by Bliss [19] and Finney [20] and in entomology by Abbott [21].
Chou’s widely used combination indices [11] cover both classes, his formula for the mutually exclusive combination is of ADM type while his description of mutually non-exclusive mixtures is MSM like and reduces to Colby’s formula for reaction orders of one. The approach presented here relies neither on Bliss independence or Loewe additivity nor uses Chou’s unified general theory. It focuses on logistic (Hill) response surfaces as ‘null-effect’ models. For mixtures of n partners they result from solving an n-dimensional partial differential equation (PDE). Appropriate boundary conditions guarantee that the expressions describing the Hill-surfaces are asymptotically correct, i.e., lead to Hill’s well-known dose-response curves in the one-dimensional case of pure a.i.s. In addition, the solutions are sham-compliant, meaning that a mixture consisting of combinations of a drug with itself shows no synergistic effect.
Sigmoid dose-response curves like Hill’s equation [22, 23] are solutions of a class of ordinary differential equations (ODEs) which was originally used to describe population dynamics [24]. Examples of the phenomena described by this type of functions are titration curves in chemistry, dose-response curves in enzyme kinetics, and predator-prey models in biology.
Following a short recapitulation of the ODE leading to Hill-type dose-response curves for pure compounds, Hill response surfaces for binary and n-component mixtures are introduced as solutions of the corresponding PDEs. In the subsequent sections the properties of Hill surfaces are compared to other response surface models and applied to some literature examples, namely binary and ternary mixtures from various fields of life-science. A summary of our findings will be given in the last section.
Methods
While Hill’s equation can be obtained by solving a first-order ODE, the logistic differential equation, its n-dimensional generalization results from solving a semilinear PDE with the appropriate boundary conditions. These are the requirements that in the limit of one dimension the original Hill equation results, and that the solution of the PDE is sham-compliant, meaning that an artificial partitioning of the one-dimensional problem into an n-dimensional one does not change the results.
Here an analytical expression of the n-dimensional extension of Hill’s equation is provided. Verification is done by substituting the solution into the PDE by using Mathematica 11 [25]. Checking the fulfillment of the boundary conditions is achieved by performing the corresponding limiting processes.
Results
Logistic functions and the Hill response surface
Let A and B be active ingredients with dose-response curves a(x) and b(y) depending on the variables x and y and let U be a combination of A and B with the dose-response surface u(x,y). Let us further assume that we can describe the effect z (being a(x), b(y) or u(x,y)), by a logistic function. Then z is characterized by 4 parameters, the minimum and maximum responses z min and z max, the position of the inflection point and a slope parameter, i.e., the slope at the inflection point of the curve. All effects are limited by the no-effect- and the full-effect levels, 0≤z min≤z≤z max≤1.
The differential equations for the one- and two-dimensional cases, describing the variation of the effects a(x), b(y) and u(x,y) with the variation of x and y, are
| 1 |
| 2 |
where u x=∂ u(x,y)/∂ x and u y=∂ u(x,y)/∂ y denote the partial derivatives of u, and α, β and a max, b max are constants. In Eq. 2, γ and u max are functions of x and y.
Denoting by x 50 and y 50 the positions of the half-maximum effects a(x 50)=a max/2 and b(y 50)=b max/2 the final forms of a(x) and b(y) are the logistic functions
| 3 |
with Δ x=x−x 50, Δ y=y−y 50 and α and β being the slopes at the inflection points x 50 and y 50. They show an exponentially increasing effect at low doses, becoming linear close to x=x 50 and y=y 50 and finally an exponentially decreasing growth until the limiting effect z max is reached. a(x) and b(y) are intimately connected to Hill’s equation, providing a relation between the effect E and the dose C.
| 4 |
Actually, x and y are the natural logarithms of doses with −∞≤x,y≤∞, whereas the doses themselves (i.e., e x and e y) are ≥0. Hence, we can identify the effects E 0, E max and the shape parameter α with z min, z max and α or β, and the doses C and EC 50 with e x and or e y and of Eq. 3, meaning that Hill’s equation is the solution of a logistic ODE, subject to the appropriate boundary conditions.
Our approach to handle mixtures is completely analogous to that used for the pure compounds. The solution of the PDE describing the effect u(x,y) of a binary mixture (Eq. 2) is the logistic Hill-surface as the response surface of ‘null-interaction’.
| 5 |
The boundary condition
that in the limit of one vanishing agent the response due to the second one has to result, and the so-called sham-compliance requirement have to be fulfilled: If a dose d of one a.i. is artificially split into two contributions n d and (1−n)d with 0≤n≤1, the response due to this ’mixture’ has to be identical to the response of the pure compound, i.e., a(d)=u(n×d,(1−n)×d), irrespective of any possible interaction between different a.i.s. In our formalism a dose d is equal to e x. Hence, sham partitioning means setting e x=n e x+(1−n)e x, leading to the requirement u(x+ lnn,x+ ln(1−n))=a(x).
These conditions are satisfied by the ansatz
| 6 |
which provides smooth transitions between α and β and between a max and b max.
To facilitate a comparison with literature expressions for response surfaces, u Hill can be re-written by substituting the doses d a and d b for e x and e y and using the doses scaled by their median effects and . Then the ‘null-interaction’ reference response surface is
| 7 |
with
| 8 |
As the ansatz presented here uses the known dose-response curves of the pure mixture partners to unambiguously define the ‘null-interaction’ surface for the binary mixture, there is no obvious way to introduce interaction parameters (and functions) which account for deviations from this reference [26–28]. At present the only way to detect synergism or antagonism is the direct comparison of experimental data with the Hill response surface, either visually or by statistical means like the root-mean squared error of prediction (RMSE).
A way out of this dilemma might be to obtain the necessary parameters directly from fitting the experimental mixture data to a logistic surface which could then be compared to the ‘null-interaction’ model. However, the functional form of u Hill is not flexible enough for this purpose and some sort of perturbation theory might be more appropriate to handle deviations from the Hill surface.
The logistic PDE for mixtures of n components
The extension of the Hill formalism to mixtures of n agents A i is straightforward. The corresponding semilinear logistic PDE [29] is
| 9 |
where and . Its solution
| 10 |
with
describes an n-dimensional logistic surface. It satisfies the boundary conditions,
and the sham compliance condition, that any partition of the dose of a pure drug into various artificial new drugs must cause the same effect as the pure drug alone.
As an example, u Hill for a ternary mixture of A, B and C satisfying the sham condition a(d)=u((n−m)×d,(1−n)×d,m×d) with 0≤n+m≤1, is
where in a self-explaining notation
Discussion
From a theoretical point of view it is an advantage of the Hill surface approach that it does not rest on assumptions on maximum effects or restrictions on specific parameter combinations of the mixture components. This distinguishes our approach from other response surface models as will be outlined in the next section. In practical applications, however, these differences become significant only if steep dose-response curves and/or strongly differing maximum-effect parameters of the individual agents are involved.
A Comparison of empirical response surface models
Many of the response surface models are based on two synergy approaches, the Bliss independence [19, 20] and Loewe additivity [14] models. The characteristics of some of them are listed in Table 1. There their functional forms describing the mixture effects are classified by their assumptions on maximum effects and slopes and by analyzing whether they are asymptotically correct and sham compliant. Apparently only a few authors [26, 28, 30] use the freedom to define the shape function and the maximum effect function (Eq. 6).
Table 1.
Characteristics of theoretical models describing mixtures
| Assumptions | Properties | ||||
|---|---|---|---|---|---|
| Approach | Eq. | u max | Slopes γ | Pure a.i. limit | Sham compliance |
| Bliss / Colby | 13 | Unequal | γ a≠γ b | Ok | No |
| Loewe / CA | 14 | Equal | γ a=γ b | Ok | Yes |
| GCA | 18 | Unequal | γ=1 | Ok | Yes |
| Chou exc | 19 | Equal | γ a=γ b | Ok | Yes |
| Chou nonex | 20 | Equal | γ a=γ b | Ok | No |
| Greco | 17 | Equal | γ a≠γ b a | (Ok)b | (Yes)b |
| Minto / Fidler | 21 | Variable | Variable | (Ok)c | (Yes)c |
| Hill | 5, 7 | Variable | Variable | Ok | Yes |
aanalytical expression for the effect only for identical slopes
bfor α=0
cif the polynomial expansions are truncated after the linear terms
Bliss independent joint action (IA) [3] can be formulated in terms of fractions of possible response unaffected fu or fractions affected fa, with fa + fu=1. For a binary mixture Fu ab=fu a×fu b and Fa ab=1−Fu ab. Hence
| 11 |
It is related to the expression for the probability P(A∪B) of an event A or B if the basic events with probabilities P(A) and P(B) are independent. In crop science it is known as MSM [13] or Colby [17] model and is widely used to classify mixture effects [31]. Recently Colby’s formula has been extended to multi-compound mixtures [32]. As the IA ansatz is not sham-compliant it is not compatible with the Hill approach.
| 12 |
| 13 |
The ADM [13] or CA model of mutually exclusive action [1, 14] for two noninteracting isoactive drugs A and B is
| 14 |
where f x −1 is the dose or concentration of compound x that causes the specified effect. If the agents are acting according to Hill dose-response functions with slopes γ a and γ b, it is given by
| 15 |
Adapting Berenbaum’s approach, Greco derived a model for two-agent combined action by adding an interaction term, parameterized by a factor α. Assuming that the Hill-type dose-response curves of A and B differ only in the slope parameters, he gets [33]
| 16 |
Although analytical expressions for u can be obtained from Eqs. 15 and 16 only under the restrictions of either a fixed maximum effect a max=b max and identical slope parameters γ a=γ b or of different maximum effects and identical slopes of unity γ a=γ b=1, they are the starting points for several response surface models, e.g., Greco’s model from Eq. 16
| 17 |
or the GCA expression [6] from Eq. 15. It permits different maximum effects but is limited to γ=1.
| 18 |
Hence, u Greco (for α=0) and u GCA are special cases of u Hill. The same holds true for Chou and Talalay’s mutually exclusive model [11]. It was derived from the the median effect principle, assuming both a constant u max and γ
| 19 |
Their mutually non-exclusive model [11] is an ad hoc extension of Eq. 19
| 20 |
Although it has been criticized by several authors [1, 5, 33] because of its questionable validity, it is one of the most often used models in the literature [34]. For γ=1 it becomes the Bliss IA expression (Eq. 13, with α=β=1 and u max=a max=b max). Chou’s models are related to Greco’s expression for identical slopes γ=γ a=γ b and identical u max, i.e., for α=0 and for α=1.
Minto [30] proposed a model that solved the problem of the different denominators in Eq. 15 by expanding u max and γ in polynomials in a parameter Θ. Fidler [28] extended Minto’s approach by adding an interaction term. Their model is
| 21 |
where α indicates the type of interaction. Minto’s model corresponds to α=0, α>0 means synergism and α<0 antagonism. f(s,w,Θ p) resembles a generalized Γ-distribution, and u max(Θ p) and γ(Θ p) are functions of the potency fraction Θ p and f(s,w,Θ p). Θ p ranges from 0 (drug A only) to 1 (drug B only).
Minto’s model differs from the logistic Hill surface only in the functional forms of u max and γ. By truncating their polynomial ansatz for u max and γ after the linear terms in Θ p, we have
Thus by making γ(Θ p) and u max(Θ p) symmetric with respect to m a and m b, u Minto becomes identical to u Hill. However, inclusion of higher powers of Θ p leads to violations of the boundary conditions and the sham compliance requirement.
Examples
As identical theoretical concepts handling mixture effects have been developed by scientists from different disciplines, there is some confusion in the nomenclature used in the literature. We shall use the term ’Bliss independent action’ in the subsequent discussions when referring to the probabilistic independent action ansatz, the exception being examples from agrochemistry, where we use the term ‘Colby’s formula’. This is justified because of its extensive use in the agrochemical literature.
In general, however, one has to keep in mind that a numerical evaluation of a model by comparison with experimental data is difficult because often the error bars of the experiments are large or unknown.
Crop protection agents
To demonstrate the applicability of the Hill model old mixture data from the crop protection area were chosen. All pesticides involved achieve an u max of 100%. For the pairs of atrazine/alachlor [12] (herbicides), aldrin/dieldrin [35] (insecticides), and oxadixyl/mancozeb [36] (fungicides) the root mean square errors of prediction are shown in Table 2. The mixtures are equally well described by using variable slopes or slopes of 1. For all pairs of pesticides the original conclusions are confirmed: neither the herbicide- nor the insecticide-mixtures show deviations from the ’expected’ response, whereas in the case of the fungicide mixtures the differences between expection and experiment indicate the presence of synergism.
Table 2.
Dependence of agrochemical mixture effect predictions on Hill parameters
| Slope γ=1 | Slope γ variable | ||||
|---|---|---|---|---|---|
| Ligand | X 50 a | RMSEb | X 50 a | Slope | RMSEb |
| Atrazine | 0.057 | 0.059 | 0.96 | ||
| Alachlor | 0.082 | 0.076 | 1.45 | ||
| Atrazine + Alachlor | 9 | 9 | |||
| Aldrin | 0.008 | 0.010 | 2.20 | ||
| Dieldrin | 0.004 | 0.005 | 1.95 | ||
| Aldrin + Dieldrin | 10 | 8 | |||
| Oxadixyl | 18 | 19 | 1.37 | ||
| Mancozeb | 294 | 293 | 0.99 | ||
| Oxadixyl + Mancozeb | 25 | 26 | |||
All pesticides are assumed to achieve individual maximum effects of 100%. The magnitude of the deviations of mixture predictions from the experimental data is an indication of synergistic effects
a LC 50 (in kg/ha) for herbicides, LD 50 (in g a.i./100 ml kerosene solution) for insecticides, EC 50 (in mg/l) for fungicides;
broot-mean-square error of efficacy prediction for mixture
Pyrethroids
Mixtures of pyrethroids can act both as synergists and antagonists. While permethrin/etofenprox and permethrin/cypermethrin show antagonism, cypermethrin/etofenprox act synergistically. These effects are only insufficiently described by percentages of 41, 58 and 332% [37] measuring the deviation from additivity. The full picture is given in Fig. 1, where Hill-, Bliss- and experimental dose-responses curves are overlaid with the Hill response surfaces. In this example the differences between the theoretical models are extraordinarily large. The contour plots of u Hill−u Colby reveal that especially for x≤x 50 and y≤y 50 Colby’s independent action formula predicts much lower effects than the Hill model. As compared with the latter, the IA approach underestimates antagonism and overestimates synergism. These large differences are caused by the extremely steep dose response curves of permethrin (λ=25), etofenprox (λ=11) and cypermethrin (λ=106), meaning that the effects vary strongly within very narrow dose-ranges.
Fig. 1.
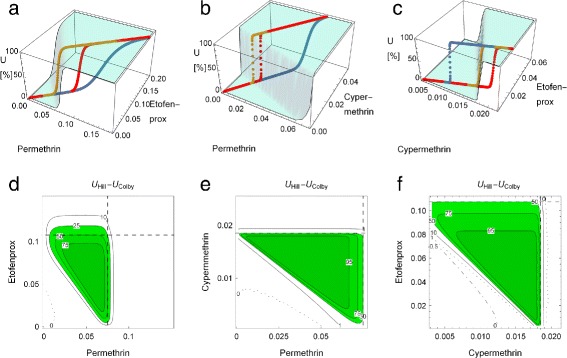
Hill (green), Colby (red) and experimental (blue) mortality curves for pyrethroid mixtures, together with the Hill response surfaces (cyan). Mortality in %, doses in μ g/cm 2. a permethrin + etofenprox (antagonistic) b permethrin + cypermethrin (antagonistic) c cypermethrin + etofenprox (synergistic); d-f Contour plots of differences between Hill- and Colby-surfaces (in %) for a, b and c. Dashed lines indicate the respective EC 50 values
Dioxin-like chemicals
Aryl hydrogen receptor (AhR) ligands were used to compare the toxic equivalence factor (TEF) approach and the more general GCA ansatz by [38] in predicting the expected effect of mixtures containing partial agonists or competitive antagonists. From their supplementary material the Hill curves with variable γ were derived and used to predict u Hill. GCA surfaces are Hill-surfaces with slopes of γ=1. Hence, one might expect that Hill-surfaces with variable γ exhibit slightly improved Mann-Whitney (MW) statistics. However, as the slope parameters from the fits are only marginally different from 1 (c.f. Table 3), the differences between the GCA and Hill in the E max-, EC 50-values and consequently in their response surfaces (not shown) are much smaller than the error bars of the experimental data, while the surface predictions are of comparable quality.
Table 3.
AhR agonist parameters from GCA- and Hill-fits for mixture predictions
| GCA, γ=1 [38] | Hill, γ variable | ||||||
|---|---|---|---|---|---|---|---|
| Ligand | E max(%) | EC 50(M) | MWa | E max(%) | EC 50(M) | γ | MWa |
| TCDFb | 100 | 2.9×10⁻¹¹ | 100 | 3.2×10⁻¹¹ | 0.88 | ||
| PCB126c | 99 | 4.1×10⁻¹⁰ | 100 | 4.5×10⁻¹⁰ | 0.82 | ||
| TCDF + PCB126 | 0.86 | 0.86 | |||||
| TCDDd | 100 | 7.6×10⁻¹² | 100 | 6.3×10⁻¹² | 1.29 | ||
| PCB105 | 61 | 1.4×10⁻⁶ | 56 | 9.2×10⁻⁷ | 1.45 | ||
| TCDD + PCB105 | 0.63 | 0.78 | |||||
| TCDD | 100 | 9.9×10⁻¹² | 100 | 8.5×10⁻¹² | 1.09 | ||
| Galangin | 30 | 4.1×10⁻⁶ | 35 | 4.7×10⁻⁶ | 0.79 | ||
| TCDD + Galangin | 0.79 | 0.93 | |||||
| TCDD | 100 | 9.1×10⁻¹² | 100 | 6.5×10⁻¹² | 1.22 | ||
| DIMe | 8 | 6.6×10⁻⁶ | 10 | 8.5×10⁻⁶ | 1.62 | ||
| TCDD + DIM | 0.65 | 0.44 | |||||
Parameters are slopes γ, maximum effects E max and EC 50 values of the agents
aMW = Mann-Whitney test for mixture prediction;
b2,3,7,8-tetrachlorodibenzofuran;
c2,3,3’,4,4’-petachlorobiphenyl;
d2,3,7,8-tetrachlorodibenz-p-dioxin;
e3,3’-diindolylmethane
Response surfaces and isoboles
As the classification of mixture effects in terms of interaction indexes is not an adequate means to describe this complex phenomenon, an analysis of responses by looking at the form of iso-effect levels, isoboles, is certainly more appropriate [10, 14, 16]. Deviations from straight lines were used to classify the effects as (Loewe and Bliss) agonistic or antagonistic. From a response surface view [3, 33, 39] isoboles are cuts of the response surface at defined effect levels and the corresponding contour plots are the easiest way to get a full picture for the whole range of dose-combinations. This facilitates the understanding of the fact that linear isoboles are the exception and not the rule and are not a general means of detecting synergism. For critical discussions on the interpretation of the shape of isoboles see, e.g., [5, 40–42].
Here simulated dose-response surfaces are compared, based on two different drugs A and B, both acting according to Hill’s formula. The following parameters were used: Maximum effects a max=0.7, b max=1, median effects , , (i.e., x 50=2, y 50=0), and slopes α=1, β=2.
The comparison will be mainly between u Hill and u Bliss=u Colby, as the GCA model u GCA and Chou’s mutually exclusive model are special cases of the logistic surface u Hill, and under special assumptions Chou’s mutually non-exclusive model reduces to Bliss IA.
In Fig. 2 differences between the two surfaces show up at high doses of both mixture partners. There IA would find large synergistic effects of up to 30% where the Hill model would indicate ‘null-interaction’.
Fig. 2.
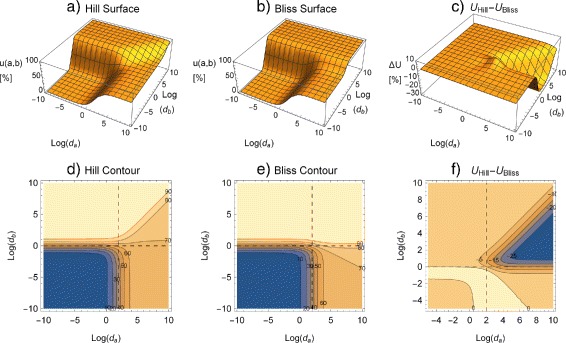
Response surfaces (a–c) and isoboles (d–f) for binary mixtures. Effects are given in %. a, d Hill surface; b, e Bliss surface; c, f Difference plots u Hill−u Bliss show that u Bliss≥u Hill. (Parameters: u min=0, a max=0.7, , α=1, b max=1.0, , β=2). Dashed lines denote the respective d 50 values
Some trends can be observed: For identical maximum effects and slopes, u Hill−u Bliss is positive at doses below d 50 and increases with increasing u max and λ, and it is negative else, almost independent of the dose range. This means that Bliss independent action tends to overestimate synergism at doses smaller than their median effect doses and to underestimate synergism at doses above. At low doses the size of the difference increases with u max and λ. If the maximum effects differ, the effect differences at higher doses increase with increasing a max−b max. Some of these findings are illustrated in Fig. 3 for binary mixtures of agents with identical parameters: maximum effects (u max=1 and u max=0.4) were combined with three different slope parameters (λ=0.5,1.0,5.0). Using scaled doses m=d/d 50 for the axes simplifies the picture without obscuring the essentials.
Fig. 3.
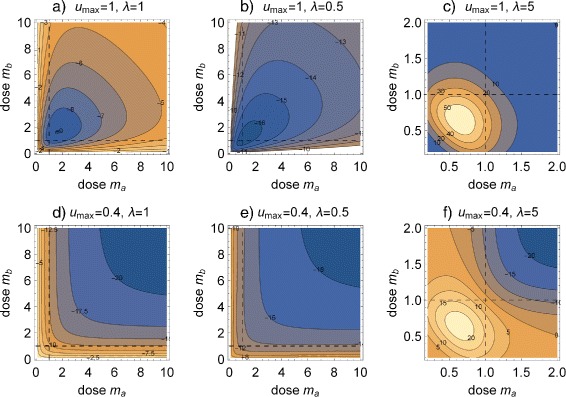
Contour plots of differences u Hill−u Bliss between Hill- and Bliss-response surfaces (in %). Shown for three slope parameters λ=1, 0.5 and 5 for agents A and B. a – c u max=1, d – f u max=0.4. Dashed lines indicate effects at normalized doses m x=1
Iso-surfaces
For ternary mixtures the pendants of isoboles are iso-surfaces, i.e., projections of the four-dimensional response surfaces to three-dimensional ones defined by triples of doses leading to a specified response. A visualization of effects resulting from more than three agents in one graphical object is hardly possible. As shown for some fictitious ternary mixtures in Fig. 4, planarity is achieved only if all mixture components have identical slope parameters. In this case different maximum effects of the mixture partners do not affect planarity. Iso-surfaces of mixtures of agents having different slopes are non-planar.
Fig. 4.
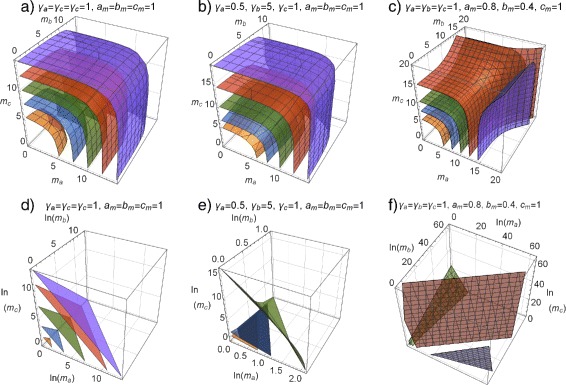
Iso-surfaces for ternary mixtures at 10, 25, 50, 75 and 90% effect levels. Shown on logarithmic (a–c) and linear (d–f) dose scales. a, d sham combination, α=1,u max=1; b, e Mixture with variable slopes, α=0.5,β=5,γ=1 and u max=1; c, f Mixture with variable maximum effects, a max=0.8, b max=0.4, c max=1 and slope λ=1
This is shown for ternary anesthetic mixtures [43] as analyzed in great detail by [28] and [30]. For the present purpose the data for midazolam, propofol, and alfentanil were fitted to Hill dose-response curves assuming effect ranges from 0 (no hypnosis) to 1 (full hypnosis). The characteristics of fits and of predictions for the mixtures are summarized in Table 4. The corresponding iso-surfaces in Fig. 5 show slight deviations from planarity which result from different slopes (4.8–11.1) of the pure agents. As the Hill model provides only null-interaction surfaces, the size of the deviations of experimental data from the Hill prediction may give some hints on the presence of synergy. While the RMSEs of fit for the pure compounds are of the order of 5%, those for mixture prediction are of the order of 40%, indicating the presence synergistic effects of increasing magnitude for the binary mixtures of propofol/alfentanil, midazolam/propofol and midazolam/alfentanil, while the ternary mixture is comparable to the best binary one.
Table 4.
Fit parameters for anesthetics and their mixtures
| Drug | D 50(mg/kg) | Slope | RMSEa |
|---|---|---|---|
| Midazolam | 0.144 | 4.83 | 0.054 |
| Propofol | 1.078 | 11.14 | 0.035 |
| Alfentanil | 0.093 | 5.69 | 0.069 |
| Midazolam/propofol | 0.387 | ||
| Midazolam/alfentanil | 0.477 | ||
| Propofol/alfentanil | 0.228 | ||
| Ternary mixture | 0.461 |
aRMSE = root-mean-square error with respect to exptl. data. For pure compounds RMSE refers to fits, for mixtures it refers to predictions
Fig. 5.
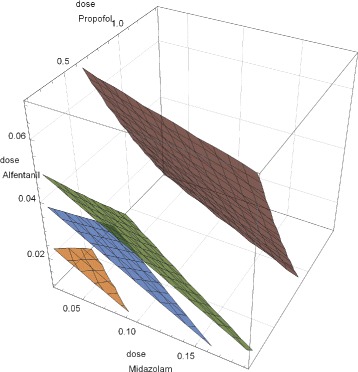
Iso-surfaces (10, 50, 75, and 99%) for ternary mixtures of midazolam, propofol, and alfentanil. Doses in [mg/kg]. Deviation from planarity results from differing slopes of the individual anesthetics
Conclusions
Starting from a logistic PDE, analytical expressions for the response surfaces of n-component mixtures have been derived under the sole provision that each a.i. is described by a sigmoid dose-response curve. No further assumptions are required. The resulting ‘null-interaction’ surfaces, i.e., Hill-surfaces in the absence of of synergistic or antagonistic effects, provide the ‘expected’ response for each dose combination. Deviations from this reference response in order to quantify synergism or antagonism should possibly be handled by some sort of perturbation theory.
The Hill approach provides a framework to classify several models describing mixtures like ADM (Loewe CA, GCA), MSM (Colby, Bliss, Finney, Abbott) or Chou’s ‘unified general theory’ and various response surface models. It can be applied to mixtures of compounds having different maximum effects and differing slope-parameters. Many Loewe-additivity based approaches are found to be special cases of the Hill surface while Bliss IA is incompatible with the logistic ansatz.
The independent action model is frequently used, e.g., in patent applications to quantify synergistic effects [44]. Its outcome should be checked by comparison with the Hill response surface for any relevant mixture ratio. From the literature examples discussed two scenarios can be distinguished: For slopes of γ≈1 the response surfaces calculated from MSM formulae, deviate from the Hill surface by predicting synergism where the Hill model indicates ‘null-interaction’, especially at doses below the d 50-values of the components. In fact, under these conditions synergism postulated by MSM is an upper boundary for the synergism predicted by the Hill surface approach. However, if both mixture partners alone can cause effects of 100% or if the differences between their slopes are small either the deviations or the dose ranges affected are small.
For γ≫1 the differences between Hill- and MSM-surfaces become extremely large, but they are restricted to those small dose-ranges where the effects change rapidly.
As a consequence for claiming synergistic effects at doses below the respective d 50-values, special caution is required whenever the predictions from MSM and Hill approaches differ considerably.
An in-depth analysis of real mixtures would have to take into account not only errors in the models but also other sources of errors like the error statistics of experimental data.
Acknowledgements
The author thanks M.E.Beck, P.Genix (BayerCropScience), A. and F.Schindler (University of Muenster).
Funding
No funding was received.
Availability of data and materials
Not applicable.
Abbreviations
- ADM
Additive dose model
- AhR
Aryl hydrogen receptor
- CA
Concentration addition
- EC50
Effective concentration 50
- GCA
Generalized Concentration addition
- IA
Independent action
- LC50
Lethal concentration 50
- LD50
Lethal dose 50
- MSM
Multiplicative survival model
- MW
nonparametric Mann-Whitney U test
- NOEL
No-effect level
- ODE
Ordinary differential equation
- PDE
Patial differential equation
- RMSE
Root-mean-square error
- TEF
Toxic equivalence factor
- uBliss
Bliss independent action response
Chou’s mutually non-exclusive response
Chou’s mutually exclusive response
- uColby
Bliss independent action response
- uGreco
Loewe additivity based response
- uGCA
Generalized concentration addition response
- uHill
Hill response surface
- u(Θp)
Minto’s and Fidler’s polynomial response
Ethics approval and consent to participate
Not applicable.
Consent for publication
Not applicable.
Competing interests
The author declares that he has no competing interests.
Publisher’s Note
Springer Nature remains neutral with regard to jurisdictional claims in published maps and institutional affiliations.
References
- 1.Berenbaum MC. What is Synergy? Pharmacological Rev. 1989;1989(41):93–141. [PubMed] [Google Scholar]
- 2.Pichard MN, Shipman CJ. A three-dimensional model to analyze drug-drug interactions. Antivir Res. 1990;14:181–206. doi: 10.1016/0166-3542(90)90001-N. [DOI] [PubMed] [Google Scholar]
- 3.Lee S-i. Drug interaction: focusing on response surface models. Korean J Anesthesiol. 2010;58(5):421–34. doi: 10.4097/kjae.2010.58.5.421. [DOI] [PMC free article] [PubMed] [Google Scholar]
- 4.Bosgra S, van Eijkeren JCH, Slob W. Dose addition and the isobole method as approaches for predicting the cumulative effect of non-interacting chemicals: A critical evaluation. Crit Rev Toxicol. 2009;39(5):418–26. doi: 10.1080/10408440902787592. [DOI] [PubMed] [Google Scholar]
- 5.Geary N. Understanding synergy. Am J Physiol Endocinol Metabol. 2013;304:237–53. doi: 10.1152/ajpendo.00308.2012. [DOI] [PubMed] [Google Scholar]
- 6.Howard GJ, Webster TF. General concentration addition: A method for examining mixtures containing partial agonists. J Theor Biol. 2009;259:469–77. doi: 10.1016/j.jtbi.2009.03.030. [DOI] [PMC free article] [PubMed] [Google Scholar]
- 7.Cedergreen N. Quantifying synergy: A systematic review of mixture toxicity studies with environmental toxicology. Plos ONE. 2014;9(5):1–12. doi: 10.1371/journal.pone.0096580. [DOI] [PMC free article] [PubMed] [Google Scholar]
- 8.Foucquier J, Guedj M. Analysis of drug combinations: current methodological landscape. Pharmacol Res Perspect. 2015;3(e00149):1–11. doi: 10.1002/prp2.149. [DOI] [PMC free article] [PubMed] [Google Scholar]
- 9.Cokol M, Chua HN, Tasan M, Mutlu B, Weinstein ZB, Suzuki Y, Nergiz ME, Constanzo M, Baryshnikova A, Giaever G, Nislow C, Myers CL, Andrews BJ, Boone C, Roth FP. Systematic exploration of synergistic drug pairs. Mol Syst Biol. 2011;7(544):1–9. doi: 10.1038/msb.2011.71. [DOI] [PMC free article] [PubMed] [Google Scholar]
- 10.Loewe S. The problem of synergism and antagonism of combined drugs. Arzneimittelforschung. 1953;3:285–90. [PubMed] [Google Scholar]
- 11.Chou TC, Talalay P. Quantitative analysis of dose-effect relationships: the combined effects of multiple drugs or enzyme inhibitors. Adv Enzyme Reg. 1984;22:27–55. doi: 10.1016/0065-2571(84)90007-4. [DOI] [PubMed] [Google Scholar]
- 12.Morse PM. Some Comments on the Assessment of Joint Action in Herbicide Mixtures. Weed Sci. 1978;26(1):58–71. [Google Scholar]
- 13.Streibig CJ. Assessment of herbicide effects. 2003. http://www.ewrs.org/et/docs/Herbicide_interaction.pdf.
- 14.Loewe S, Muschinek H. Ueber Kombinationswirkungen. Arch Exp Path Pharmak. 1926;114:313–26. doi: 10.1007/BF01952257. [DOI] [Google Scholar]
- 15.Webb JL. Enzyme and Metabolic Inhibitors, vol. 1. New York: Academic Press; 1963. [Google Scholar]
- 16.Tammes PML. Isoboles, a graphical Representation of Synergism in Pesticides. Neth J Plant Path. 1964;70:73–80. doi: 10.1007/BF01974412. [DOI] [Google Scholar]
- 17.Colby SR. Calculating Synergistic and Antagonistic Responses of Herbicide Combinations. Weeds. 1967;15:20–3. doi: 10.2307/4041058. [DOI] [Google Scholar]
- 18.Limpel LE, Schuldt PH, Lamont D. Weed control by dimethylchloroterephthalate alone and in certain combinations. Proc NEWCC. 1962;116:48–53. [Google Scholar]
- 19.Bliss C. The toxicity of poisons applied jointly. Ann Appl Biol. 1939;26:585–615. doi: 10.1111/j.1744-7348.1939.tb06990.x. [DOI] [Google Scholar]
- 20.Finney C. Probit Analysis. Cambridge: Cambridge University Press; 1971. [Google Scholar]
- 21.Abbott WS. A method of computing the effectiveness of an insecticide. J Econ Entomol. 1925;18:265–7. doi: 10.1093/jee/18.2.265a. [DOI] [Google Scholar]
- 22.Hill AV. The possible effects of the aggregation of the molecules of haemoglobin on its dissociation curves. J Physiol. 1910;40:iv-vii.
- 23.Goutelle S, Maurin M, Rougier F, Barbaut X, Bourguignon L, Ducher M, Maire P. The hill equation: a review of its capabilities in pharmacological modelling. Fundam S Clin Pharmacol. 2008;22:633–48. doi: 10.1111/j.1472-8206.2008.00633.x. [DOI] [PubMed] [Google Scholar]
- 24.Verhulst PF. Recherches mathématiques sur la loi d’accroissement de la population. Acad Sci Mém. 1845;18:1–41. [Google Scholar]
- 25.Wolfram S. Mathematica Version 11.0. Champaign: Wolfram Research Inc; 2016. [Google Scholar]
- 26.Whit DB, Slocum HK, Brun Y, Wrzosek C, Greco WR. A new nonlinear mixture response surface paradigm for the study of synergism: A three drug example. Curr Drug Metab. 2003;4:399–409. doi: 10.2174/1389200033489316. [DOI] [PubMed] [Google Scholar]
- 27.Jonger MJ, Svendsen C, Bedaux JJM, Bongers M, Kammenga JE. Significance testing of synergistic/antagonistic, dose level-dependent, or dose ration-dependent effects in mixture dose-response analysis. Environ Toxicol Chem. 2005;24:2701–13. doi: 10.1897/04-431R.1. [DOI] [PubMed] [Google Scholar]
- 28.Fidler M, Kern SE. Flexible Interation Model for Complex Interactions of Multiple Anesthetics. Anesthesiology. 2006;105(2):286–96. doi: 10.1097/00000542-200608000-00011. [DOI] [PubMed] [Google Scholar]
- 29.Evans LC. Partial Differential Equations. Providence, Rhode Island: American Mathematical Society; 2002. [Google Scholar]
- 30.Minto CF, Schnider TW, Short TG, Gregg KM, Gentilini A, Shafer SL. Response Surface Model for Anesthetic Drug Interactions. Anesthesiology. 2000;92:1603–16. doi: 10.1097/00000542-200006000-00017. [DOI] [PubMed] [Google Scholar]
- 31.Richer DL. Synergism-a Patent View. Pestic Sci. 1987;19:309–15. doi: 10.1002/ps.2780190408. [DOI] [Google Scholar]
- 32.Soller H, Wedemeier A. Prediction of synergistic multi-compound mixtures - a generalized colby approach. Crop Prot. 2012;42:180–5. doi: 10.1016/j.cropro.2012.07.001. [DOI] [Google Scholar]
- 33.Greco WR, Bravo G, Parsons JC. The search for synergy: A critical review from a response surface perspective. Pharmacol Rev. 1995;47(2):331–85. [PubMed] [Google Scholar]
- 34.Chou TC. Theoretical basis, experimental design, and computerized simulation of synergism and antagonism in drug combination studies. Pharmacol Rev. 2006;58(3):621–81. doi: 10.1124/pr.58.3.10. [DOI] [PubMed] [Google Scholar]
- 35.Sun YP, Johnsson ER. Analysis of joint action of insecticides against house flies. J Econ Entomol. 1960;53(5):887–92. doi: 10.1093/jee/53.5.887. [DOI] [Google Scholar]
- 36.Samoucha Y, Gisi U. Possible explanation of synergism in fungicide mixtures against phythophthora infestans. Ann Appl Biol. 1987;110:303–11. doi: 10.1111/j.1744-7348.1987.tb03260.x. [DOI] [Google Scholar]
- 37.Schleier III, Peterson RKD. The Joint Toxicity of Type I, II, and Nonester Pyrethroid Insecticides. J Econ Entomol. 2012;105(1):85–91. doi: 10.1603/EC11267. [DOI] [PubMed] [Google Scholar]
- 38.Howard GJ, Schlezinger JJ, Hahn ME, Webster TF. Generalized Concentration Addition Predicts Joint Effects of Aryl Hydrocarbon Receptor Agonists with Partial Agonists and Competitive Antagonists. Environ Health Perspect. 2010;118(5):666–72. doi: 10.1289/ehp.0901312. [DOI] [PMC free article] [PubMed] [Google Scholar]
- 39.Yaday B, Wennerberg B, Aittokallio T, Tang J. Searching for synergy in complex dose-response landscapes using an interaction potency model. Comput Struct Biotechnol J. 2015;13:504–13. doi: 10.1016/j.csbj.2015.09.001. [DOI] [PMC free article] [PubMed] [Google Scholar]
- 40.Suehnel J. Assessment of interaction of biologically active agents by means of the isobole approach: fundamental assumptions and recent developments. ACES. 1992;4(3):35–44. [Google Scholar]
- 41.Boucher AN, Tam VH. Mathematical formulation of additivity for antimicrobial agents. Diagn Microbiol Infect Dis. 2006;55:319–25. doi: 10.1016/j.diagmicrobio.2006.01.024. [DOI] [PubMed] [Google Scholar]
- 42.Tallarida RJ. Interactions between drugs and occupied receptors. Pharmacol Ther. 2007;113(1):197–209. doi: 10.1016/j.pharmthera.2006.08.002. [DOI] [PMC free article] [PubMed] [Google Scholar]
- 43.Short TG, Plummer JL, Chui PT. Hypnotic and anesthetic interactions between midazolam, propofol and alfetanil. Br J Anesth. 1992;69:162–7. doi: 10.1093/bja/69.2.162. [DOI] [PubMed] [Google Scholar]
- 44.Richer DL. Synergism - a Patent View. Pestic Sci. 1987;19:309–15. doi: 10.1002/ps.2780190408. [DOI] [Google Scholar]
Associated Data
This section collects any data citations, data availability statements, or supplementary materials included in this article.
Data Availability Statement
Not applicable.