Abstract
Context:
Garcinia cowa is a medicinal plant widely grown in Southeast Asia and tropical countries. Various parts of this plant have been used in traditional folk medicine. The bark, latex, and root have been used as an antipyretic agent, while fruit and leaves have been used as an expectorant, for indigestion and improvement of blood circulation.
Aims:
This study aims to determine the concentration of rubraxanthone found in ethyl acetate extract of the stem bark of G. cowa by the high-performance thin-layer chromatography (HPTLC).
Materials and Methods:
HPTLC method was performed on precoated silica gel G 60 F254 plates using an HPTLC system with a developed mobile-phase system of chloroform: ethyl acetate: methanol: formic acid (86:6:3:5). A volume of 5 μL of standard and sample solutions was applied to the chromatographic plates. The plates were developed in saturated mode of twin trough chamber at room temperature. The method was validated based on linearity, accuracy, precision, limit of detection (LOD), limit of quantification (LOQ), and specificity. The spots were observed at ultraviolet 243 nm.
Results:
The linearity of rubraxanthone was obtained between 52.5 and 157.5 ppm/spot. The LOD and LOQ were found to be 4.03 and 13.42 ppm/spot, respectively.
Conclusion:
The proposed method showed good linearity, precision, accuracy, and high sensitivity. Therefore, it may be applied for the quantification of rubraxanthone in ethyl acetate extract of the stem bark of G. cowa.
SUMMARY
High performance thin layer chromatography (HPTLC) method provides rapid qualitative and quantitative estimation of rubraxanthone as a marker com¬pound in G. cowa extract used for commercial product
Rubraxanthone found in ethyl acetate extracts of G. cowa was successfully quantified using HPTLC method.
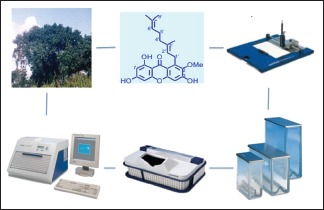
Abbreviations Used: TLC: Thin-layer chromatography, HPTLC: High-performance thin-layer chromatography, LOD: Limit of detection, LOQ: Limit of quantification, ICH: International Conference on Harmonization.
Key words: Chromatography, densitometry, Garcinia cowa Roxb., high-performance thin-layer chromatography, rubraxanthone, validation
INTRODUCTION
Various parts of Garcinia cowa, usually called asam kandis, are utilized by ancient people. The bark, latex, and root are used as antipyretic agents, whereas fruit and leaves have been used as an expectorant, for indigestion and improvement of blood circulation.[1]
Previously, rubraxanthone 1 has been isolated as a major component of the stem bark of G. cowa.[2] This compound has antimicrobial and antioxidant activities.[3,4] It also has anticancer activity against MCF-7, DU-145, and H-460[5] as well as can reduce total cholesterol and triglyceride levels in the blood of male rats.[6]
Due to great health benefits of phytochemicals, a special attention is being given to determine the quality, efficacy, and standards of the herbal raw material. A previous study on method development for identification of rubraxanthone in methanolic extract of bark of Garcinia spp. has been reported using HPLC method.[7] Method development for identification of α-mangostin in methanolic extract of bark of G. cowa has also been reported with the same method.[8] However, to the best of our knowledge, the rapid screening method for the determination of rubraxanthone in G. cowa using high-performance thin-layer chromatography (HPTLC) has not been established yet, and there is a need for rapid qualitative and quantitative method for herbal extract as a part of quality control in a commercial product. The aim of the present study was to develop and validate the HPTLC method for quantification of rubraxanthone [Figure 1] in ethyl acetate extract of the stem bark of G. cowa.
Figure 1.
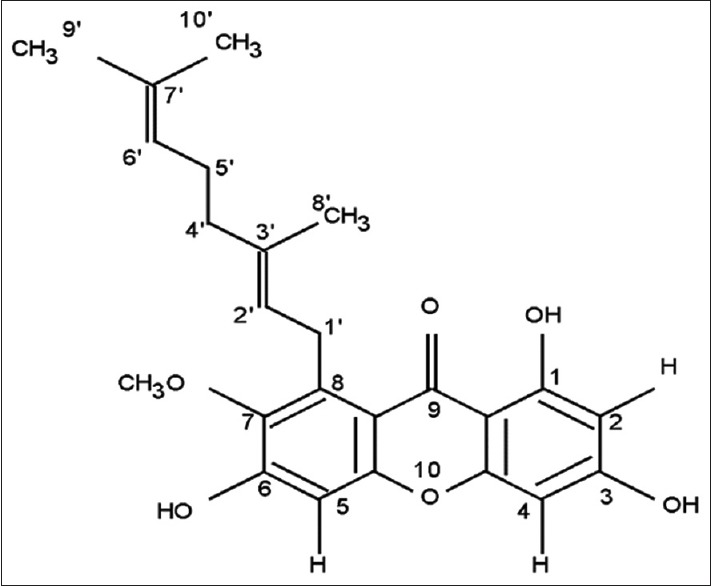
Rubraxanthone
MATERIALS AND METHODS
Chromatographic condition
HPTLC analysis was performed using an HPTLC system (CAMAG, Switzerland) with several mobile-phase systems. Precoated silica gel 60 F254 TLC plates (20 cm × 20 cm), layer thickness of 0.2 mm (E. Merck KGaA, Darmstadt, Germany), were used as stationary phase. A volume of 5 μL standard and sample solutions were applied to the chromatographic plates using CAMAG Nanomat 4 semiautomatic TLC sampler. The standard solutions were prepared in the following concentration: 52.5, 78.75, 105, 131.25 and 157.5 ppm, to prepare calibration curves. The sample solution was prepared at 280 ppm in concentration.
The plates were developed in saturated mode of twin trough chamber at room temperature. Then, the plate was dried at room temperature before densitometry scanning.
The HPTLC plate was scanned at a wavelength of 243 nm. The plate was densitometrically scanned with CAMAG TLC scanner 4. Densitogram was displayed by CAMAG winCATS computer program. Analysis and validation were identified by matching their Rf values and area under curve values, with those obtained for standard.
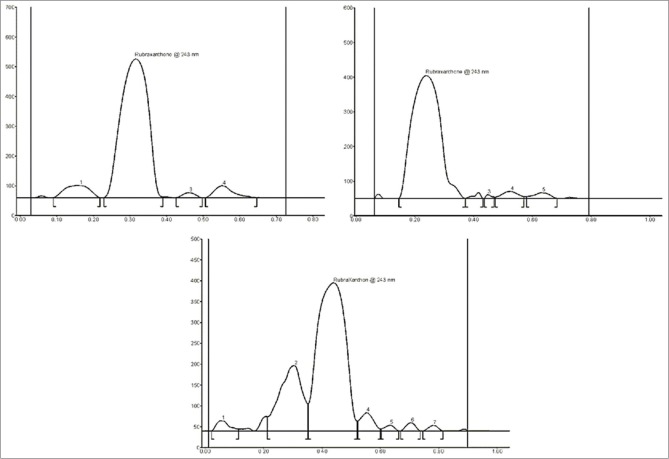
A suitable mobile phase equally plays a very crucial role in chromatographic methods. HPTLC procedure was optimized with a view of developing a stability-indicating assay method. The following mobile phases were used: n-hexane: ethyl acetate (6:4, v/v), chloroform: ethyl acetate (9:1, v/v), and chloroform: methanol: ethyl acetate: formic acid (86:6:3:5, v/v/v/v). Initially, n-hexane: ethyl acetate (6:4, v/v) gave Rf value of 0.3 for rubraxanthone, and then chloroform: ethyl acetate (9:1, v/v) gave Rf value of 0.22 for rubraxanthone [Figure 2].
Figure 2.
High-performance thin-layer chromatography densitogram of rubraxanthone in the ethyl acetate extract of stem bark of Garcinia cowa. The following mobile phases were used in development of optimum mobile phases: n-hexane: ethyl acetate (6:4 v/v), rubraxanthone Rf 0.3; chloroform: ethyl acetate (9:1 v/v) rubraxanthone Rf 0.22; chloroform: methanol: ethyl acetate: formic acid (86:6:3:5 v/v/v/v) rubraxanthone Rf 0.44
Preparation of sample and standard
Rubraxanthone was obtained from the Central Laboratory, Faculty of Pharmacy of Andalas University (Padang, Indonesia), which was previously isolated from Garcinia plant.[9]
Plant material
Stem bark of G. cowa was collected from Limau Manis, Padang (Indonesia) in March 2015. The plant was taxonomically identified, authenticated by Dr. Nurainas, and voucher specimen DR-190 was deposited at Herbarium of Andalas University (ANDA). The stem bark was diced and dried in an oven at 50°C for 72 h and then ground into a fine powder.
Extraction conditions
Fine powder of G. cowa. stem bark (100 g) was defatted by n-hexane and then extracted with ethyl acetate using Soxhlet extraction method, until the solvent become less color. Then, it was processed using a rotary evaporator until the solvent was evaporated, to produce ethyl acetate extract of the stem bark of G. cowa as a sample in this analysis.
Method validation
Validation is the method of confirming the performance characteristics of a technique in a study that meet the conditions for the proposed analytical application.[10] The HPTLC technique was valid in keeping with the International Conference on Harmonization (ICH) rules on the validation of analytical processes (Q2B).[11]
Linearity (calibration curve)
Linearity was assessed by applying standard solutions of rubraxanthone in the following concentration: 52.5, 78.75, 105, 131, 25, and 157, 5 ppm. The TLC plates were developed and analyzed as per chromatographic condition described. The standardization curves were ready by plotting peak height versus concentration (ng/spot), and linearity (R2) was determined by regression analysis of the calibration graphs.
Accuracy (percentage of recovery)
Accuracy was determined by percentage recovery of sample. A recovery was carried out at three concentration levels for each standard compound to obtain the accuracy of the planned technique.[12] 2 μL of ethyl acetate extract of the steam bark of G. cowa after spiking with 26.25 ppm, 52.5 ppm, and 78.75 ppm of additional rubraxanthone standard, afforded recovery of 95.84–98.03% (Table III). The data summary of validation parameters are listed in Table IV.
Method precision (% repeatability)
The precision expresses the closeness of agreement between a series of measurements obtained from multiple sampling of the same homogeneous sample under certain conditions. Precision is commonly performed at three different levels, namely, repeatability, intermediate precision, and reproducibility.[11] The lesser percentage relative standard deviation (%RSD) values for intra- and inter-day accuracy exposed that the method is accurate.
The precision of the method, %RSD values, was estimated for each rubraxanthone sample. This research assessed precision for intra- and inter-day. The data for intraday precision were obtained from three applications of the sample across the entire plate, whereas the data for interday precision were obtained from three applications of the sample across the entire plate once daily for three consecutive days.
Limit of detection and limit of quantification
Limit of detection (LOD) refers to the lowest concentration of associate analyte which will be detected, however not essentially quantitated as a definite worth whereas the limit of quantification (LOQ) relates the bottom quantity of analyte in an exceeding sample which may be quantitatively determined with appropriate exactness and accuracy.[11,13]
The LOD and LOQ were calculated using the following equations as per the ICH guidelines:[11]
Equation I: LOD = 3.3 × σ/S
Equation II: LOQ = 10 × σ/S
where:
σ is the SD of the response
S is the slope of the standardization curve.
Analysis of rubraxanthone in ethyl acetate extract of the stem bark of G. cowa
To determine the concentration of rubraxanthone in ethyl acetate extract of the stem bark of G. cowa, the 280 ppm sample solution was analyzed for rubraxanthone content. The 5 μL sample solution was applied on the same HPTLC plate with calibration curve analysis followed by development and scanning as described above. The analysis was repeated in triplicate.
RESULTS AND DISCUSSION
TLC procedure was optimized with a view to developing a stability-indicating assay method. Several mobile phases were used. Finally, the mobile phase consisting of chloroform-methanol–ethyl acetate–formic acid (86:6:3:5, v/v/v/v) which gave well separation peaks for substances in sample and well-defined rubraxanthone peak at Rf value of 0.44 was chosen for further study. Well-defined spots were obtained once the chamber was saturated with the mobile part for 20 min at room temperature.
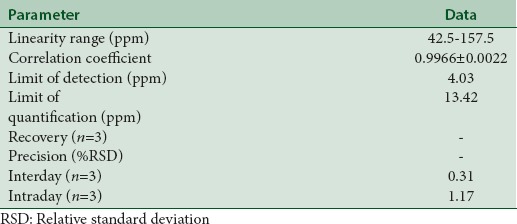
LOD: 4.04 ppm/spot and LOQ: 13.42 spot−1 indicated the adequate sensitivity of the method.
The linear regression data for the calibration curves (n = 3) [Table 1] showed a good linear relationship over the concentration range 52.5–157.5 ppm with respect to peak area.
Table 1.
Linear regression data for the calibration curves

The repeatability of sample application and measurement of peak area were expressed in terms of %RSD, and the results are shown in Table 2, which reveal intra- and inter-day variations of rubraxanthone at three different concentration levels of 52.5, 105, and 157.5 ppm.
Table 2.
Intra- and inter-day precision of high-performance thin-layer chromatography method

The calibration curve in this study was plotted between the amount of rubraxanthone versus average response (peak area), and the regression equation was obtained (y = 31.208x + 131.32) with a regression coefficient of 0.9966 ± 0.0022. Detection limit and quantification limit were calculated by the method as described in the “LOD and LOQ” section and were found to be 4.03 and 13.42 ppm, respectively. This indicates the adequate sensitivity of the method.
The proposed method, when used for ethyl acetate extraction of rubraxanthone from G. cowa stem bark after spiking with 26.25, 52.5, and 78.75 ppm of additional rubraxanthone standard, afforded recovery of 95.84%–98.03% [Table 3]. The data summary of validation parameters are shown in Table 4.
Table 3.
Recovery studies

Table 4.
Summary of validation parameters
The performance of the planned technique is in line with the ICH rules for the validation of a bioanalytical technique. %RSD values were 1.44%, confirming with the suitable precision of the method. There is no interference from other elements which indicates that the method is particular just for analysis of rubraxanthone. There was no significant change in the Rf of the compound, and the low value of %RSD confirmed the robustness of the method [Table 4]. Further, recovery was 95.84%–98.03%, indicating the method's reliability and suitability. The low SD values indicated the suitableness of the planned technique for day-to-day analysis of this necessary bioactive molecule.
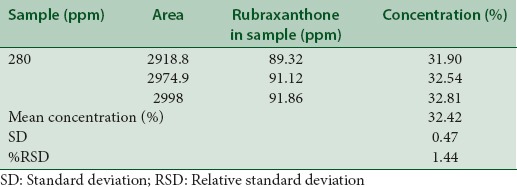
A single spot of Rf 0.44 was observed in a chromatogram of sample solution. Rubraxanthone content was found to be 32.42% with a %RSD of 1.44. The low %RSD value indicated the suitability of this method for quantitative analysis of rubraxanthone in ethyl acetate extract of G. cowa stem bark [Table 5].
Table 5.
Rubraxanthone content in sample
CONCLUSION
The developed HPTLC technique is precise and accurate. Quantitative HPTLC procedure of rubraxanthone in ethyl acetate extract of the stem bark of G. cowa has been described in this study. The presented method is easy to operate, the results obtained are fast at a relatively low cost. A suitable mobile-phase system was applied to separate rubraxanthone spot from another substance. The validation procedure revealed that the method meets the criteria for quantitative HPTLC method. The presented technique may be used for preliminary screening of rubraxanthone content in ethyl acetate extract of the stem bark of G. cowa samples.
Financial support and sponsorship
This research was funded by Andalas University through Hibah Guru Besar No. 09/UN.16.17/PP.HGB/LPPM/2017.
Conflicts of interest
There are no conflicts of interest.
REFERENCES
- 1.Ritthiwigrom T, Laphookhieo S, Pyne SG. Chemical constituents and biological activities of Garcinia cowa Roxb. Maejo Int J Sci Technol. 2013;7:212–31. [Google Scholar]
- 2.Wahyuni FS, Byrne LT, Dachriyanus, Dianita R, Jubahar J, Lajis NH, et al. A new ring-reduced tetraprenyltoluquinone and a prenylated xanthone from Garcinia cowa. Aust J Chem. 2004;57:223–6. [Google Scholar]
- 3.Lee H, Chan H. 1,3,6-trihydroxy-7-mehoxy-8-(3,7-dimethyl-2,6-octadienyl) xanthone from Garcinia cowa. Phytochemistry. 1997;16:20038–40. [Google Scholar]
- 4.Dachriyanus, Dianita R, Jubahar J. Isolation of antioxidant compounds from the stem bark Garcinia cowa. J Math Nat Sci. 2003;12:67–72. [Google Scholar]
- 5.Wahyuni FS, Shaari K, Stanslas J, Lajis NH, Dachriyanus Cytotoxic xanthones from the stem bark of Garcinia cowa Roxb. J Chem Pharm Res. 2015;7:227–36. [Google Scholar]
- 6.Dachriyanus, Sartika L, Kesuma M, Mukhtar MH. The effect of rubraxanthone on total cholesterol, trigliseride, HDL and LDL in the blood white male mice. J Sain Tek Far. 2006;11:12–5. [Google Scholar]
- 7.Rasyid R, Wahyuni FS, Yanwirasti, Dachriyanus Development and validation of a HPLC method for determination and quantification of a-mangostin in bark extract of Garcinia cowa Roxb. Int J Res Pharm Sci. 2014;5:282–5. [Google Scholar]
- 8.Susanti M, Dachriyanus, Putra DP, Wahyuni FS. Determination of rubraxanthoen in the steam bark extract of Garcinia spp. J Farm Ind. 2013;6:159–65. [Google Scholar]
- 9.Susanti M, Lena DI, Dachriyanus Development and validation of a HPLC method for determination and quantification of rubraxanthone in stem bark extract of mangosteen. Ind J Pharm. 2014;25:237–44. [Google Scholar]
- 10.Rashmin P, Mrunali P, Nitin D, Nidhi D, Bharat P. HPTLC method development and validation: Strategy to minimize methodological failures. J Food Drug Anal. 2012;20:794–804. [Google Scholar]
- 11.Guidance for Industry, Q2B: Validation of Analytical Procedures: Methodology. USA: International Conference on Harmonisation; 1997. International Conference on Harmonisation. [Google Scholar]
- 12.Betz JM, Brown PN, Roman MC. Accuracy, precision, and reliability of chemical measurements in natural products research. Fitoterapia. 2011;82:44–52. doi: 10.1016/j.fitote.2010.09.011. [DOI] [PMC free article] [PubMed] [Google Scholar]
- 13.Horwitz W. AOAC Guidelines for Single Laboratory Validation of Chemical Methods for Dietary Supplements and Botanicals. Gaithersburg, MD, USA: AOAC International; 2002. pp. 12–9. [Google Scholar]


