Abstract
Background:
The traditional use of Eugenia uniflora L. (“Pitanga”) is reported due to several properties, which have often been related to its flavonoid content.
Objective:
The aim was to evaluate analytical procedures for quantification of total flavonoids content (TFCs) by ultraviolet-visible (UV-Vis) spectrophotometry in the herbal material (HM), crude extract (CE), and fractions from leaves of E. uniflora.
Materials and Methods:
The method for quantification of flavonoids after complexation with aluminum chloride (AlCl3) was evaluated: amount of sample (0.25–1.5 g); solvent (40%–80% ethanol); reaction time and AlCl3 concentration (2.5%–7.5%). The procedures by direct dilution (DD) and after acid hydrolysis (AH) were used and validated for HM and CE and applied to the aqueous fraction (AqF), hexane fraction, and ethyl acetate fractions (EAF).
Results:
The ideal conditions of analysis were ethanol 80% as solvent; 0.5 g of sample; λmax of 408 (DD) and 425 nm (AH); 25 min after addition of AlCl3 5%. The procedures validated for standards and samples showed linearity (R2 > 0.99) with limit of detection and limit of quantification between 0.01 and 0.17 mg/mL (rutin and quercetin); and 0.03 and 0.09 mg/mL (quercetin), for DD and AH, respectively. The procedures were accurate (detect, practice, and repair < 5% and recovery >90%), and stable under robustness conditions (luminosity, storage, reagents, and equipment). The TFCs in AqF and EAF were 0.65 g% and 17.72 g%, calculated as rutin.
Conclusions:
UV-Vis methods for quantification of TFC in HM, CE, and fractions from leaves of E. uniflora were suitably validated. Regarding the analysis of fractions, the EAF achieved enrichment of about nine times in the content of flavonoids.
SUMMARY
The total flavonoids content (TFCs) of herbal material, crude extract, and fractions from Eugenia uniflora can be quantified by ultraviolet-visible
The spectrophotometric methods (direct dilution and acid hydrolysis) were reproducible and able to quantify TFC in raw material and derivatives from leaves of E. uniflora
Higher flavonoids content was observed in ethyl acetate fractions after enrichment.
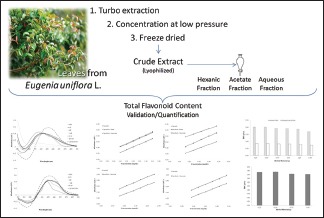
Abbreviations Used: HM: Herbal material, CE: Crude extract, AqF: Aqueous fraction, HF: Hexanic fraction, EAF: Ethyl acetate fraction, TFC: Total flavonoids content, HCl: Hydrochloric acid, DD: Direct dilution, AH: After hydrolysis, RSD: Relative standard, A.U.: Absorption units.
Key words: Eugenia uniflora L, fractions, total flavonoids content, ultraviolet-visible, validation
INTRODUCTION
Eugenia uniflora Linn., myrtaceae, is popularly known in Brazil as “pitanga,” “pitangueira,” “red pitangueira,” “Brazilian cherry tree,”[1,2] Among the numerous plant species of medicinal interest and for the production of herbal medicines, the species is in the National List of Medicinal Plants of Interest for the Brazilian public health system – RENISUS.[3]
Compounds such as flavonoids,[4] triterpenes,[5] volatile oils[6] have been described for species of the genus Eugenia. The leaves of E. uniflora have important constituents responsible for several pharmacological effects, such as anthracene derivatives, saponins,[7] terpenes in the essential oil,[8] cinnamic derivatives, tannins, and flavonoids.[9] The essential oil had effects on Leishmania amazonensis[10] and activity against resistant and pathogenic bacteria.[8] Aqueous, ethanolic, and acetone extracts presented antifungal activity against species Candida albicans, Candida dubliniensis, Candida glabrata, Candida krusei, and Candida tropicalis[11,12] with inhibition of important virulence factors of C. albicans;[13] antihypertensive, diuretic, and antipyretic effects;[7] also, acting as anti-Trypanosoma and against strains of Leishmania braziliensis.[12,14] Some of these activities are correlated with the presence of phenolic compounds on the species, such as antioxidant, immunomodulatory, and cytotoxic activity of fractions obtained from leaves.[13,15,16]
Even with the several activities reported and the correlation with the presence of the phenolic compounds, the lack of reports of analytical procedures adequately validated, remains as an important challenge for the safe use and for the phytopharmaceutical development from this drug material. Taking this aspect into consideration, the quantification of polyphenols can be carried out by absorption on the ultraviolet-visible (UV-Vis) region since this technique is widely used due to some indispensable advantages for the laboratory routine such as simplicity, low operational cost, and reliability of results.[17,18] To obtain the flavonoid spectrum without the interference of other phenolic compounds, the spectrophotometric method using aluminum chloride (AlCl3) reaction plays an important role.
The quantification of flavonoids after complexation with AlCl3 shows satisfactory performance according to several studies described in the literature. The determination of o-glycosylated flavonoids described by Glasl and Becker[19] has been used as reference to evaluate the flavonoid content of several medicinal species such as Passiflora incarnata,[20] Bauhinia monandra,[18] Hymenaea martiana,[21] Moringa oleifera and Ocimum tenuiflorum,[22] Ocimum basilicum,[23] and Kalanchoe brasiliensis.[24] The procedure allows the estimation of the total content of flavonoids with specificity from the majority aglycones (free and o-glycosylated flavonoids), increasing the representativeness of the analysis, and minimizing the possibilities of deviations. In additon, the complex formed between flavonoid-Al provide a bathochromic effect which plays a key role on the method specificity.[23]
In this context, the purpose of this work was to evaluate the analytical procedures by UV-Vis spectrophotometry for quantification of total flavonoids in herbal material (HM), crude extract (CE) and fractions of leaves of E. uniflora.
MATERIALS AND METHODS
Herbal material
The leaves of E. uniflora were collected in November/2013 in Ipojuca-PE. The material was identified and a voucher specimen was deposited at the Dárdano de Andrade Lima Herbarium of Instituto Agronomico de Pernambuco under registration number 89989. The material was dried for 7 days using a circulating air oven under 40°C (Luca-82-480, Lucadema®) and then ground in a Wiley mill (Mod. TE-680, Tecnal®).
Crude extract and enriched fractions
The dried and ground HM (50 g, 10% w/v) was extracted with acetone: Water (7:3, v/v) by turbo extraction (four extractive cycles of 30-s, interspersed with 5 min of pause). The solution was concentrated under reduced pressure (RV10 Basic, IKA®), the residue was frozen (−80°C, 3 days) and then lyophilized (Model L101, Liotop®), yielding the CE. About 10 g of CE were reconstituted in water (100 mL) and partitioned 6 times with 100 mL hexane. The residual aqueous fraction (AqF) was partitioned 12 times with 100 mL of ethyl acetate. The fractions were concentrated, frozen and lyophilized, resulting in fractions: Hexane fraction (HF), ethyl acetate fraction (EAF) and AqF.
Quantification of flavonoids by ultraviolet-visible spectrophotometry
Direct dilution
HM: 0.5 g of HM was refluxed (85°C ± 3°C) using 30 mL of ethanol 80% (v/v) for 30 min. The extract was filtered in cotton to a volumetric flask of 100 mL. The cotton and drug residue were returned to the flask and a new extractive cycle was performed by 15 min with 30 mL of ethanol 80%. This procedure was repeated two times. The filtrates were collected in the 100 mL volumetric flask, and the volume made up with ethanol 80%.
Stock solutions
HM: The solution resulting from the reflux was taken as stock solution
CE and fractions: The CE or fractions (AqF, EAF and HF) were solubilized with ethanol 50% (v/v) at concentration of 2.0 mg/mL
Standards: The standards of rutin and quercetin were solubilized with ethanol 50% (v/v), resulting in solutions with concentrations of 0.10 and 0.05 mg/mL, respectively.
Analytical conditions
Evaluation of the solvent and herbal material concentration
Samples of the HM ranged from 0.25 to 1.50 g were submitted to the general procedure of quantification using ethanol 80% (v/v) as solvent. After that, a sample of 0.5 g from HM was used to evaluate the extractive performance of several concentrations of with ethanol (40%, 60% or 80%, v/v), according to the general procedure for HM. The absorbances were determined by spectrophotometry after 25 min using aluminum chloride (AlCl3; 5.0% in methanol, w/v). The total flavonoid content (TFC) was expressed as g% of rutin and quercetin, by the average of three determinations.
Sample concentration and wavelength selection
Aliquots of 3–6 mL of stock solutions (HM, CE or fractions) were transferred to a volumetric flasks of 25 mL, added with 2 mL of AlCl3 (5.0%, w/v), and then, the volume was made up with ethanol 50% (v/v). After 30 min of reaction, the UV-Vis spectra was measured in the range of 300–500 nm in a spectrophotometer (Evolution 60S, Thermo Scientific®). The data were used to select the appropriate sample and wavelength for analysis.
Reaction time, concentration, and aluminum chloride aliquots
The kinetics of reaction was investigated by determining absorbances for 60 min, every 5 min after addition of AlCl3. The procedure was carried out with concentrations (2.5%, 5.0% and 7.5%, w/v) and different aliquots (1, 2 and 3 mL) of AlCl3.
Acid hydrolysis
Herbal material
The amount of 0.5 g of the HM was transferred to a round bottom flask, 20 mL of acetone, 2 mL of hydrochloric acid (HCl) concentrated, and 1 mL of 0.5% (w/v) aqueous methenamine solution were added. The mixture was refluxed (85°C ± 3°C) for 30 min. The extract was filtered in cotton to a volumetric flask of 100 mL. The residue (cotton + HM) being reextracted twice more for 15 min with 20 mL of acetone. The filtrated was pooled in a volumetric flask and the volume adjusted to 100 mL with acetone.
Stock solutions
HM: The solution resulting from the reflux operation was taken as stock solution.
Crude extract and fractions
The CE and fractions were weighed and solubilized in acetone to a volumetric flask of 50 mL (2 mg/mL). The solution was transferred to a round bottom flask and kept under reflux (T = 85°C ± 3°C), with 1 mL of HCl and 0.5 mL of 0.5% (w/v) aqueous methenamine solution. After 30 min, the solution was filtered to a volumetric flask of 50 mL and the volume checked with acetone.
Analytical conditions
Herbal material concentration
The influence of the amount of sample on the response of the method was evaluated using samples between 0.25 and 1.0 g.
Aliquots of acid
The influence of the aliquots of acid on the performance of the method was evaluated at aliquots of 0.5, 1.0, 2.0 and 3.0 mL of HCl.
Sample concentration and wavelength selection
Aliquots of 7.0 and 7.5 mL of stock solutions (HM, CE and fractions) were transferred to a volumetric flask of 25.0 mL, added with 1.0 mL of AlCl3 (5.0%), and then, the volume was made up with 5% acetic acid solution in methanol. After 30 min of reaction, the scanning spectrum was measured in the range of 300–500 nm in a UV-Vis spectrophotometer. The data were used to select the appropriate sample and wavelength for analysis.
Reaction time, concentration, and aluminum chloride aliquots
The reaction kinetics was investigated by determining the absorbances for 60 min, every 5 min after addition of AlCl3. The procedure was carried out with concentrations (2.5%, 5.0%, and 7.5%, w/v) and different aliquots (1, 2, and 3 mL) of AlCl3, adopting the procedure of acid hydrolysis (AH).
Determination of total flavonoid content
The TFCs were calculated according to the equation below and expressed in g% of quercetin and rutin for the direct dilution (DD) procedure and g% of quercetin after AH. The results represent the average of three determinations.

Where: TFC – total flavonoid content; A – absorbance (A.U.); DF – dilution factor; w – weight of herbal drug/CE/fractions (g); ld – loss on drying;  – specific absorption of complex quercetin/rutin − AlCl3.
Validation of the analytical procedures
The procedures were performed according to the validation guide for analytical methods of sanitary vigilance[25] and the ICH guidelines specifications.[26] The results are represented by the mean ± standard deviation and relative standard deviation (RSD).
Linearity
The linearity of the method was determined from the analysis of three authentic analytical curves using five different concentrations. The concentration ranges for standards and samples are shown in Table 1. The estimated coefficients of the analytical curves were analyzed by linear regression using the least squares method and Excel®.
Table 1.
Calibration data for the standards (rutin and quercetin), herbal material, and crude extract from Eugenia uniflora

Limit of detection and limit of quantification
The limit of detection (LD) and limit of quantification (LQ) were calculated on the basis of the data of regression analytical curves of standards. The bellow equations were used to the calculations as recommended by ICH (2005) and Brazil (2003).
LD = (3.3·σ)/s
LQ = (10·σ)/s
Where “σ” is the standard deviation of the response and “s” is the slope of the calibration curve.
Specificity/selectivity
The specificity/selectivity was evaluated through the standard addition method after contamination of the samples with fixed amount of standard at the same concentrations used in the linearity study. Sample readings were performed at 408 nm and 425 nm for the procedures by DD and AH, respectively, 25 min after addition of 2.0 mL of AlCl3.
Precision
Precision was estimated through repeatability and intermediate precision. For the repeatability, six individual determinations from the same sample, performed by the same analyst on the same day, and employing 100% of the concentration of the test condition. In the case of intermediate precision, the performance of the method was evaluated by two different analysts on 2 consecutive days.
Accuracy
The recovery assays were performed for both analytical procedures (DD and AH) by addition of the concentrations of standard solutions (80%, 100% and 120%) to a samples solution at 100% of test condition. Thus, the samples obtained by DD were spiked with standard solutions of quercetin (3.0–5.0 mL) or rutin (4.0–6.0 mL) while the sample from AH was spiked with standard solutions of quercetin (2.5–4.5 mL).
The accuracy was assessed by the means from the recovery values, expressed as the percentage calculated by the ratio between the average from the experimental concentrations and the expected theoretical concentrations.
Robustness
The stability of the analytical procedures was verified through the spectrophotometric response after intentional variations, such as light exposure (presence and absence of light), stock solution stability (day 1 and day 3), reagent suppliers (Vetec® and Dynamic®), and equipment (Evolution 60S Thermo Scientific® and AJX-1900 Micronal®).
RESULTS AND DISCUSSION
Analytical conditions
Before the use of analytical procedures in the laboratory routine, the optimization of the experimental conditions plays an important role in ensure the adequacy of the technique to the proposed use. This approach becomes more critical for quantification from complex matrices such as secondary metabolites in HMs. Thus, several factors may present significant interference on the methodological responses conducting to overestimation or underestimation of the analytical data. Moreover, additional difficulties are related to the analysis of herbal drugs due to the complexity of its chemical composition.[27,28,29]
In the case of spectrophotometric quantification of flavonoids, the method commonly used is based on the technique of complexation of the vicinal hydroxyls of the flavonoid structures with AlCl3, followed by spectrophotometric measurement due to the bathochromic displacement and hyperchromic effect resulting from the complexes formed.[18] Thus, during the evaluation of the procedures, some variables such as solvent concentration, drug ratio, AlCl3 concentration and complexation time, need to be investigated and adjusted before method validation because of the interdependence of the analytical response of structural diversity of flavonoids present in each herbal matrix.[30]
Influence of solvent
The type and concentration of solvent play a key role for the procedures by DD. The extractive conditions should not only be exhaustive but also selective as possible. The data showed best performance when the 80% hydroalcoholic solution was used as solvent and the TFC was calculated as 0.87 g% ± 0.0214 (2.45%) expressed as quercetin, and 2.01 g% ± 0.0495 (2.46%) expressed as rutin. The extractive behavior seems to be influenced by the structural characteristics of the flavonoids because they present vicinal C-3'–C-4' hydroxyl groups at the anel ring B and free substituted hydroxyl group on C-7 position, improving the extraction of these compounds in hydroalcoholic mixtures. When the reaction with AlCl3 occurs, aspects such as presence, position, and number of hydroxyl groups have influence on the UV-Vis spectrum and on the response.[30,31,32]
Influence of herbal material concentration
The optimization of the amount of HM is directed connected to the extractive ability of the solvent system. The results showed higher analytical performance at lower samples (0.25–0.50 g), yielding higher TFC values. However, at 0.25 g was observed higher experimental variability. Thus, the use of 0.50 g from herbal drug was choosed for both procedures (DD and AH). The TFC calculated were of 0.87 g% ± 0.0175 (2.00%) and 1.74 g% ± 0.0313 (1.79%), respectively. The use of samples with larger amounts of drugs (0.75–1.50 g) showed a decreasing on the TFC values as can be seen in Figure 1. Either the saturation of solvent and/or the reagent depletion could be responsible by the behavior.[33,34]
Figure 1.
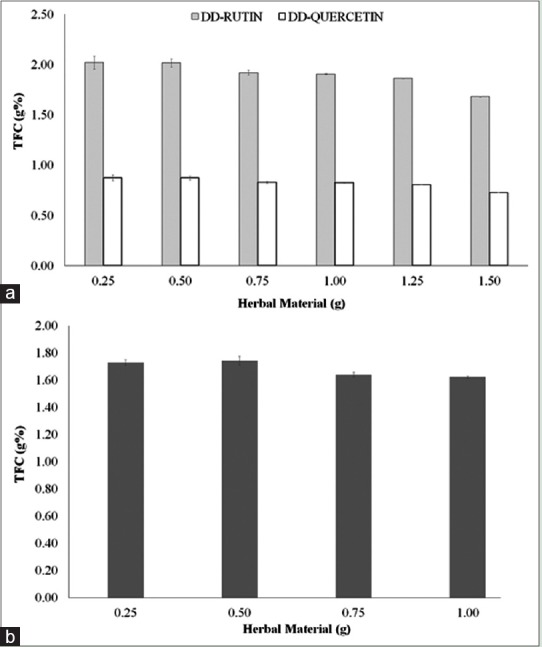
Influence of drug amount on the total flavonoid content from herbal material calculated after direct dilution (a) and acid hydrolysis (b). The data were expressed as g% (w/w) of quercetin and rutin for direct dilution and g% of quercetin for acid hydrolysis
Evaluation of the acid aliquot on the hydrolysis process
In the procedure for HM, the aliquot of HCl corresponding to 2 mL showed an increase in the analytical responses, in relation to that of 1 mL. For the CE, the analytical response was also intensified with the increase of the aliquot, being chosen 1 mL of HCl. Low acid concentrations may result in incomplete hydrolysis. At this stage, sugars should be released for identification and quantification of aglycones. Therefore, the amount of HCl must provide complete breakage of the glycosidic bonds and at the same time must avoid the degradation of the aglycones.[35]
Wavelength selection
The wavelengths for the quantitative analyses were determinate from the maximums absorptions observed in the UV-spectrums. Figure 2 shows the UV-spectrums for the samples after complexation with AlCl3 (5.0%). In the absorption spectra, the profile of samples was similar for all samples, and the maximums were observed at 408 and 425 nm for DD and AH, respectively. To avoid deviations from the Lambert-Beer laws, the sample aliquots were of 4.0 mL for DD and 7.5 mL after AH. At these conditions, the absorbances remains within the range from 0.2 to 0.8 A. U. (absorbance units).
Figure 2.
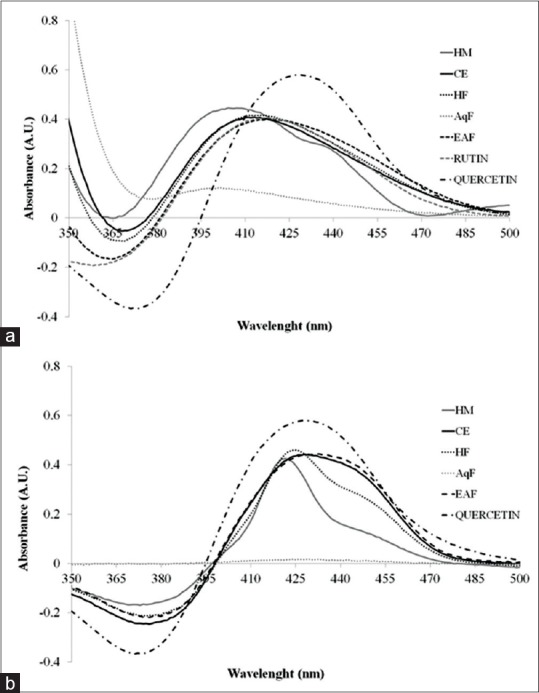
Spectrum for aluminum chloride-flavonoid complexes: Herbal material (drug), crude extract, hexanic fraction, aqueous fraction, ethyl acetate fraction and standards (quercetin and rutin). (a) Procedure of direct dilution; (b) procedure of acid hydrolysis
Reaction time, concentration, and aluminum chloride aliquots
In the reactional kinetics of complex formation between flavonoid and AlCl3, it was verified that maximum absorbance of samples was reached at 20 min [Figure 3]. The reactional product remained stable with nonimportant variations until the end of the experiment (60 min). The influence of the AlCl3 concentrations was also evaluated, and the results showed maximum absorption at 5.0% (w/v). These results corroborate with data reported in the literature that higher concentration of AlCl3 could promote the complex reversion.[18,24,30]
Figure 3.
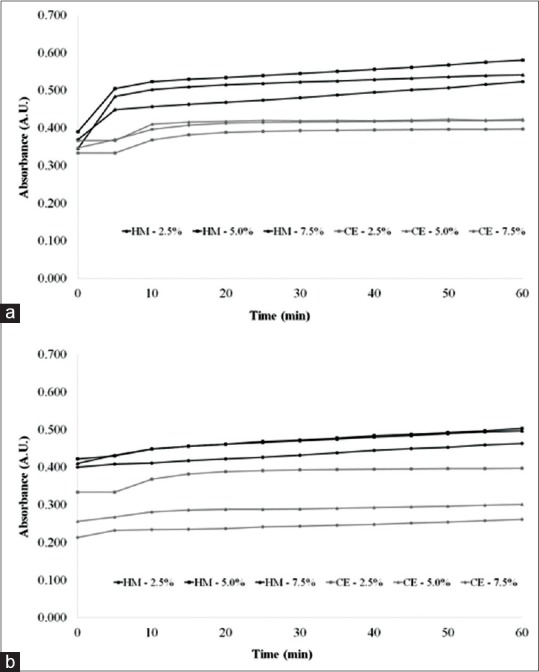
Complexation kinetics of aluminum chloride in herbal material and crude extract. (a) Procedure of direct dilution; (b) procedure of acid hydrolysis
Regarding the volume of AlCl3 solutions, 2.0 mL of reagent solutions was enough for the complete complexation.
Validation of the analytical procedures
Specificity/selectivity
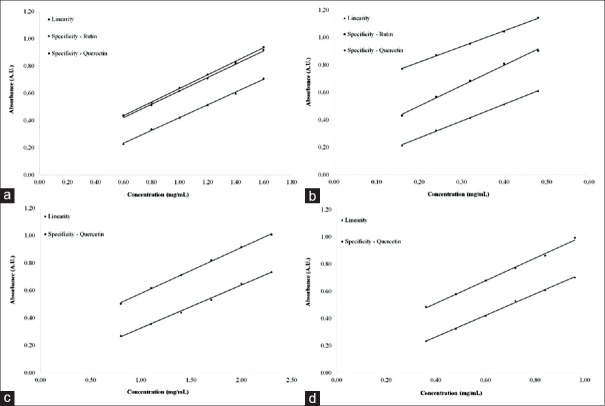
The specificity/selectivity of the method was confirmed through the comparative evaluation between the curves obtained for linearity and specificity, evidenced by the parallelism between the regression curves [Figure 4]. This approach is most appropriate way for analysis of biological matrices whose analyte-free matrix is not available.[36]
Figure 4.
Specificity and linearity curves for quantification of total flavonoids by direct dilution on herbal material (a) and crude extract (b); and after acid hydrolysis on the herbal material (c) and crude extract (d)
In addition, the evaluation of UV/Vis-spectrum of the standards (quercetin and rutin) and solutions of the HM, CE, and fractions in both procedures (DD and AH) allowed to observe that there is an important similarity between the spectra [Figure 2]. The data confirm that the previously selected wavelengths (408 and 425 nm) represent the major chemical compounds reported for the species.
Linearity, limits of detection, and quantification
Linearity curves showed the coefficient of determination (R2) higher than 0.99 for all concentration ranges studied for HM, CE, or standards. The results are summarized in Table 1 and show that the experimental variability is explained by the proposed equations, proving the linear relationship between the increasing of the analyte concentration, and the spectrophotometric responses.
The LDs and LQs were calculated and are presented in Table 1. The low limits obtained for the parameters allow to confirm that both analytical procedures showed the required sensitivity for detection and quantification of total flavonoids in the HM and CE from leaves of E. uniflora [Table 1].
Precision
The data for repeatability and intermediate precision by DD and after AH are resumed in Table 2. At both levels of the precision test, the RSD showed values under the limits recommended by literature (< 5%). Thus, the procedures reproducibilities were considered satisfactory, even when the assays were performed on different days and analysts.
Table 2.
Results of precision (repeatability and intermediate precision) for methods of quantification of flavonoids in the samples (herbal material and crude extract) by procedures of direct dilution and after acid hydrolysis

Accuracy
The method accuracy was estimated by the recovery of the standards calculated from the TFC, to quantify the interference of the herbal matrices on the method performance. The recoveries were calculated as quercetin and rutin (%) for DD and as quercetin for AH and for each matrice (HM or CE). Regarding the procedure by DD, the recoveries were between 96 and 98% for HM and between 93% and 98% for CE, calculated as quercetin. In relation to recovery performed with rutin, the values obtained for HM were between 100.18% and 101.04% and between 93% and 98% for CE. The recovery assay or HM and CE by AH procedure were, respectively, ranged from 92% to 98% and from 96% to 103%. These results represent the degree of agreement between the calculated and experimentally obtained contents, indicating that there was no significant interference from the matricial components on the recovery of the chemical markers. Thus, it is possible to deduce that the method does not interfere in the extraction of aglycones or heterosides.
Robustness
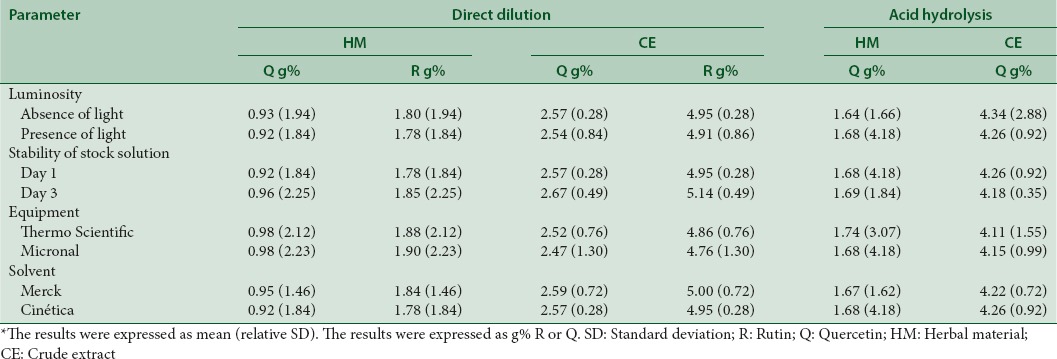
The robustness tests were carried out for both procedures (DD and AH) and using HM and CE as matrices. Thus, narrow small and deliberate modifications were introduced to the methodologies and the performance avaliated. The data for the robustness are summarized in Table 3. The assay results indicate that changes in all factors (luminosity, solution stability, equipment, and solvent supplier) did not showed important interferences on method performance. The variability of the TFC was calculated as RSD, and it was lower than 5%, which is in compliance with the recommended limits.[25,26] Thus, the optimized analytical methodologies for quantification of TFC in HM and CE, either by DD or AH, showed the required robustness.
Table 3.
Results of the robustness test for the direct dilution and acid hydrolysis procedures in herbal material and crude extract
Quantitative evaluation of total flavonoids content from the Eugenia uniflora fractions
The validation of the analytical methodologies allowed to ensuring the reliability of the developed methods, qualifying them also for the determination of total flavonoids in the fractions. Thus, the enrichment by fractionation previously suggested by thin-layer chromatography (data not shown) could be confirmed by spectrophotometric quantification of the EAF with both analytical procedures (DD and AH). The flavonoid content in the EAF was improved to 9.19 g% ± 0.0131 (1.43) calculated as quercetin and 17.72 g% ± 0.0253 (1.43) g% calculated as rutin, both determinated by DD procedure. Regarding the procedure after AH, the TFC was calculated as 13.80 g% ± 0.0220 (0.15) of quercetin. In comparison to CE, the content of flavonoids was significantly increased by about nine times for both analytical methods.
The data confirm the successful of fractionation operation to obtain flavonoid-enriched product, which can improve the biological properties attributed to E. uniflora.[37,38] In addition, the similar performance of the analytical procedures observed for fraction analysis suggested that the majority of flavonoids are represented mainly by free-aglycones and respectives O-glycosyl derivatives [Table 4].
Table 4.
Quantification of flavonoids in the fractions by direct dilution and acid hydrolysis

CONCLUSIONS
According to the results, the analytical methodologies by UV-Vis developed for quantification of flavonoids on the HM, CE, and fractions from leaves of E. uniflora showed performance in accordance to the specifications in relation to the validation parameters of specificity, linearity, precision, accuracy and robustness. The two procedures were able to detect and quantify the TFC either by DD or after acid hydrolysis without significative deviation and could be considered simple, with precision and accuracy suitable to be used as quality control tools for the HM and extract from leaves of E. uniflora.
Financial support and sponsorship
This work was supported by the CNPq (308386/2015-9), FACEPE (IBPG08644.04/13; APQ-0493-4.03/14; BIC-0200-4.03/15), and ANVISA/MS (TC03/2010).
Conflicts of interest
There are no conflicts of interest.
Acknowledgments
The authors thank the CNPq, FACEPE, ANVISA/MS, and UFPE for their financial support. Moreover, we are also grateful to Andrew Alastair Cumming for editing this paper.
REFERENCES
- 1.Lorenzi H, Matos FJ. (Medicinal Plants In Brazil: Native and Exotic) 2nd ed. Nova Odessa: Instituto Plantarum; 2008. Plantas Medicinais No Brasil: Nativas e Exóticas. [Google Scholar]
- 2.Rattmann YD, de Souza LM, Malquevicz-Paiva SM, Dartora N, Sassaki GL, Gorin PA, et al. Analysis of flavonoids from Eugenia uniflora leaves and its protective effect against murine sepsis. Evid Based Complement Alternat Med. 2012;2012:623940. doi: 10.1155/2012/623940. [DOI] [PMC free article] [PubMed] [Google Scholar]
- 3.Brazil. Ministry of Health. RENISUS – Relação Nacional de Plantas Medicinais de Interesse ao SUS (National Relation of Medicinal Plants of Interest to Public Health) DAF/SCTIE/MS – RENISUS – fev/2009. [Last accessed on 2017 Mar 27]. Available from: http://portalarquivos.saude.gov.br/images/pdf/2014/maio/07/renisus.pdf .
- 4.Mahmoud II, Marzouk MS, Moharram FA, El-Gindi MR, Hassan AM. Acylated flavonol glycosides from Eugenia jambolana leaves. Phytochemistry. 2001;58:1239–44. doi: 10.1016/s0031-9422(01)00365-x. [DOI] [PubMed] [Google Scholar]
- 5.Lunardi I, Peixoto JL, Silva CC, Shuquel IT, Basso EA, Vidotti GJ. Triterpenic acids from Eugenia moraviana. J Braz Chem Soc. 2001;12:180–3. [Google Scholar]
- 6.Oliveira RN, Dias IJ, Camara CA. Comparative study of the essential oil of Eugenia punicifolia (HBK) DC. from different places of Pernambuco. Rev Bras Farmacognosia. 2005;15:39–43. [Google Scholar]
- 7.Fiúza TS, Saboia-Morais SM, Paula JR, Tresvenzol LM, Pimenta FC. Evaluation of antimicrobial activity of the crude ethanol extract of Eugenia uniflora L. Leaves. Rev Ciênc Farm Básica Apl. 2008;29:245–50. [Google Scholar]
- 8.Barbosa LN, Probst Ida S, Andrade BF, Alves FC, Albano M, da Cunha Mde L, et al. In vitro antibacterial and chemical properties of essential oils including native plants from Brazil against pathogenic and resistant bacteria. J Oleo Sci. 2015;64:289–98. doi: 10.5650/jos.ess14209. [DOI] [PubMed] [Google Scholar]
- 9.Cunha FA, Pinho AI, Santos JF, Sobral Souza CE, Albuquerque RS, Matias FF, et al. Cytoprotective effect of Eugenia uniflora L. against the waste contaminant mercury chlorid. Arab J Chem. 2016. [Last accessed on 2017 Mar 27]. In press. Available from: http://www.dx.doi.org/10.1016/J.Arabjc.2016.04.018 .
- 10.Rodrigues KA, Amorim LV, de Oliveira JM, Dias CN, Moraes DF, Andrade EH, et al. Eugenia uniflora L. essential oil as a potential anti-leishmania agent: Effects on Leishmania amazonensis and possible mechanisms of action. Evid Based Complement Alternat Med. 2013;2013:279726. doi: 10.1155/2013/279726. [DOI] [PMC free article] [PubMed] [Google Scholar]
- 11.Ferreira MR, Santiago RR, Langassner SM, Mello JC, Svidzinsk TI, Soares LA. Antifungal activity of medicinal plants from Northeastern Brazil. J Med Plants Res. 2013;7:3008–13. [Google Scholar]
- 12.Santos KK, Rolón M, Vega C, Arias AR, Costa JG, Coutinho HD. Antileishmanial in vitro activity of Eugenia uniflora and Momordica charantia. Rev Ciênc Farm Básica Apl. 2013;34:47–50. [Google Scholar]
- 13.Silva-Rocha WP, de Brito Lemos VL, Ferreira MR, Soares LA, Svidzisnki TI, Milan EP, et al. Effect of the crude extract of Eugenia uniflora in morphogenesis and secretion of hydrolytic enzymes in Candida albicans from the oral cavity of kidney transplant recipients. BMC Complement Altern Med. 2015;15:6. doi: 10.1186/s12906-015-0522-x. [DOI] [PMC free article] [PubMed] [Google Scholar]
- 14.Santos KK, Matias EF, Tintino SR, Souza CE, Braga MF, Guedes GM, et al. Anti-Trypanosoma cruzi and cytotoxic activities of Eugenia uniflora L. Exp Parasitol. 2012;131:130–2. doi: 10.1016/j.exppara.2012.02.019. [DOI] [PubMed] [Google Scholar]
- 15.Figueirôa Ede O, Nascimento da Silva LC, de Melo CM, Neves JK, da Silva NH, Pereira VR, et al. Evaluation of antioxidant, immunomodulatory, and cytotoxic action of fractions from Eugenia uniflora L. and Eugenia malaccensis L: Correlation with polyphenol and flavanoid content. ScientificWorldJournal. 2013;2013:125027. doi: 10.1155/2013/125027. [DOI] [PMC free article] [PubMed] [Google Scholar]
- 16.Biasi-Garbin RP, Demitto Fde O, Amaral RC, Ferreira MR, Soares LA, Svidzinski TI, et al. Antifungal potential of plant species from brazilian caatinga against dermatophytes. Rev Inst Med Trop Sao Paulo. 2016;58:18. doi: 10.1590/S1678-9946201658018. [DOI] [PMC free article] [PubMed] [Google Scholar]
- 17.Komarova NI, Rogachev AD, Chernyak EI, Morozov SV, Fomenko VV, Salakhutdinov NF. Quantitative HPLC determination of main flavonoid content of Rhododendron adamsii leaves and stems. Chem Nat Compd. 2009;45:27–31. [Google Scholar]
- 18.Fernandes AJ, Ferreira MR, Randau KP, de Souza TP, Soares LA. Total flavonoids content in the raw material and aqueous extractives from Bauhinia monandra Kurz (Caesalpiniaceae) ScientificWorldJournal. 2012;2012:923462. doi: 10.1100/2012/923462. [DOI] [PMC free article] [PubMed] [Google Scholar]
- 19.Glasl H, Becker U. Flavonol-O-glyckoside: Photometrische gehaltsbestimmung. Dtsch Apoth Ztg. 1984;124:2147–52. [Google Scholar]
- 20.Schmidt PC, Ortega GG. Passionsblumenkraut: Bestimmung des gesamtflavonoidgehaltes von Passiflorae herba. (Determination of the total flavonoide content of Passiflora herba) Dtsch Apoth Ztg. 1993;133:17–26. [Google Scholar]
- 21.Oliveira FG, de Lima-Saraiva SR, Oliveira AP, Rabêlo SV, Rolim LA, Almeida JR. Influence of the extractive method on the recovery of phenolic compounds in different parts of Hymenaea martiana hayne. Pharmacognosy Res. 2016;8:270–5. doi: 10.4103/0974-8490.188885. [DOI] [PMC free article] [PubMed] [Google Scholar]
- 22.Sankhalkar S, Vernekar V. Quantitative and qualitative analysis of phenolic and flavonoid content in Moringa oleifera Lam and Ocimum tenuiflorum L. Pharmacognosy Res. 2016;8:16–21. doi: 10.4103/0974-8490.171095. [DOI] [PMC free article] [PubMed] [Google Scholar]
- 23.da Silva LA, Pezzini BR, Soares L. Spectrophotometric determination of the total flavonoid content in Ocimum basilicum L. (Lamiaceae) leaves. Pharmacogn Mag. 2015;11:96–101. doi: 10.4103/0973-1296.149721. [DOI] [PMC free article] [PubMed] [Google Scholar]
- 24.Matos LL, Fernandes JM, Ferreira MR, Langassner SM, Soares LA. Evaluation of analytical method by spectrophotometry for quantification of total flavonoids from leaves of Kalanchoe brasiliensis Camb. (Crassulaceae) Bol Inf Geum. 2016;7:7–15. [Google Scholar]
- 25.Brazil. Ministry of Health. National Health Surveillance Agency – ANVISA. RDC n° 899, de 29 de maio de 2003 Guide for validation of analytical and bioanalytical methods Diário Oficial da República Federativa do Brasil; 02 jun 2003; Brasília, DF. [Google Scholar]
- 26.ICH. International Conference on Harmonisation of Technical Requirements for Registration of Pharmaceuticals for Human Use. Geneva: ICH; 2005. Validation of Analytical Procedures: Text and Methodology Q2 (R1) [Google Scholar]
- 27.Fumagali E, Correia Gonçalves RA, Machado MF, Vidoti GJ, Oliveira AJ. Production of plant secondary metabolites in plant cell and tissue culture: The example of Tabernaemontana and Aspidosperma genera. Rev Bras Farmacognosia. 2008;18:627–41. [Google Scholar]
- 28.Klein T, Longhini R, Bruschi ML, Mello JC. Phytomedicines: A promising market. Rev Ciênc Farm Básica Apl. 2009;30:241–8. [Google Scholar]
- 29.Lavecchia T, Rea G, Antonacci A, Giardi MT. Healthy and adverse effects of plant-derived functional metabolites: The need of revealing their content and bioactivity in a complex food matrix. Cr Rev Food Sci. 2013;53:198–213. doi: 10.1080/10408398.2010.520829. [DOI] [PMC free article] [PubMed] [Google Scholar]
- 30.Petry RD, Ortega GG, Silva WB. Flavonoid content assay: Influence of the reagent concentration and reaction time on the spectrophotometric behavior of the aluminium chloride-flavonoid complex. Pharmazie. 2001;56:465–70. [PubMed] [Google Scholar]
- 31.Chen Y, Wang J, Wan D. Determination of total flavonoids in three sedum crude drugs by UV-Vis spectrophotometry. Pharmacogn Mag. 2010;6:259–63. doi: 10.4103/0973-1296.71784. [DOI] [PMC free article] [PubMed] [Google Scholar]
- 32.Ying C, Wan D. Quantitative determination of total and individual flavonoids in stems and leaves of Buddleja davidii and Buddleja albiflora. Pharmacogn Mag. 2012;8:273–9. doi: 10.4103/0973-1296.103651. [DOI] [PMC free article] [PubMed] [Google Scholar]
- 33.Marques GS, Monteiro RP, Leão WF, Lyra MA, Peixoto MS, Rolim Neto PJ, et al. Evaluation of procedure for spectrophotometric quantification of total flavonoids in leaves of Bauhinia forficata Link. Quim Nova. 2012;35:517–22. [Google Scholar]
- 34.Zheng L, Wangl D, Lil Y, Pengl H, Yuang M, Gao F. Ultrasound-assisted extraction of total flavonoids from Aconitum gymnandrum. Pharmacognosy Mag. 2014;10:141–6. doi: 10.4103/0973-1296.127364. [DOI] [PMC free article] [PubMed] [Google Scholar]
- 35.Martins MC, Rodriguez-Amaya D, Morgano MA, Rodrigues MI. Optimization and validation of HPLC methodology for determining flavonols and flavones in bee pollen by surface methodology. Rev Inst Adolfo Lutz. 2011;70:122–31. [Google Scholar]
- 36.Galvão MA, Ferreira MR, Nunes BM, Santana AS, Randau KP, Soares LA. Validation of a spectrophotometric methodology for the quantification of polysaccharides from roots of Operculina macrocarpa (Jalapa) Rev Bras Farmacognosia. 2014;24:683–90. [Google Scholar]
- 37.Bagetta G, Cosentino M, Corasaniti MT, Sakurada S. Herbal Medicines: Development and Validation of Plant-Derived Medicines for Human Health. New York: CRC Press; 2012. [Google Scholar]
- 38.Chawla R, Thakur P, Chowdhry A, Jaiswal S, Sharma A, Goel R, et al. Evidence based herbal drug standardization approach in coping with challenges of holistic management of diabetes: A dreadful lifestyle disorder of 21st century. J Diabetes Metab Disord. 2013;12:35. doi: 10.1186/2251-6581-12-35. [DOI] [PMC free article] [PubMed] [Google Scholar]


