

Abstract
Recent studies across multiple tumour types are starting to reveal a recurrent regulatory architecture in which genomic alterations cluster upstream of functional master regulator (MR) proteins, the aberrant activity of which is both necessary and sufficient to maintain tumour cell state. These proteins form small, hyperconnected and autoregulated modules (termed tumour checkpoints) that are increasingly emerging as optimal biomarkers and therapeutic targets. Crucially, as their activity is mostly dysregulated in a post-translational manner, rather than by mutations in their corresponding genes or by differential expression, the identification of MR proteins by conventional methods is challenging. In this Opinion article, we discuss novel methods for the systematic analysis of MR proteins and of the modular regulatory architecture they implement, including their use as a valuable reductionist framework to study the genetic heterogeneity of human disease and to drive key translational applications.
There is an intriguing yet largely unexplored paradox in cancer. On the one hand, transcriptional programmes are highly conserved across samples that represent the same tumour subtype1 — even compared with normal tissue (FIG. 1a) — suggesting the existence of relatively stable tumour states. On the other hand, the genetic and epigenetic alterations (henceforth referred to as genomic alterations) that determine these states are remarkably heterogeneous on a sample by sample basis (BOX 1).
Figure 1. The architecture of tumour checkpoints.

a | The probability densities of normal and transformed cells are shown in a principal component (PC) projection that captures most of the sample variability of four tumour types: colorectal adenocarcinoma (COAD), kidney renal clear cell carcinoma (KIRC), uterine corpus endometrial cancer (UCEC) and prostate adenocarcinoma (PRAD). These distributions show a clear single-peak structure, suggesting that the regulatory logic of the tumour cell is effective in avoiding occupancy of states that are far away from the mean. Considering that cancer tissue may also be contaminated by extensive lymphocytic and stromal cell infiltration, the variance of the normal and tumour-associated distributions is of quite comparable magnitude. A comprehensive inventory of all tumour types in The Cancer Genome Atlas (TCGA) reveals that only a handful — such as head and neck squamous cell carcinoma (HNSC), kidney renal papillary cell carcinoma (KIRP) and liver hepatocellular carcinoma (LIHC) —present with substantially greater variance than the corresponding normal tissue. b | The proposed regulatory architecture implemented by master regulator (MR) proteins in tumour checkpoints is shown. MRs (blue spheres in shaded area) represent proteins the concerted, aberrant activity of which is both necessary and sufficient for cancer cell state maintenance. Their aberrant activity is induced by genes in their upstream pathways that are mutated in a specific patient (purple spheres) selected from a larger repertoire of candidate driver genes (green spheres), the mutation of which is recurrently detected in large cohorts. Passenger mutations (pale blue spheres) that are not upstream of MRs have no effect on tumour checkpoint activity and thus on the specific phenotype that the checkpoint regulates. Arrows in this diagram show regulatory and signalling interactions, that is, how one gene product regulates other gene products. Black arrows represent crucial top-down interactions leading from patient mutations first to activation of MR proteins in the tumour checkpoint and then to activation of downstream genetic programmes that are required for tumour phenotype presentation. Grey and blue arrows represent additional regulatory interactions that do not affect and are not affected by tumour checkpoint MRs, respectively. Dashed arrows represent feedback loops implemented either between the MR layer and the upstream modulators or between genes regulated by MR proteins and upstream MR modulators. The MR protein module in the shaded area represents the tumour checkpoint. Pink spheres represent genes that are differentially expressed as a result of the aberrant activity of MR proteins in the tumour checkpoint (that is, the tumour gene expression signature). Lightning bolts represent potential therapeutic interventions using pharmacological inhibitors. Inhibiting oncoproteins mutated in a large fraction (for example, 90%)of tumour sub clones will cause relapse owing to the presence of rare, alternative subclones harbouring either alternative or bypass mutations. A bypass mutation is a mutation that activates the pathway downstream of the pharmacological intervention point. By contrast, inhibiting the tumour checkpoint may represent a more effective strategy, as it captures the effect of all upstream mutations.
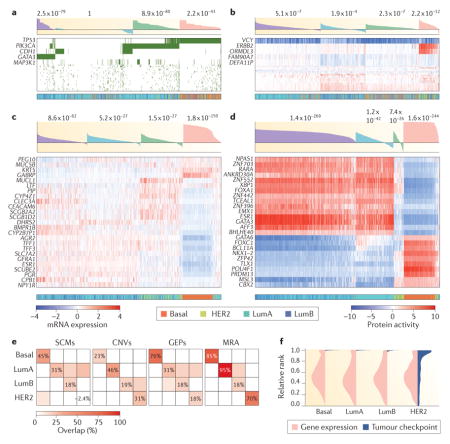
Box 1. The tumour subtype paradox.
The past decade has witnessed marked proliferation of tumour subtypes, mostly identified by gene expression clustering. For example, breast cancer has been divided into 4–10 subtypes4,5 and glioma into 3 or 4 subtypes3,79. Yet, there is little consistency between expression-based subtypes and stratification based on genetic alterations. For example, consider the breast cancer cohort in The Cancer Genome Atlas (TCGA; see Further information). We used standard unsupervised cluster analysis108 to identify the best four clusters based on distinct data types – somatic coding mutations (SCMs; part a of the figure), copy number variants (CNVs; part b of the figure), gene expression profiles (GEPs; part c of the figure) and master regulator activity (MRA; part d of the figure). This enables comparison of clustering results across these four data types and also against the clinically relevant Perou classification16 — including luminal A (LumA), luminal B (LumB), HER2+ (HER2) and basal-like (Basal). Silhouette score (shaded waterfall plots) and Perou classification (colour coded bars) are shown above and below the heat maps in parts a–d, respectively.
Surprisingly, but consistent with the tumour checkpoint hypothesis, three out of four of the clusters identified by either SCM or CNV analysis presented relatively low silhouette score (SS) significance, suggesting low internal consistency, and relatively low overlap with GEP-based clusters. One SCM cluster was not even statistically significant (SSSCM = −0.01, P = 1). Furthermore, part e shows the fraction of overlapping samples (above the expected background), for each cluster compared with each Perou subtype. As shown, the Perou classification was poorly recapitulated by SCM and CNV analysis, except for the Basal (SCM) and LumA (CNV) subtypes. Compared with SCM and CNV analysis, unsupervised GEP analysis improved cluster significance as well as Perou classification consistency, yet failed to fully differentiate between LumA, LumB and HER2 samples (parts c and e of the figure), which are intermixed in three out of four clusters. By contrast, MRA clustering (part d of the figure) not only improved the statistical significance of the four inferred clusters—a measure of cluster self-consistency—but also most closely recapitulated the Perou classification, with highly significant enrichment of cluster 1 (Basal, P = 3.1×10⁻¹⁷), cluster 2 (LumA, P = 3.1×10⁻¹⁹), clusters 3 (LumB, P = 3.6×10⁻⁴) and cluster 4 (HER2, P = 2.6×10⁻¹⁴).
These data suggest that subtype proliferation may have resulted, at least in part, from three sources of variability: noisy gene expression profiles (part c), independent clustering and heterogeneity of genetic alterations (parts a and b), potential coexistence of distinct tumour states in the same mass (tumour heterogeneity107) and stroma infiltration. Indeed, most tumour subtypes (including those of Perou) were identified by analysing a subset of the genes rather than by unbiased genome-wide analysis — with slight changes in gene selection producing significant variability in subtype identification.
To show the poor reproducibility of gene expression measurement, we plotted the distribution of the 10 most differentially expressed genes in each sample across all other same-subtype samples (part f of the figure). As shown, high differential expression in one sample is not predictive of differential expression across the full subtype. By contrast, the rank of the 10 most differentially active proteins in each sample, as inferred by Virtual Inference of Protein Activity by Enriched Regulon Analysis (VIPER), is extremely well conserved across the corresponding subtypes. Consistently, the most differentially active proteins in the LumA and LumB subtypes — see, for example, forkhead box A1 (FOXA1), GATA binding protein 3 (GATA3), oestrogen receptor 1 (ESR1) — represent established luminal lineage driver and subtype-specific tumour dependencies. As such, they are bona fide members of the LumA and LumB tumour checkpoints.
Consistent with these observations, although genomic alterations represent valuable predictors of targeted inhibitor sensitivity against the corresponding oncoproteins, they have proved less effective in stratifying more general properties of cancer, such as tumour subtype, metastatic potential and clinical outcome2,3, which are more often captured by transcriptional or proteomic profiles4,5 (BOX 1). For example, immunohistochemistry assays, as well as gene expression-based tests such as Oncotype DX and MammaPrint6, are routinely used in the clinic to assess the risk of breast cancer recurrence following hormonal therapy.
The ability of tumours to present similar transcriptional signatures, despite having radically distinct somatic mutational profiles, suggests the existence of regulatory mechanisms that are responsible for decoupling (that is, buffering) the tumour cell state from its genetic, epigenetic and signalling determinants7,8. Specifically, this Opinion article provides an overview of the emergence of a universal gene-regulatory architecture (henceforth referred to as oncotecture), in which a handful of master regulator (MR) proteins — organized into tightly autoregulated tumour checkpoint modules — implement and maintain the transcriptional state of a tumour cell largely independent of initiating events, as well as of endogenous and exogenous perturbations7,8. Much like a highway checkpoint, these modular structures canalize the effect of mutations and other aberrant signals in their upstream pathways to implement key downstream transcriptional programmes (FIG. 1b). Thus, although individual MR proteins are highly tumour specific9–11, the resulting tumour checkpoint oncotecture is virtually tumour independent7.
The term MR was initially introduced by developmental biologists to describe gene products (mostly transcription factors) at the top of regulatory hierarchies that are both necessary and sufficient to induce morphogenesis12 or specific steps in lineage differentiation13. By contrast, cancer biologists have adopted a looser definition of the term to indicate genetic determinants or functional drivers, the aberrant activity of which is sufficient — yet not strictly necessary — to induce transformation. According to the latter, TP53 (which encodes p53) and ERBB2 (which encodes HER2) are often presented as cancer MRs14,15, even though many alternative genomic alterations may induce transcriptional tumour states that are virtually indistinguishable from those in which those genes are mutated (BOX 1). For instance, several tumours classified as basal-like or HER2+ by gene expression profile analysis lack the hallmark genetic alterations in TP53 and ERBB2, respectively16. In this Opinion article, not only do we adopt the stricter MR definition from developmental biology but we further require MRs to directly regulate the transcriptional state of the tumour cell (FIG. 1b). Under this definition, a classic cancer driver such as p53 may not be considered a MR unless it is necessary and sufficient to implement a subset of tumours with a common transcriptional signature and it directly participates in its signature regulation. By contrast, the MYC proton coprotein, the locus of which is translocated in 100% of Burkitt lymphomas17 and which regulates their signature18, would emerge as a bona fide MR protein in that context.
This stricter terminology is not arbitrary. Instead, it is necessary to address the currently ambiguous use of the term in the literature, thus making identification of MR proteins a more rational and systematic process. Consistently, it separates the methodologies and studies discussed in this Opinion article from those aimed at identifying more loosely defined functional drivers or genetic determinants of cancer, for instance, by integrating mutational and gene expression profiles19, by network hub analysis20 or by other integrative network analyses21. A specific advantage of such stricter nomenclature is its ability to differentiate proteins representing effective pharmacological targets because of their necessary and direct role in maintaining tumour state from those that may be only sufficient, thus representing less crucial targets.
Cellular homeostasis and cancer
A large subset of the cell’s regulatory logic presides over homeostasis, a concept that can be traced back to the French physiologist Claude Bernard in 1865 and its refinement by Walter Cannon in 1929 (REF. 22). Homeostasis was originally defined as the set of regulatory processes that ensure the overall stability of a system, independent of endogenous and exogenous variables. This concept plays an especially important part in cell physiology, where its main role is to collapse a universe of potential cell states into a finite number of energetically and physiologically viable ones, each representing a distinct cell lineage or precursor stage. This process, better known as Waddington’s canalization23, was initially introduced to explain the robustness and stability of developmental phenotypes when confronted by genetic, epigenetic and environmental perturbations. It was later broadened to include the global mechanisms that preside over the stability of cellular phenotypes24.
The general view is that homeostasis is disrupted in disease, including in cancer25,26 (FIG. 2). And yet, tumour-associated states seem to be remarkably stable (FIG. 1a), suggesting that some form of stability control, albeit a dysregulated one, must still be at play. Indeed, similar to their normal counterpart, cancer cell states — as represented by their transcriptional signatures — are rather impervious to endogenous and exogenous variability, from germline and somatic variants, to pharmacological perturbations, microenvironment signals, temperature changes and nutrient availability. For instance, xenograft tumours in mice and even cancer cell lines can maintain a relatively high-fidelity representation of the transcriptional state of the original tumour, despite aberrant ploidy, mutational drift and massive changes in the repertoire of microenvironment signals to which they are exposed27. Similarly, cancer cells are easier to culture outside their original milieu than normal cells. Indeed, more than 1,000 cancer cell lines have been successfully established, compared with only a handful of cell lines representing immortalized normal tissue28.
Figure 2. Dysregulation of homeostatic control following malignant transformation and activation of dystasis control mechanisms that are responsible for the stability of tumour cell state.

This figure shows how normal cell physiology is determined by the energetic landscape of its regulatory networks, enabling cells to follow specific developmental trajectories that are highly insensitive to genetic, epigenetic and environmental variability, thus achieving stable end point states. This process, also known as Waddington canalization23, is illustrated in a cartoon showing differentiation from haematopoietic stem cell (HSC), to multi-lymphoid progenitor (MLP) to a fully differentiated human B cell as a set of transitions to states of progressively lower energy and thus higher stability. Disruption of this regulatory landscape by genetic alterations and environmental signals leads to physiological state loss and emergence of novel, stable disease states, for example, diffuse large B cell lymphoma (DLBCL). When multiple, quasi-isoenergetic states emerge, they can lead to coexistence of cells representing distinct tumour phenotypes in the same tumour mass or to tumour cell reprogramming to different states following treatment, a process known as tumour plasticity. For example, it has been shown that cells representing both the mesenchymal and the proneural subtype of glioma can coexist in the same tumour107 and that a small fraction of cells treated with tumour necrosis factor (TNF)-related apoptosis-inducing ligand (TRAIL) transiently reprogramme to a TRAIL-resistant state133. Whereas normal cell homeostasis presides over the stability of physiological cell states, by making them difficult to escape, we propose that a dysregulated form of these stability control processes (that is, tumour dystasis) is responsible for the stability of tumour-associated cell states and is mechanistically implemented by a small number of master regulator (MR) proteins in a tumour checkpoint.
Despite overwhelming evidence, however, a systematic investigation of the dystatic (short for dysregulated homeostatic) logic that ensues from transformation has not been undertaken. Recent results suggest that dystatic cell states may be implemented by a handful of tumour-specific MR proteins — working cooperatively within tight modular structures (tumour checkpoints) — the aberrant activity of which is necessary and sufficient for tumour phenotype presentation and maintenance7,9–11,29,30. If this hypothesis were further confirmed, these tumour checkpoints and associated MRS would constitute a novel class of mechanistic biomarkers and therapeutic targets11,29–31 and would further link cancer and development.
The tumour checkpoint hypothesis
Diffuse large B cell lymphoma (DLBCL) represents an ideal context in which to explore the tumour checkpoint hypothesis. Indeed, although never mutated in this malignancy, the canonical nuclear factor-κB (NF-κB) heterodimer (p50–RELA) represents a crucial dependency of the activated B cell (ABC) but not of the germinal centre B cell (GCB) subtype of DLBCL32. Indeed, aberrant NF-κB activity was shown to arise from several mutations in its upstream pathways, including in TNF-induced protein 3 (TNFAIP3), myeloid differentiation primary response 88 (MYD88), TNF receptor associated factor 2 (TRAF2), TRAF5, CD79A, CD79B, MAP3K7 (also known as TAK1), TNFRSF11A (which encodes RANK) and caspase recruitment domain family member 11 (CARD11)8,33,34 (FIG. 3). Moreover, NF-κB activity was essential for tumour viability only in DLBCL cells harbouring these events8. Finally, NF-κB transcriptional targets (as assessed by a literature search) were significantly differentially expressed in the ABC-DLBCL signature8, supporting its direct role in regulating subtype-specific programmes. Taken together, these findings support the role of the p50–RELA complex as a non-oncogene dependency35 and MR protein, consistent with our definition.
Figure 3. Diverse genetic alterations in upstream pathways contribute to aberrant NF-κB activity in DLBCL.

Systematic analysis of genes in pathways upstream of the nuclear factor-κB (NF-κB) complex revealed a large repertoire of diffuse large B cell lymphoma (DLBCL)-specific genetic alterations in B cell receptor (BCR) and myeloid differentiation primary response 88 (MYD88) pathways. The presence of these mutations leads to aberrant activation of the canonical p50-RELA heterodimer and associated tumour dependency. These mutations, which are more frequent in the activated B cell (ABC) subtype of DLBCL, have provided the rationale for the clinical development of several BCR pathway inhibitors, such as ibrutinib, a Bruton tyrosine kinase (BTK) inhibitor. CARD11, caspase recruitment domain family member 11; IFN, interferon; IL, interleukin; IRAK, IL-1 receptor-associated kinase; IRF4, interferon regulatory factor 4; ITAM, immune receptor tyrosine-based activation motif; JAK1, Janus kinase 1; MALT1, mucosa-associated lymphoid tissue lymphoma translocation protein 1; PKC, protein kinase C; STAT, signal transducer and activator of transcription; TIR, Toll-interleukin receptor; TRAF6, TNF receptor associated factor 6. Adapted with permission from REF. 134, Nature Publishing Group.
Although intriguing, however, these findings are not easily extended to other tumour types. Specifically, initial identification of NF-κB was more the product of investigator ingenuity than of generalizable methodologies32. Additionally, detailed information about pathways upstream of arbitrary candidate MR proteins is frequently unavailable. Thus, systematic elucidation of MR proteins requires the development of more effective methodologies to reconstruct and interrogate the genome-wide regulatory logic of the cancer cell.
MR and tumour checkpoint elucidation
Defining MR proteins as mechanistic regulators of the transcriptional signatures that define distinct tumour states helps with their systematic identification. Specifically it implies that the transcriptional targets of a bona fide MR protein must be enriched in genes that are differentially expressed in the cellular phenotype of interest (for example, tumour subtype, tumorigenesis, metastatic progression and drug sensitivity). More specifically, the positively regulated targets of an aberrantly activated MR protein should be overexpressed, whereas the negatively regulated (that is, repressed) ones should be underexpressed (FIG. 4). This provides a straightforward rationale for computational MR protein inference, using enrichment analysis methods such as the Kolmogorov–Smirnov test36 — as implemented by gene set enrichment analysis (GSEA)37 or by its analytical derivatives, such as analytical rank-based enrichment analysis (aREA)38. Indeed, when coupled with accurate, de novo identification of tissue-specific protein targets (regulons), this represents the conceptual foundation of the Master Regulator Inference Algorithm (MARINa)10,39 and of its extension to single sample analysis, Virtual Inference of Protein Activity by Enriched Regulon Analysis (VIPER)38. To further increase accuracy and sensitivity, these algorithms specifically account for target directionality (that is, activated versus repressed targets), regulon overlap between candidate MR protein pairs and target inference confidence38.
Figure 4. Protein activity inference from the expression of its regulatory targets.

a | Protein activity is the ultimate result of a complex cascade of molecular processes, from transcription and translation, to post-translational modification, complex formation and localization to appropriate subcellular compartments. As a result, there are no individual assays that can accurately measure protein activity in proteome-wide fashion. Instead, we have proposed that an accurate estimator of protein activity is represented by the gene expression of its transcriptional targets, that is, its regulon. This rationale is implemented by the Virtual Inference of Protein Activity by Enriched Regulon Analysis (VIPER) algorithm, based on transcription altargets inferred by reverse engineering algorithms such as Algorithm for the Accurate Reconstruction of Cellular Networks (ARACNe). b | When a protein is inactive its targets are randomly distributed in terms of differential expression. c | By contrast, when the same protein is aberrantly activated, its positively regulated targets become significantly overexpressed and its repressed targets become underexpressed. This can be effectively and quantitatively assessed by gene expression enrichment analysis methods. EGFR, epidermal growth factor receptor.
Most of the published studies on the unbiased inference of MR proteins as mechanistic regulators of disease cell state (even excluding those from our laboratory to avoid bias) either use the MARINa and VIPER algorithms directly (for example, see REFS 40–44) or rely on slightly modified versions (for example, see REFS 45–47). By contrast, as mentioned above, there are many network-based algorithms to identify key regulators, drivers and pathways involved in tumorigenesis that are not based on mechanistic regulation of target genes (for example, see REFS 19, 21). These are extensively covered by earlier reviews48,49 and will not be further discussed here.
MR analyses have helped elucidate proteins that regulate tumour-associated phenotypes as diverse as predisposition40,44, subtype-specific tumorigenesis10,43,50,51, progression to aggressive or metastatic disease9,11,12,45,47,52, stroma-specific regulation of tumour outcome41 and drug resistance29,30, most of which have been experimentally validated. In addition, their use in non-cancer phenotypes has helped to elucidate an equivalent disease checkpoint architecture in neurological phenotypes — including amyotrophic lateral sclerosis (ALS)53, Alzheimer disease7,54, Parkinson disease55 and alcohol addiction56 — and in developmental phenotypes, from regulation of germinal centre formation39 to stem cell pluripotency57. As briefly summarized below, these examples further outline the role of tumour checkpoint MRs in regulating disease dystasis and their unique nature compared with their physiological counterpart involved in homeostatic control.
Clearly, accurate transcriptional target inference, using reverse engineering methodologies, is crucial to the effective elucidation of candidate MR proteins and merits explicit mention (see also BOX 2). Postgenomic research has seen intense interest in the systematic dissection of the transcriptional and signalling logic of cancer cells (henceforth termed regulatory logic)48,53,55–57, including its transcriptional58–60, post-transcriptional61–63 and post-translational64–68 layers. These methods were first developed and validated in bacteria69 and yeast70,71 and then extended to mammalian cells21,59, thus complementing pre-existing literature-curated models72 and large-scale experimental assays73. The Algorithm for the Accurate Reconstruction of Cellular Networks (ARACNe)59 was the first of its kind to be experimentally validated in mammalian cells10,39,57,74 and has been among the most frequently used to infer regulatory targets for MR analysis. However, various alternative approaches have also been popular, from Bayesian networks75 to co-expression network integration with chromatin immunoprecipitation–sequencing (ChIP–seq) assays47. To achieve high accuracy, all these methods require relatively large collections (n≥100) of gene expression profiles representing a specific cellular context, under conditions that induce broad gene expression variability, such as from genetically heterogeneous tumour samples10 or from concomitant genetic and small molecule perturbations9. Reverse engineering methods have been extensively discussed in several reviews48,49,76 and will not be further discussed in this Opinion article.
Box 2. Alternative procedures for network reverse engineering and analysis.
Reverse engineering of regulatory networks represents a hallmark of systems biology, resulting in the development of hundreds of algorithms. Most of these algorithms fit one of the following five categories109: experimental maps, describing physical molecular interactions, such as protein–protein67,110,111 and protein–DNA interactions112,113; optimization-based approaches, searching for network topologies that optimally explain the observed data70,114; differential equation-based kinetic models, representing the concentration of relevant molecular species as a function of time and/or space115–117; correlation and information-theoretical approaches, producing genome-wide context-specific maps of functional molecular relationships59,118,119; and integrative approaches, leveraging partially independent clues for regulatory network reconstruction39,120.
Although all these methods have been benchmarked on their ability to reconstruct known topologies121, the dialogue for the reverse engineering assessments and methods (DREAM), a conference dedicated to evaluating systems biology algorithms based on double-blind benchmarking criteria122,123, has shown that performance depends strongly on the data type and target network size. For instance, kinetic models have the highest level of granularity but their large number of parameters limits their applicability to small networks with only a handful of molecules116. Optimization-based approaches, including Bayesian networks, provide an optimal choice for small to middle-sized network70. Correlation and information-theoretical methods are best suited to genome-wide regulatory network inference109 but provide only qualitative interaction models. Genome-wide networks can also be obtained by integrating experimental data from the literature or high-throughput experiments, but these models generally combine evidence from multiple, often non-physiological cellular contexts that may lack tumour-context specificity.
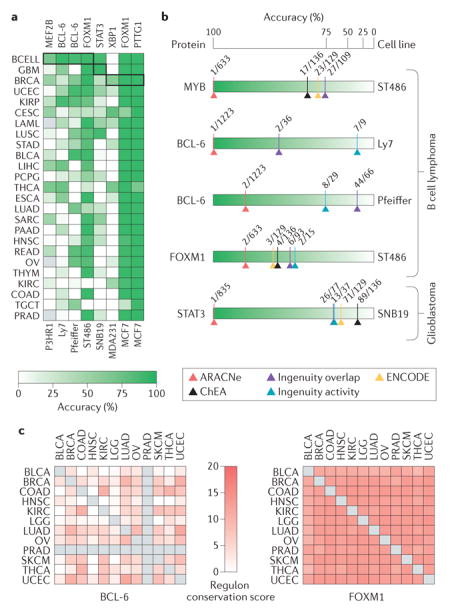
Information theory-based approaches have been used to produce genome-wide representations of yeast regulatory networks124,125 and context-specific models of mammalian cell regulation39,59,126. However, regardless of the level of complexity, the regulatory models they produce are context specific126,127. Different cellular lineages express different genes and even different protein isoforms, as expression products of alternative splice variants. Crucially, differential availability of scaffolding proteins or adaptors can profoundly reshape (rewire) the topology of protein–protein interaction networks128,129, and differential availability of cofactors and chromatin state between cells can lead to strong rewiring of transcriptional networks58,66,78. Thus, reliance on context-free, literature-based pathway models130, arising from the biologist’s desire to linearize and visualize the cell’s regulatory logic, can be misleading. The need for context-specific models is highlighted in parts a and b of the figure, where we show that the ability of Virtual Inference of Protein Activity by Enriched Regulon Analysis (VIPER) to correctly assess the activity changes of proteins encoded by silenced genes in lymphoma, glioma and breast carcinoma cells depends strongly on using the correct tissue-matched interactome38. Moreover, as also discussed in REF. 38, regulatory models based on ChIP enrichment analysis (ChEA)113 and Encyclopedia of DNA Elements (ENCODE)60 protein–DNA interaction data, as well as canonical pathways from the Ingenuity Pathway Analysis platform72 failed to properly detect differential activity of most proteins (see for example, BCL-6, the regulon of which is highly context specific) except forkhead box M1 (FOXM1), the regulatory programme of which is highly conserved across all tested tissues owing to its role in cell cycle regulation131 (part c of the figure). ARACNe, Algorithm for the Accurate Reconstruction of Cellular Networks; BCELL, B cell lymphoma; BLCA, bladder urothelial cancer; BRCA, breast invasive carcinoma; CESC, cervical squamous cell carcinoma and endocervical adenocarcinoma; COAD, colorectal adenocarcinoma; ESCA, oesophageal carcinoma; GBM, glioblastoma; HNSC, head and neck squamous cell carcinoma; KIRC, kidney renal clear cell carcinoma; KIRP, kidney renal papillary cell carcinoma; LAML, acute myeloid leukaemia; LGG, brain lower grade glioma; LIHC, liver hepatocellular carcinoma; LUAD, lung adenocarcinoma; LUSC, lung squamous cell carcinoma; MEF2B, myocyte enhancer factor 2B;OV, ovarian serous cystadenocarcinoma; PAAD, pancreatic adenocarcinoma; PCPG, pheochromocytoma and paraganglioma; PRAD, prostate adenocarcinoma; PTTG1, pituitary tumour-transforming 1; READ, rectal adenocarcinoma; SARC, sarcoma; SKCM, skin cutaneous melanoma; STAD, stomach adenocarcinoma; STAT3, signal transducer and activator of transcription 3; TGCT, testicular germ cell tumour; THCA, thyroid carcinoma; THYM, thymoma; UCEC, uterine corpus endometrial cancer; XBP1, X-box binding protein 1
Limitations and potential improvements
An important question arises as to the technical limitations of MR analysis methods and their reliance on accurate identification of transcriptional targets. A key problem is the considerable dependence of protein targets on tissue context. Indeed, MR targets are affected both by their tissue-specific epigenetic activation or inactivation and by the availability or mutation of cofactors participating in regulatory complexes66,77,78. This highlights the need for more sophisticated reverse engineering methodologies. Indeed, based on thorough benchmarking, activity changes can be accurately measured for only ~70% of transcriptional regulators and ~60% of signal transduction proteins on average38. Although this is certainly adequate to support discovery of many novel mechanisms, it is still susceptible to substantial false-positive and false-negative inferences. Consistent with these observations, the use of tissue-specific regulatory models (interactomes) has proved crucial, as statistical significance of inferred MRs decreases when mismatched models are used9,38. Indeed, differential protein activity following short hairpin RNA (shRNA)-mediated silencing of transcription factor proteins in different tumour contexts was effectively detected using regulatory models generated from the same tissue context but not from mismatched tissues (BOX 2). Interestingly, the advent of efficient and economical single-cell profiling may herald a new era in network reverse engineering as it will avoid averaging over key processes (for example, cell cycle) and cell states (for example, tumour and stroma). This will help to avoid typical limitations imposed by intratumoural heterogeneity, such as stroma and immune cell infiltration, thus producing more accurate gene regulatory models and improving the accuracy of MR identification, which is substantially degraded when tumour cellularity drops below 70%.
An additional limitation is the complexity of inferring the activity of proteins that share a substantial subset of their regulatory targets. Although specific solutions to this problem have been proposed38,39, the combinatorial complexity of target regulation is still not completely addressed, potentially resulting in false-positive findings requiring substantial experimental validation. Finally, a crucial issue is represented by the inference of protein activity in a dynamic context — for example, following a drug perturbation — rather than in regimes approaching cellular equilibrium. In these transient conditions, the correlation between mRNA abundance and protein abundance may be time delayed or even inverted. Ultimately, we foresee that more specialized kinetic models will be required to describe the relationship between target mRNA abundance and protein activity, leading to a more effective generation of dynamic MR inference algorithms.
MR discovery in cancer biology
The following sections describe some crucial applications of MR analysis and some of the general principles that have consistently emerged from multiple MR studies.
The tumour checkpoint of mesenchymal glioblastoma
Glioblastoma (GBM) presents with multiple molecular subtypes. Despite classification differences79,80, there is global consensus that the mesenchymal subtype (MES-GBM) is associated with the poorest prognosis7,79. The first reported example of systematic MR analysis and validation elucidated a MES-GBM-specific tumour checkpoint, including six MR proteins — β and δ isoforms of CCAAT/enhancer-binding protein (CEBP), signal transducer and activator of transcription 3 (STAT3), class E basic helix–loop–helix protein 40 (BHLHE40; also known as BHLHB2), runt-related transcription factor 1 (RUNX1) and Fos-related antigen 2 (FOSL2). These were validated as positive mechanistic regulators of >74% of MES-GBM signature genes. A seventh MR — zinc finger protein 238 (ZNF238) — was identified as an aberrantly inactivated MR and was independently confirmed as a fibroblast-to-neuron reprogramming factor81. Surprisingly, these MRs were not among the 500 most differentially expressed genes and only one of them (CEBPD) was later found to be focally amplified in 30% of MES-GBMs7.
Further analysis revealed a highly modular architecture, with CEBPβ, CEBPδ and STAT3 regulating each other as well as the other MRs and jointly regulating the MES-GBM gene expression signature through a large number of feed-forward loops (FIG. 5). Although only ~6% of CEBPβ and STAT3 target genes were mesenchymal, based on Gene Ontology, 36% of targets regulated by both CEBPβ and STAT3 were mesenchymal, suggesting synergistic interaction39. Indeed, ectopic co-expression of CEBPβ and STAT3 (but not of either one in isolation) was sufficient to induce reprogramming of neural stem cells along an aberrant mesenchymal lineage. Conversely, shRNA-mediated silencing of both genes (but not of either one in isolation) was sufficient to abrogate viability of MES-GBM tumours in mouse xenograft models. Pure feed-through regulation, for example, as implemented by an ‘AND’ or ‘OR’ logic, cannot explain CEBPβ and STAT3 dependency for both module activation and inactivation. As was later confirmed7, this implies existence of an autoregulatory logic implemented by feedback loops.
Figure 5. Tumour checkpoint architecture of the mesenchymal subtype of glioblastoma.

Transcription factors involved in the activation of mesenchymal glioblastoma (MES-GBM) subtype are shown in purple. Overall, the six transcription factors shown in this figure—CCAAT/enhancer-binding protein-β (CEBPβ) and CEBPδ are represented by CEBP, for simplicity, as they form homodimers and heterodimers — control 74% of the genes in the mesenchymal signature of high-grade glioma. A region between 2 kb upstream and 2 kb downstream of the transcription start site of the target genes identified by Algorithm for the Accurate Reconstruction of Cellular Networks (ARACNe) was analysed for the presence of putative binding sites. When combined with analysis of gene expression profiles following short hairpin RNA (shRNA)-mediated silencing of these transcription factors, the latter were shown to bind and regulate the large majority of MES-GBM signature genes (shown in pink). In addition, CEBP (both β and δ subunits) and signal transducer and activator of transcription 3 (STAT3) were shown to regulate the other three transcription factors in the tumour checkpoint and to synergistically regulate the state of MES-GBM cells. ACTA2, actin α2; ACTN1, actinin α1; ANGPT2, angiopoietin 2; ANPEP, alanyl aminopeptidase; BACE2, β-site APP-cleaving enzyme 2; B4GALT1, β-1, 4-galactosyltransferase 1; BHLHE40, class E basic helix–loop–helix protein 40; CA12, carbonic anhydrase 12; C1QTNF1, C1q and tumour necrosis factor related protein 1; C1R, complement C1r; C1RL, complement C1r subcomponent like; CHI3L1, chitinase 3 like 1; COL4A2, collagen type IVα1 chain; ECE1, endothelin converting enzyme 1; EFEMP2, EGF containing fibulin like extracellular matrix protein 2; EFNB2, ephrin B2; EHD2, EH domain containing 2; EMP1, epithelial membrane protein 1; ESM1, endothelial cell specific molecule 1; FCGR2A, Fc fragment of IgG receptor IIa; FLNA, filamin A; FOSL2, Fos-related antigen 2; FPRL1, formyl peptide receptor-like 1; HRH1, histamine receptor H1; ICAM1, intercellular adhesion molecule 1; IFITM, interferon induced transmembrane protein; IL32, interleukin-32; TGA7, integrin subunit α7; LIF, leukaemia inhibitory factor; MMP, matrix metalloproteinase; MVP, major vault protein; MYH9, myosin heavy chain 9; MYL9, myosin light chain 9; NRP2, neuropilin 2; OSMR, oncostatin M receptor; PAPPA, pappalysin 1; PDLIM4; PDZ and LIM domain 4; PDPN, podoplanin; PELO, pelota homologue; PI3, peptidase inhibitor 3; PLA2G5, phospholipase A2 group V; PLAU, plasminogen activator, urokinase; PLAUR, PLAU receptor; PVRL2, poliovirus receptor-related 2; PTRF, polymerase I and transcript release factor; RRBP1, ribosome binding protein 1; RUNX1, runt-related transcription factor 1; SGSH, N-sulfoglucosamine sulfohydrolase; S100A11, S100 calcium binding protein A11; SLC39A8, solute carrier family 39 member 8; SOCS3, suppressor of cytokine signalling 3; TAGLN, transgelin; THBD, thrombomodulin; TIMP1, tissue inihibitor of metalloproteinase 1; TMEPAI, transmembrane prostate androgen-induced protein; TNC, tenascin C; TPP1, tripeptidyl peptidase 1; ZYX, zyxin. Adapted with permission from REF. 10, Nature Publishing Group.
Notably, cancer states represent the superposition of multiple independent hallmarks82. This requires the potential coexistence of multiple tumour checkpoints, each one regulating or buffering one or more of these programmes. In glioma, for instance, MES-GBM MRs were shown to regulate migration, invasion and angiogenesis but not proliferation or apoptosis. As a result, although still crucially necessary for tumour state maintenance and in vivo tumour viability, their co-activation is not sufficient for tumorigenesis. This is easily explained: tumour checkpoint analysis identifies MRs that are necessary and sufficient to implement a specific differential phenotype, as captured by the corresponding differential gene expression signature. Thus, the analysis will miss MRs of programmes that are unchanged in the transition. The differential expression signature used in the GBM study represents the difference between its mesenchymal and its proneural subtypes, which are distinct, yet both tumour-associated states. Hence, tumorigenesis programmes are essentially removed from the analysis. This is important, because the specific selection of cellular states that define the gene expression signature ultimately determines the role of identified MR proteins, and selection of inappropriate signatures can drastically affect the outcome of MR studies.
This study highlighted six hallmark properties of tumour checkpoints that were also confirmed in follow-up studies, both in cancer7,9,29,30,83 and in other phenotypes39,53,55–57. Specifically, MR proteins form highly modular and tightly regulated structures (tumour or disease checkpoint modules) (FIG. 5); implement stable, redundant control of downstream cancer programmes through multiple feed-forward loops; regulate each other, both directly and via autoregulatory loops, thus increasing tumour checkpoint stability; are highly enriched in tumour-specific dependencies, including essential MRs and/or synthetic lethal MR pairs; are differentially active but not generally differentially expressed; and only rarely harbour genetic alterations. Among these, the first four points also represent crucial hallmarks of homeostatic control. Indeed, because of their inherent stability, tumour checkpoint collapse generally requires co-inhibition of two or more proteins (that is, synthetic lethality). This decreases the chances of detecting key synthetic lethal MRs, such as STAT3 and CEBPβ in MES-GBM, by pooled RNA interference (RNAi) or CRISPR-based functional screens that target individual genes.
Cross-species MR analysis
The hallmarks of a tumour checkpoint oncotecture were further recapitulated by cross-species analysis of aggressive prostate cancer checkpoint MRs, using data from both human biopsies and genetically engineered mouse models9. Gene expression profiles for interactome generation were obtained from a high-quality human cohort, for which both expression and outcome data were available84, and from prostate tissue harvested from 13 distinct genetically engineered mouse models (including wild-type controls) following in vivo treatment with 14 compounds targeting prostate-relevant pathways (including dimethylsulfoxide (DMSO) as control medium). A gene expression signature of aggressive human prostate cancer was obtained by comparison of gene expression in tumours with high Gleason score with confirmed biochemical recurrence within 3 years, against gene expression of tumours with low Gleason score with no biochemical recurrence. Equivalent signatures were obtained from four distinct genetically engineered mouse models associated with aggressive disease (harbouring Myc, Trp53, Braf and Kras mutations). Strikingly, 8 of the top 20 human MRs identified by the analysis were also identified from each of the four mouse model-derived gene expression signatures. This included the only predicted synergistic MR pair — forkhead box M1 (FOXM1) and centromere protein F (CENPF) — the universal synthetic lethality of which in aggressive prostate cancer was validated in vitro and in vivo. Synthetic lethality of this MR pair in malignant prostate cancer emerged as virtually independent of both genetic and organism background, thus further supporting the hypothesis that checkpoint MRs uncouple tumour phenotypes from upstream genetics. These results were further confirmed in a cohort of >900 patients, for which tissue microarrays (TMAs) were available. Although almost no patients with double negative immunohistochemistry (IHC) staining for FOXM1 and CENPF at diagnosis died of the disease for up to 20 years from diagnosis, those with double positive FOXM1 and CENPF IHC constituted 90% of prostate cancer-associated deaths, suggesting that co-activation of FOXM1 and CENPF is necessary and sufficient to implement the most aggressive form of these tumours that are associated with poor prognosis.
Integration with functional screens
MR analysis may also be used effectively to mitigate discovery of idiosyncratic dependencies from pooled RNAi screens. For instance, isogenic MCF-10A breast epithelial cell lines, with and without ectopic HER2 expression (MCF-10A/HER2 versus MCF-10A), were screened in 2D and 3D cultures using a pooled, genome-wide RNAi library. Integrative analysis of RNAi screen and MR analysis identified only two genes in common (STAT3 and agrin (AGRN)), which were validated as MRs of trastuzumab (a HER2-inhibiting antibody) resistance. Indeed, their silencing in trastuzumab-treated, resistant tumours elicited synthetic lethality in vitro and in vivo29, leading to the discovery of an autocrine STAT3–interleukin 6 (IL-6)–IL-6 receptor (IL6R)–Janus kinase (JAK)–STAT3 autoregulatory loop, independent of trastuzumab-mediated inhibition of HER2. Consistently, trastuzumab and ruxolitinib (a US Food and Drug Administration (FDA)-approved JAK inhibitor) combination therapy effectively abrogated the viability of trastuzumab-resistant patient-derived xenografts (PDXs)29, providing the rationale for a phase I/II clinical trial85.
The oncotecture of tumour relapse
Progression to drug-resistant disease represents perhaps the most substantial challenge in cancer treatment. Indeed, despite initial and often striking responses to therapy, most cancer patients will relapse with poor prognosis tumours that no longer respond to chemotherapy or targeted therapy. Thus, there is a pressing need for novel methodologies to identify therapeutic targets that either predict relapse or rescue drug sensitivity in relapsed tumours. For example, subclonal expansion of drug-resistant clones, for instance, is a well-studied relapse mechanism. Indeed, because of the extensive genomic diversity of individual tumour cells, it is only a matter of time before one or more drug-resistant subclones emerges with bypass or alternative mutations86,87. However, many additional adaptive mechanisms exist that modulate drug sensitivity epigenetically, including transient88 or stable89 epigenetic reprogramming, as well as by triggering mechanisms of resistance that are purely regulatory in nature29 — for instance, from activation of autocrine feedback loops, as discussed above. In each case, drug resistance is associated with a stable and molecularly distinct tumour cell state. It is thus reasonable to consider whether these states might also be implemented and maintained by aberrant activity of specific tumour checkpoints and whether pharmacological targeting of the corresponding MRs might rescue sensitivity or even prevent relapse.
MRs of glucocorticoid resistance in T cell acute lymphoblastic leukaemia
The tumour checkpoint-MR conceptual framework was applied to the study of glucocorticoid (GC) resistance in T cell acute lymphoblastic leukaemia (T-ALL). Despite their highly heterogeneous genetic determinants90, first-line therapy for these tumours universally relies on a class of high-affinity, cognate binding agonists of the GC receptor nuclear receptor subfamily 3 group C member 1 (NR3C1). Although never mutated in leukaemias, NR3C1 regulates apoptosis by direct transcriptional activation of the pro-apoptotic factor BCL-2-like protein 11 (BCL2L11; also known as BIM). Remarkably, 70% of GC-treated T-ALLs undergo long-term remission. However, 30% of them relapse within weeks with GC-resistant disease and poor prognosis.
To identify MRs of GC-therapy resistance, we analysed gene expression signatures collected at diagnosis (that is, before treatment) from 22 patients with GC-resistant disease and 10 patients with GC-sensitive disease. Differential gene expression of resistant versus sensitive tumours was then used for MR analysis, using a T-ALL-specific interactome. The analysis identified nine MR proteins, three of which — serine/threonine protein phosphatase 2A 56 kDa regulatory subunit-δ (PPP2R5δ), galactosylgalactosylx-ylosylprotein 3-β-glucuronosyltransferase 3 (B3GAT3) and AKT1 — rescued sensitivity to dexamethasone (a NR3C1 agonist), when silenced in GC-resistant cells. AKT1-mediated NR3C1 phosphorylation at Ser134, in particular, prevented NR3C1 nuclear translocation and transcriptional activation of BCL2L11 (REF. 30). Consistently, treatment with MK2006 (an AKT1 inhibitor) rescued dexamethasone sensitivity in vitro and in vivo, including in PDXs transplanted with leukaemic cells from patients with GC-resistant disease30. AKT1 thus emerged as a key tumour checkpoint MR downstream of recurrent T-ALL mutations, including in PI3K and PTEN and further mediating resistance by inducing mTOR-mediated increase in the expression of the MCL1 antiapoptotic gene91.
A key aspect of this study is that it confirmed the ability to extend MR analyses to signal transduction proteins, based on identification of their least-indirectly regulated transcriptional targets, as also shown in REF 38.
MR-based model fidelity assessment
The above-discussed studies highlight a key property of tumour checkpoints, specifically their conservation, independent of specific driver mutation patterns and even across different organisms. This is important because, compared with their human counterparts, driver mutations and microenvironment signals in cell lines and preclinical models are highly idiosyncratic. This suggests that tumour checkpoint conservation, as objectively assessed by MR enrichment analysis, may support more effective use of these models as high-fidelity, predictive experimental surrogates. This would be quite valuable, as validation in cell lines and in preclinical models — including genetically engineered mouse models and xenografts — is considered mandatory on the path to clinical translation92.
More specifically, these results support the idea of a human-to-mouse-to-human (H2M2H) methodology31,93, in which preclinical models are optimally matched to human tumours based on the statistical significance of their tumour checkpoint MR overlap. This would increase the probability of results from preclinical studies using these models being relevant to human disease. As all the steps required for MR inference — including network reverse engineering and MR analysis — rely exclusively on patient-derived tissue, MR identification is completely free of bias from using cell line and model organisms. This limits the use of MR-matched models only to validation assays rather than to discovery assays. By contrast, classic drug discovery methods screen for targets and inhibitors using cell lines or animal models, the relevance of which to human disease is questionable, not quantitatively assessed and often subjective, thus reducing the probabilities that results may translate to clinical studies.
Genetic determinants of MR activity
Similar to p50-RELA in ABC-DLBCL, lack of differential MR expression or mutations suggests that aberrant activity of MES-GBM MRs (that is, CEBPβ, CEBPδ and STAT3) may result from genomic alteration in their upstream pathways. Although several algorithms can detect association of genomic alterations with differential gene expression (genetical-genomics)94 or perform network-based clustering of genomic alterations95 (see REF 48 for a review), there are no methods for the genome-wide, tumour-specific exploration of alterations in signalling pathways upstream of candidate MR proteins.
The Driver-gene Inference by Genetical-Genomics and Information Theory (DIGGIT) pipeline7, available from Bioconductor96, was developed precisely to address this challenge. DIGGIT relies on the Modulator Inference by Network Dynamics (MINDy) algorithm66 to systematically identify all candidate modulators of one or more MR proteins in their upstream pathways. One may argue that extensive feedback control — including via paracrine interactions with the stroma — may dramatically inflate the number of upstream pathway proteins. Yet, MINDy-based inference reveals only a relatively small number (10–100) of statistically significant modulators of any candidate MR, most of which are experimentally confirmed, thus dramatically reducing the potential search space for mutations that may affect MR activity7,66.
For instance, among the multitude of genes of which the expression was affected by recurrent copy number alterations (CNAs) in the MES-GBM subtype, MINDy inferred that only 92 genes were either MRs or upstream MR-activity modulators. Of these, only 21 showed significant association between their corresponding CNA and the activity of MES-GBM MRs. Conditional association analysis of these 21 genes revealed only two statistically independent alterations, including amplification of CEBPD, itself an MR, in ~30% of MES-GBM tumours, and homozygous deletion of kelch-like family member 9 (KLHL9) — a putative adaptor protein in the cullin 3 (CUL3) ubiquitin ligase complex — in ~50% of the MES-GBM tumours. Experimental validation and independent cohort analysis confirmed that competent KLHL9 activity is crucial for ubiquitin-dependent proteasomal degradation of CEBPβ and CEBPδ, as well as for STAT3 dephosphorylation. Consistent with this result, IHC analysis of KLHL9−/− tumours showed significant increase in CEBPβ and CEBPδ protein abundance, and their in vivo viability was dramatically reduced by ectopic KLHL9 expression7. Similar analyses were also carried out in breast cancer7 using different MRs, inferred at the individual sample level.
These results define two distinct protein classes: the first class includes MR proteins (for example, CEBPβ and STAT3), co-activation of which is strictly necessary and sufficient for tumour phenotype presentation. The second class includes MR modulators, dysregulation of which by mutations or aberrant signals induces aberrant MR activity (for example, KLHL9 and CEBPδ). Proteins in the latter class, which includes most of the established oncogenes and tumour suppressors, may be sufficient but not necessary for tumour checkpoint activity and phenotype presentation and are thus not predicted to be MRs by MARINa. For instance, KLHL9 is deleted in only ~50% of MES-GBM samples, suggesting that this event is not strictly required for MES-GBM subtype implementation. In rare cases in which aberrant MR activity results from genetic alterations at its locus (for example, CEBPD), these two classes may overlap.
When combined with identification of mutations in pathways upstream of NF-κB in DLBCL and with conservation of prostate cancer MRs in four different genetically engineered mouse models with distinct driver mutations, these studies further confirm that tumour checkpoints represent the cellular logic that is responsible for integrating the effect of large and heterogeneous genomic alteration repertoires into virtually indistinguishable tumour states. This also supports the role of tumour checkpoint MRs as highly conserved, mechanistic therapeutic targets and biomarkers. Indeed, based on the proposed oncotecture model, tumour checkpoints emerge as the regulatory pillars of tumour dystasis and thus, potentially, as the universal Achilles heels of cancer. Consistent with this observation, these and other studies have shown that collapse of tumour checkpoint activity — as induced from genetic9,10 or pharmacological11,29–31 inhibition of individual MRs or MR pairs — induces crucial loss of tumour state and abrogation of tumour viability or rescue of drug sensitivity, in vitro and in vivo. This has important consequences in terms of the potential use of tumour checkpoints as more universal (that is, mutation independent) tumour vulnerabilities that are intrinsically less susceptible to typical relapse mechanisms. Indeed, whenever relapse is induced by alternative or bypass mutations or by epigenetic mechanisms that act upstream of the same tumour checkpoint, its direct targeting should mitigate relapse29,30.
Extending oncogene dependency
Tumorigenesis arises from the aberrant activity of multiple gene products working in concert. Activating mutations represent a highly reproducible predictor of aberrant oncogene activity and can thus be used to pinpoint valuable pharmacological targets, as proposed by the oncogene addiction hypothesis97. Indeed, following the clinical success of imatinib — an inhibitor of the BCR-ABL fusion protein in chronic myelogenous leukaemia (CML)98 — oncogene addiction has become a de facto paradigm for targeted therapy in precision medicine.
Yet, direct mutations are only one of many ways to induce aberrant protein activity, and there are innumerable alternatives to achieve a virtually identical objective. These include mutation in upstream modulators7,8, cognate binding partners99 and autoregulatory loops29, among others8,100. Even assuming a single functional mutation per gene product, the activity of oncoproteins regulated by ≥100 other gene products, such as MYC66, could be dysregulated by any combination of mutated oncogenes out of the 100 possible ones. This accounts for more than 1030 distinct genomic alteration patterns, as computed by the binomial coefficient formula. Even if most of them failed to induce pathogenic activity levels, it is still reasonable to expect the existence of a large number of distinct, non-recurrent yet tumorigenic mutational patterns. For instance, PTEN activity in glioma was shown to be dysregulated by multiple deletions of any among 13 frequently deleted genes61, each individually affecting PTEN expression by less than 20%. Unfortunately, owing to multiple hypothesis testing, evaluating the statistical significance of such polygenic patterns would require prohibitive cohort sizes.
Two important observations emerge from these considerations. First, despite successful identification of key recurrent, high-penetrance driver mutations — such as BCR-ABL translocation events in CML98, KRAS mutations in up to 90% of pancreatic ductal adenocarcinomas101, BRAF mutations in almost 50% of melanomas102 and ERBB2 amplification in 20–30% of breast ductal adenocarcinomas103 — we are starting to run out of such low-hanging fruits. It is thus reasonable to expect a long tail of more complex (additive or epistatic) genomic alteration patterns that will be increasingly less recurrent and thus harder to dissect via statistical inference methods. Among other things, this suggests that existing targeted inhibitors could be used more effectively in the clinics if oncoprotein activity could be assessed directly, rather than indirectly based on mutations (BOX 3).
Box 3. Protein activity inference complements analysis of genetic alterations in assessing aberrant oncoprotein activity.
Cancer is driven by the aberrant activity of proteins (oncoproteins) working in concert to regulate tumour cell states. Indeed, pharmacological inhibition of aberrantly activated oncoproteins can elicit oncogene dependency, which represents the basis for the oncogene addiction paradigm and the foundation of current efforts in precision cancer medicine97. Activating genetic alterations have thus emerged as an important rationale for the identification of therapeutic targets in individual patients. Yet, activating mutations represent only one of many possible ways of dysregulating protein activity, which may also result from a vast complement of genetic and epigenetic events in cognate binding partners99 and upstream regulators7. For instance, lung adenocarcinoma (LUAD) cells with activating mutations in a specific oncogene (for example, the epidermal growth factor receptor (ECFR)) may be sensitive to the corresponding targeted inhibitor (erlotinib). Yet cells lacking these mutations may also present equivalent sensitivity28,132 (see part a of the figure, which shows 80 Cancer Cell Line Encyclopedia (CCLE) lung cancer cell lines ranked by their sensitivity to erlotinib—the expanded inset shows the 25 cell lines with the highest sensitivity to erlotinib). Conversely, owing to homeostatic feedback mechanisms and epigenetic allele silencing, activating mutations may not guarantee aberrant oncoprotein activity. As a result, the direct or inferred assessment of protein activity may constitute a valuable complement to genetic analysis for prioritization of targeted therapy, especially as a large proportion of cancer patients present no actionable oncogene mutations. Indeed, samples from The Cancer Genome Atlas (TCGA) LUAD cohort show striking enrichment of activating EGFR mutations in samples with the highest Virtual Inference of Protein Activity by Enriched Regulon Analysis (VIPER)-inferred EGFR activity (part b of the figure – the expanded inset shows samples with the highest activity). However, many samples showed comparably high activity but no activating mutations, suggesting that they may also respond to targeted EGFR inhibitors, as shown for the cell lines. AUC, area under the curve; GSEA, gene set enrichment analysis; NES, normalized expression score.
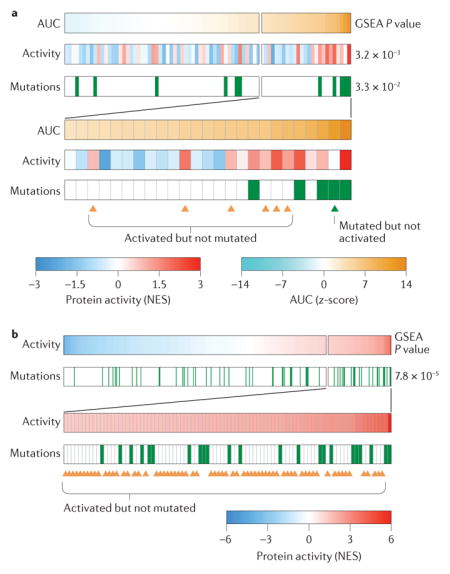
Indeed, VIPER-inferred oncoprotein activity systematically outperformed activating mutations in predicting sensitivity to targeted inhibitors by an order of magnitude in statistical significance on average. For instance, the P value of erlotinib sensitivity prediction in 80 Cancer Cell Line Encyclopedia (CCLE) lung cancer cell lines is P = 3.3 × 10⁻² when the mutational status of epidermal growth factor receptor (EGFR; the target of erlotinib) is used, and P = 3.2 × 10⁻³ when VIPER-inferred EGFR activity is used BOX 3). This suggests that the oncogene addiction paradigm could be complemented and extended by direct measurement or inference of protein activity.
Pharmacological MR targeting
Elucidation of tumour checkpoint MRs and MR pairs that represent either individual (essential) or synergistic (synthetic lethal) dependencies, independent of the associated genomic alterations, provides a largely novel and more universal repertoire of targets for pharmacological intervention. However, many of the MRs and MR pairs that determine tumour checkpoint activity are transcription factors, which are considered challenging or even undruggable targets. As a result, even if MR proteins were effectively validated as valuable therapeutic targets, development of small molecule inhibitors that modulate their activity may require an entirely novel chemistry.
Yet, the current repertoire of FDA-approved drugs includes ~2,000 compounds, with an additional ~400 oncology-related investigational compounds in late-stage (phase II/III) clinical studies. Many of these have mechanisms of action (MOAs) that are only partially elucidated and may thus represent unexpected, tumour-specific inhibitors of MR proteins. Specifically, we have shown that systematic perturbational assays, either in vitro104,105 or in vivo31, using tumour-representative cell lines or mouse models, can help to prioritize targeted inhibitors optimally suited to the abrogation of tumour checkpoint MR activity, including MRs that are usually thought to be undruggable11,31. The rationale for these studies is that, although crucial tumour dependencies may be substantially different in the human tumour context versus in vitro and in vivo models, drug MOA is generally reasonably well conserved. Indeed, pharmacological compound MOA is typically elucidated in vitro. Of course, compounds that modulate the immune system — such as the recent repertoire of cytotoxic T lymphocyte-associated antigen 4 (CTLA4) and programmed cell death protein 1 (PD1; also known as PDCD1)–PD1 ligand 1 (PDL1; also known as CD274) inhibitors — would have to be investigated either in immune system-related cell lines or in transgenic mouse models with an intact immune system.
The ability of a compound to inhibit specific MR proteins is directly reflected in the inversion of expression of its regulon. As a result, the same regulons used to identify tumour MRs represent ideal quantitative reporter assays to prioritize their candidate inhibitors, specifically by measuring enrichment of their regulons in genes that are differentially expressed following compound perturbation, for example, as discussed in REF. 38.
To validate this approach, we performed systematic perturbation of human DLBCL cells, including OCI-LY7 cells using 14 compounds and then of OCI-LY3, OCI-LY7 and U-293 cells using 92 FDA-approved compounds, at different time points and at multiple concentrations. Gene expression profiles from these assays were then used to systematically elucidate the MOA of the compounds105 and their ability to target disease-specific MR genes, either individually or in combination (synergistically)104. This successfully demonstrated that interrogation of gene regulatory networks reconstructed de novo in context-specific tumours can help to elucidate compound MOA and identify compounds and compound combinations that target the activity of DLBCL subtype-specific MR proteins, thus reducing tumour viability. Surprisingly, for instance, at a low false discovery rate (FDR = 8%), >60% of predicted synergistic compound combinations were experimentally confirmed by isobologram analysis104,106. These data were valuable for the identification of drugs and drug combinations that abrogateviability of aggressive follicular lymphoma cells following transformation to DLBCL11, by targeting experimentally validated MRs and synergistic MR pairs. In vivo, we recently showed that a similar approach could identify drug combinations that abrogate FOXM1 and CENPF activity in multiple transgenic mouse models of prostate cancer, in which these were validated as synergistic MR pairs31. The most statistically significant drug combination identified by the analysis produced a 9-fold decrease in tumour volume in vivo, in tumour xenografts that failed to respond to conventional therapy.
A key value of network-based approaches is that MR inference can tolerate very low RNA sequencing depths, down to 500,000 reads, with virtually no decrease in the accuracy of MR activity prediction (Pearson’s correlation coefficient ≥0.95)38. This suggests that with appropriate sample barcoding techniques for the creation of pooled RNA-seq libraries, the cost of individual profiles from compound perturbations could be dramatically reduced without loss of accuracy. This would enable cost-effective screening of large compound libraries, including, for example, FDA-approved and late-stage investigational compounds.
Conclusions
Despite considerable progress in integrative and systems biology approaches, computational assessment of gene–function relationships is still mostly carried out one gene at a time. The use of pathways is generally limited to visual diagrams that poorly represent their context-specific nature and their true connectivity. This is particularly ineffective in studying complex polygenic dependencies, including synthetic lethal interactions that cannot be gleaned on an individual gene basis and yet are crucially relevant for the systematic development of combination therapies.
Recent progress in the systematic and context-specific mapping of regulatory and signalling interactions supports novel approaches that explore the mechanistic architecture of disease state maintenance downstream of the genes associated with its aetiology. In this Opinion article, we have explored a recently proposed regulatory architecture in which MR proteins implement tightly autoregulated tumour checkpoint modules that are responsible for the stability of cancer states, independent of specific genetic mutations, using mechanisms reminiscent of physiological homeostasis. Such dystatic regulatory oncotecture may provide a conceptual framework to help unravel the complexity and profound heterogeneity of cancer genetics. For instance, it may provide a tractable set of constraints to interpret the evolutionary selection of additional mutational events that may confer selective advantage to the corresponding cancer cell subclones, by affecting upstream modulators of tumour checkpoint MRs that control proliferative programmes.
There are several crucial unaddressed issues implied by such a tumour-independent oncotecture. These include whether tumour heterogeneity supports the plastic coexistence of distinct cancer cell states in the same tumour, which may require pharmacological targeting of multiple distinct tumour checkpoint MRs, for example, using alternating treatment schedules. For instance, in glioma, mesenchymal and proneural subtype cells coexist plastically in the same tumour107, even though these states have been shown to be regulated by orthogonal tumour checkpoints10. In addition, it is unclear how many distinct tumour checkpoints may coexist even in the same tumour cell. For instance, tumour checkpoints associated with proliferation and epithelial-to-mesenchymal transition are probably distinct, given the serial nature of the cancer initiation and progression steps associated with their activation. It is thus possible that a relatively small number of molecularly distinct tumour checkpoints exist and that their activation in distinct tumour subtypes depends on distinct genetic alteration patterns. Combinatorial superposition of two or more of these mechanisms in each individual tumour may thus explain the large variety of reported tumour subtypes and of associated clinical phenotypes and drug sensitivities.
Ultimately, we propose that tumour checkpoint and MRs may be leveraged to simultaneously identify crucial tumour dependencies, as well as the specific drugs and drug combinations that are optimally suited to inducing their collapse, on the basis of an individual sample and even an individual cell. This would have obvious application to complementing oncogene addiction and immune checkpoint paradigms in precision medicine.
Acknowledgments
This work was supported by the National Cancer Institute (NCI) Cancer Target Discovery and Development Program (1U01CA168426), NCI Outstanding Investigator Award (R35CA197745) for A. C., NCI Research Centers for Cancer Systems Biology Consortium (1U54CA209997) and the NIH instrumentation grants (S10OD012351 and S10OD021764).
Glossary
- Bayesian networks
Probabilistic models representing the probabilities and conditional probabilities of variables representing nodes in a directed acyclic graph, that is, a type of network with nodes connected by directionally defined edges, usually represented as arrows, with no circular paths (cycles). This model is often used to determine the probability of an unknown event corresponding to one node as a function of the probability of other known events in the network.
- Dystatic
Describes the aberrant processes responsible for implementing and maintaining a stable disease state, independent of most genetic, epigenetic and environmental perturbations.
- Feed-forward loops
Regulatory structures in which a gene product (A) regulates a second gene product (B) and, together, A and B regulate one or more target gene products. These structures constitute a directed acyclic graph.
- Homeostasis
The set of regulatory processes that ensures the overall stability of a system state, independent of endogenous and exogenous variables.
- Interactomes
Sets of molecular interactions that constitute the regulatory logic of cells representative of a specific tissue and organism
- Isobologram
A two-dimensional map representing the viability of a cell following perturbation with a combination of two compounds. Each isobologram axis represents the concentration of an individual compound. This diagram is used to quantitatively assess whether the effect of the compound pair is additive, synergistic or antagonistic. This assessment is based on whether the isoboles (that is, curves in the diagram representing isopotency of the combination) are linear or nonlinear. Linear isoboles indicate additive behaviour, whereas nonlinear isoboles indicate synergistic (supra-additive) or antagonistic (sub-additive) behaviour.
- Master regulator
(MR). Type of protein participating in a modular regulatory structure (that is, tumour checkpoint), the aberrant activity of which is both necessary and sufficient for tumour cell state implementation and maintenance and which directly controls the transcriptional state of a tumour cell.
- Multiple hypothesis testing
When a test is repeated multiple times — for instance, a pair of dice are thrown multiple times — the probability of an outcome must be adjusted. This is a common problem in genetics, for example, where a large number of loci are tested to assess whether they are mutated in a cancer cohort, thus increasing the overall probability that any one of them may be mutated by chance.
- Oncogene addiction hypothesis
The hypothesis that tumours become dependent on the aberrant activity of proteins encoded by mutated oncogenes and that pharmacological inhibition of these proteins will cause tumour demise.
- Oncotecture
The regulatory architecture responsible for implementing tumour dystasis, comprising one or more tumour checkpoints that are responsible for integrating the effect of multiple mutations and aberrant signals in their upstream pathways to implement a conserved repertoire of downstream transcriptional programmes that are necessary and sufficient for tumour phenotype presentation.
- Regulatory logic
The full complement of transcriptional, post-transcriptional and post-translational molecular interactions that determine cell behaviour.
- Regulons
The full complement of transcriptional targets that are regulated by a protein. These can include either direct physical targets, for transcription factors and cofactors, or indirect targets for signal transduction.
- Reverse engineering
Systematic dissection of the molecular interactions that comprise the regulatory logic of the cell.
- Sample barcoding
A technique enabling incorporation of a predefined nucleic acid sequence (barcode) to tag either DNA or RNA molecules coming from a common sample so that they can be sequenced as a pool while retaining the ability to deconvolute which sample they came from.
- Silhouette score
A measure, from −1 to 1, of how similar an object is to its own cluster compared with the closest other cluster.
- Synthetic lethal
An interaction between two genes in which knockout of either gene in isolation has no (or minimal) negative impact on cell viability whereas knockout of both genes is lethal.
- Tissue microarrays
(TMAs). Paraffin blocks in which up to 1,000 separate tissue cores are embedded in a grid to support multiplexed immunohistological analyses.
- Tumour checkpoint
A small autoregulated module comprising one or more master regulator (MR) proteins, the concerted activity of which is both necessary and sufficient for the implementation and maintenance of a tumour cell state.
Biographies
Andrea Califano is the Clyde and Helen Wu Professor of Chemical and Systems Biology, Funding Chair of the Department of Systems Biology, Director of the JP Sulzberger Columbia Genome Center and Associate Director for Bioinformatics of the Herbert Irving Comprehensive Cancer Center, Columbia University, New York, USA. His research interests are in the use of cellular network models to elucidate novel biomarkers, therapeutic targets and their small molecule modulators in cancer and in the translational application of these discoveries.
Mariano J. Alvarez is the Chief Scientific Officer of DarwinHealth, Inc., New York, USA. He has participated in the development and application of key algorithms discussed in this Opinion article, including Master Regulator Inference Algorithm (MARINa), Virtual Inference of Protein Activity by Enriched Regulon Analysis (VIPER) and Driver-gene Inference by Genetical-Genomics and Information Theory (DIGGIT). His interests are in the use of systems biology approaches in precision medicine applications.
Footnotes
Competing interests statement
The authors declare competing interests: see Web version for details.
DATABASES
CCLE: http://software.broadinstitute.org/software/cprg/?q=node/11
FURTHER INFORMATION
The Cancer Genome Atlas: http://cancergenome.nih.gov
ALL LINKS ARE ACTIVE IN THE ONLINE PDF
Competing interests statement
A. C is founder of DarwinHealth, Inc. M. J. A. has been employed by DarwinHealth, Inc. since March 2016.
Subject categories
Biological sciences/Cancer/Cancer genomics [URI/631/67/69]
Biological sciences/Systems biology [URI/631/553]
Biological sciences/Cancer/Cancer therapy/Targeted therapies [URI/631/67/1059/602]
Contributor Information
Andrea Califano, Department of Systems Biology, Columbia University, and the Departments of Biomedical Informatics, Biochemistry and Molecular Biophysics, JP Sulzberger Columbia Genome Center, Herbert Irving Comprehensive Cancer Center, Columbia University, New York, New York 10032, USA.
Mariano J. Alvarez, DarwinHealth, Inc., 3960 Broadway, Suite 540, New York, New York 10032, USA
References
- 1.Hoadley KA, et al. Multiplatform analysis of 12 cancer types reveals molecular classification within and across tissues of origin. Cell. 2014;158:929–944. doi: 10.1016/j.cell.2014.06.049. [DOI] [PMC free article] [PubMed] [Google Scholar]
- 2.Shah SP, et al. The clonal and mutational evolution spectrum of primary triple-negative breast cancers. Nature. 2012;486:395–399. doi: 10.1038/nature10933. [DOI] [PMC free article] [PubMed] [Google Scholar]
- 3.Verhaak RG, et al. Integrated genomic analysis identifies clinically relevant subtypes of glioblastoma characterized by abnormalities in PDGFRA, IDH1, EGFR, and NF1. Cancer Cell. 2010;17:98–110. doi: 10.1016/j.ccr.2009.12.020. [DOI] [PMC free article] [PubMed] [Google Scholar]
- 4.Curtis C, et al. The genomic and transcriptomic architecture of 2,000 breast tumours reveals novel subgroups. Nature. 2012;486:346–352. doi: 10.1038/nature10983. [DOI] [PMC free article] [PubMed] [Google Scholar]
- 5.Cancer Genome Atlas Network. Comprehensive molecular portraits of human breast tumours. Nature. 2012;490:61–70. doi: 10.1038/nature11412. [DOI] [PMC free article] [PubMed] [Google Scholar]
- 6.Oakman C, Santarpia L, Di Leo A. Breast cancer assessment tools and optimizing adjuvant therapy. Nat Rev Clin Oncol. 2010;7:725–732. doi: 10.1038/nrclinonc.2010.170. [DOI] [PubMed] [Google Scholar]
- 7.Chen JC, et al. Identification of causal genetic drivers of human disease through systems-level analysis of regulatory networks. Cell. 2014;159:402–414. doi: 10.1016/j.cell.2014.09.021. [DOI] [PMC free article] [PubMed] [Google Scholar]
- 8.Compagno M, et al. Mutations of multiple genes cause deregulation of NF-κB in diffuse large B-cell lymphoma. Nature. 2009;459:717–721. doi: 10.1038/nature07968. [DOI] [PMC free article] [PubMed] [Google Scholar]
- 9.Aytes A, et al. Cross-species regulatory network analysis identifies a synergistic interaction between FOXM1 and CENPF that drives prostate cancer malignancy. Cancer Cell. 2014;25:638–651. doi: 10.1016/j.ccr.2014.03.017. [DOI] [PMC free article] [PubMed] [Google Scholar]
- 10.Carro MS, et al. The transcriptional network for mesenchymal transformation of brain tumours. Nature. 2010;463:318–325. doi: 10.1038/nature08712. [DOI] [PMC free article] [PubMed] [Google Scholar]
- 11.Bisikirska B, et al. Elucidation and pharmacological targeting of novel molecular drivers of follicular lymphoma progression. Cancer Res. 2016;76:664–674. doi: 10.1158/0008-5472.CAN-15-0828. [DOI] [PMC free article] [PubMed] [Google Scholar]
- 12.Yang J, et al. Twist, a master regulator of morphogenesis, plays an essential role in tumor metastasis. Cell. 2004;117:927–939. doi: 10.1016/j.cell.2004.06.006. [DOI] [PubMed] [Google Scholar]
- 13.Nambu JR, Lewis JO, Wharton KA, Jr, Crews ST. The Drosophila single-minded gene encodes a helix–loop–helix protein that acts as a master regulator of CNS midline development. Cell. 1991;67:1157–1167. doi: 10.1016/0092-8674(91)90292-7. [DOI] [PubMed] [Google Scholar]
- 14.Resnick MA, Tomso D, Inga A, Menendez D, Bell D. Functional diversity in the gene network controlled by the master regulator p53 in humans. Cell Cycle. 2005;4:1026–1029. doi: 10.4161/cc.4.8.1904. [DOI] [PubMed] [Google Scholar]
- 15.Klapper LN, Kirschbaum MH, Sela M, Yarden Y. Biochemical and clinical implications of the ErbB/HER signaling network of growth factor receptors. Adv Cancer Res. 2000;77:25–79. [PubMed] [Google Scholar]
- 16.Perou CM, et al. Molecular portraits of human breast tumours. Nature. 2000;406:747–752. doi: 10.1038/35021093. [DOI] [PubMed] [Google Scholar]
- 17.Dalla-Favera R, et al. Human c-myc oncogene is located on the region of chromosome 8 that is translocated in Burkitt lymphoma cells. Proc Natl Acad Sci USA. 1982;79:7824–7827. doi: 10.1073/pnas.79.24.7824. [DOI] [PMC free article] [PubMed] [Google Scholar]
- 18.Klein U, et al. Transcriptional analysis of the B cell germinal center reaction. Proc Natl Acad Sci USA. 2003;100:2639–2644. doi: 10.1073/pnas.0437996100. [DOI] [PMC free article] [PubMed] [Google Scholar]
- 19.Akavia UD, et al. An integrated approach to uncover drivers of cancer. Cell. 2010;143:1005–1017. doi: 10.1016/j.cell.2010.11.013. [DOI] [PMC free article] [PubMed] [Google Scholar]
- 20.Gu J, et al. Gene module based regulator inference identifying miR-139 as a tumor suppressor in colorectal cancer. Mol Biosyst. 2014;10:3249–3254. doi: 10.1039/c4mb00329b. [DOI] [PubMed] [Google Scholar]
- 21.Ergun A, Lawrence CA, Kohanski MA, Brennan TA, Collins JJ. A network biology approach to prostate cancer. Mol Syst Biol. 2007;3:82. doi: 10.1038/msb4100125. [DOI] [PMC free article] [PubMed] [Google Scholar]
- 22.Cannon WB. Organization for physiological homeostasis. Physiol Rev. 1929;9:399–431. [Google Scholar]
- 23.Waddington CH. Canalization of development and genetic assimilation of acquired characters. Nature. 1959;183:1654–1655. doi: 10.1038/1831654a0. [DOI] [PubMed] [Google Scholar]
- 24.Waddington CH. Genetic assimilation. Adv Genet. 1961;10:257–293. doi: 10.1016/s0065-2660(08)60119-4. [DOI] [PubMed] [Google Scholar]
- 25.Siegel PM, Massague J. Cytostatic and apoptotic actions of TGF-β in homeostasis and cancer. Nat Rev Cancer. 2003;3:807–821. doi: 10.1038/nrc1208. [DOI] [PubMed] [Google Scholar]
- 26.Carter SB. Tissue homeostasis and the biological basis of cancer. Nature. 1968;220:970–974. doi: 10.1038/220970a0. [DOI] [PubMed] [Google Scholar]
- 27.Young SR, et al. Establishment and serial passage of cell cultures derived from LuCaP xenografts. Prostate. 2013;73:1251–1262. doi: 10.1002/pros.22610. [DOI] [PMC free article] [PubMed] [Google Scholar]
- 28.Barretina J, et al. The Cancer Cell Line Encyclopedia enables predictive modelling of anticancer drug sensitivity. Nature. 2012;483:603–607. doi: 10.1038/nature11003. [DOI] [PMC free article] [PubMed] [Google Scholar]
- 29.Rodriguez-Barrueco R, et al. Inhibition of the autocrine IL-6–JAK2–STAT3–calprotectin axis as targeted therapy for HR−/HER2+ breast cancers. Genes Dev. 2015;29:1631–1648. doi: 10.1101/gad.262642.115. [DOI] [PMC free article] [PubMed] [Google Scholar]
- 30.Piovan E, et al. Direct reversal of glucocorticoid resistance by AKT inhibition in acute lymphoblastic leukemia. Cancer Cell. 2013;24:766–776. doi: 10.1016/j.ccr.2013.10.022. [DOI] [PMC free article] [PubMed] [Google Scholar]
- 31.Mitrofanova A, Aytes A, Shen C, Abate-Shen C, Califano A. A systems biology approach to predict drug response for human prostate cancer based on in vivo preclinical analyses of mouse models. Cell Rep. 2015;12:1–12. doi: 10.1016/j.celrep.2015.08.051. [DOI] [PMC free article] [PubMed] [Google Scholar]
- 32.Davis RE, Brown KD, Siebenlist U, Staudt LM. Constitutive nuclear factor kappaB activity is required for survival of activated B cell-like diffuse large B cell lymphoma cells. J Exp Med. 2001;194:1861–1874. doi: 10.1084/jem.194.12.1861. [DOI] [PMC free article] [PubMed] [Google Scholar]
- 33.Ngo VN, et al. Oncogenically active MYD88 mutations in human lymphoma. Nature. 2011;470:115–119. doi: 10.1038/nature09671. [DOI] [PMC free article] [PubMed] [Google Scholar]
- 34.Davis RE, et al. Chronic active B-cell-receptor signalling in diffuse large B-cell lymphoma. Nature. 2010;463:88–92. doi: 10.1038/nature08638. [DOI] [PMC free article] [PubMed] [Google Scholar]
- 35.Luo J, Solimini NL, Elledge SJ. Principles of cancer therapy: oncogene and non-oncogene addiction. Cell. 2009;136:823–837. doi: 10.1016/j.cell.2009.02.024. [DOI] [PMC free article] [PubMed] [Google Scholar]
- 36.Wayne DW. Kolmogorov–Smirnov One-sample Test: Applied Nonparametric Statistics. 2. pp. 319–330. (PWS-Kent, 1990) [Google Scholar]
- 37.Subramanian A, et al. Gene set enrichment analysis: a knowledge-based approach for interpreting genome-wide expression profiles. Proc Natl Acad Sci USA. 2005;102:15545–15550. doi: 10.1073/pnas.0506580102. [DOI] [PMC free article] [PubMed] [Google Scholar]
- 38.Alvarez MJ, et al. Functional characterization of somatic mutations in cancer using network-based inference of protein activity. Nat Genet. 2016;48:838–847. doi: 10.1038/ng.3593. [DOI] [PMC free article] [PubMed] [Google Scholar]
- 39.Lefebvre C, et al. A human B-cell interactome identifies MYB and FOXM1 as master regulators of proliferation in germinal centers. Mol Syst Biol. 2010;6:377. doi: 10.1038/msb.2010.31. [DOI] [PMC free article] [PubMed] [Google Scholar]
- 40.Castro MA, et al. Regulators of genetic risk of breast cancer identified by integrative network analysis. Nat Genet. 2016;48:12–21. doi: 10.1038/ng.3458. [DOI] [PMC free article] [PubMed] [Google Scholar]
- 41.Zhang S, et al. Stroma-associated master regulators of molecular subtypes predict patient prognosis in ovarian cancer. Sci Rep. 2015;5:16066. doi: 10.1038/srep16066. [DOI] [PMC free article] [PubMed] [Google Scholar]
- 42.Yepes S, Torres MM, Lopez-Kleine L. Regulatory network reconstruction reveals genes with prognostic value for chronic lymphocytic leukemia. BMC Genomics. 2015;16:1002. doi: 10.1186/s12864-015-2189-6. [DOI] [PMC free article] [PubMed] [Google Scholar]
- 43.Remo A, et al. Systems biology analysis reveals NFAT5 as a novel biomarker and master regulator of inflammatory breast cancer. J Transl Med. 2015;13:138. doi: 10.1186/s12967-015-0492-2. [DOI] [PMC free article] [PubMed] [Google Scholar]
- 44.Fletcher MN, et al. Master regulators of FGFR2 signalling and breast cancer risk. Nat Commun. 2013;4:2464. doi: 10.1038/ncomms3464. [DOI] [PMC free article] [PubMed] [Google Scholar]
- 45.Tanaka H, Ogishima S. Network biology approach to epithelial-mesenchymal transition in cancer metastasis: three stage theory. J Mol Cell Biol. 2015;7:253–266. doi: 10.1093/jmcb/mjv035. [DOI] [PubMed] [Google Scholar]
- 46.Piao G, et al. A computational procedure for identifying master regulator candidates: a case study on diabetes progression in Goto–Kakizaki rats. BMC Syst Biol. 2012;6(Suppl 1):S2. doi: 10.1186/1752-0509-6-S1-S2. [DOI] [PMC free article] [PubMed] [Google Scholar]
- 47.Liang Y, et al. Transcriptional network analysis identifies BACH1 as a master regulator of breast cancer bone metastasis. J Biol Chem. 2012;287:33533–33544. doi: 10.1074/jbc.M112.392332. [DOI] [PMC free article] [PubMed] [Google Scholar]
- 48.Califano A, Butte AJ, Friend S, Ideker T, Schadt E. Leveraging models of cell regulation and GWAS data in integrative network-based association studies. Nat Genet. 2012;44:841–847. doi: 10.1038/ng.2355. [DOI] [PMC free article] [PubMed] [Google Scholar]
- 49.Pe’er D, Hacohen N. Principles and strategies for developing network models in cancer. Cell. 2011;144:864–873. doi: 10.1016/j.cell.2011.03.001. [DOI] [PMC free article] [PubMed] [Google Scholar]
- 50.Tovar H, Garcia-Herrera R, Espinal-Enriquez J, Hernandez-Lemus E. Transcriptional master regulator analysis in breast cancer genetic networks. Comput Biol Chem. 2015;59B:67–77. doi: 10.1016/j.compbiolchem.2015.08.007. [DOI] [PubMed] [Google Scholar]
- 51.Sartor IT, Zeidan-Chulia F, Albanus RD, Dalmolin RJ, Moreira JC. Computational analyses reveal a prognostic impact of TULP3 as a transcriptional master regulator in pancreatic ductal adenocarcinoma. Mol Biosyst. 2014;10:1461–1468. doi: 10.1039/c3mb70590k. [DOI] [PubMed] [Google Scholar]
- 52.Lim WK, Lyashenko E, Califano A. Master regulators used as breast cancer metastasis classifiers. Pac Symp Biocomput. 2009;14:504–515. [PMC free article] [PubMed] [Google Scholar]
- 53.Ikiz B, et al. Dissecting the regulatory machinery of neurodegeneration in an in vitro model of amyotrophic lateral sclerosis. Cell Rep. 2015;12:335–345. doi: 10.1016/j.celrep.2015.06.019. [DOI] [PMC free article] [PubMed] [Google Scholar]
- 54.Aubry S, et al. Assembly and interrogation of Alzheimer’s disease genetic networks reveal novel regulators of progression. PLoS ONE. 2015;10:e0120352. doi: 10.1371/journal.pone.0120352. [DOI] [PMC free article] [PubMed] [Google Scholar]
- 55.Brichta L, et al. Identification of neurodegenerative factors using translatome-regulatory network analysis. Nat Neurosci. 2015;18:1325–1333. doi: 10.1038/nn.4070. [DOI] [PMC free article] [PubMed] [Google Scholar]
- 56.Repunte-Canonigo V, et al. Identifying candidate drivers of alcohol dependence-induced excessive drinking by assembly and interrogation of brain-specific regulatory networks. Genome Biol. 2015;16:68. doi: 10.1186/s13059-015-0593-5. [DOI] [PMC free article] [PubMed] [Google Scholar]
- 57.Kushwaha R, et al. Interrogation of a context-specific transcription factor network identifies novel regulators of pluripotency. Stem Cells. 2015;33:367–377. doi: 10.1002/stem.1870. [DOI] [PMC free article] [PubMed] [Google Scholar]
- 58.Ravasi T, et al. An atlas of combinatorial transcriptional regulation in mouse and man. Cell. 2010;140:744–752. doi: 10.1016/j.cell.2010.01.044. [DOI] [PMC free article] [PubMed] [Google Scholar]
- 59.Basso K, et al. Reverse engineering of regulatory networks in human B cells. Nat Genet. 2005;37:382–390. doi: 10.1038/ng1532. [DOI] [PubMed] [Google Scholar]
- 60.ENCODE Project Consortium. Identification and analysis of functional elements in 1% of the human genome by the ENCODE pilot project. Nature. 2007;447:799–816. doi: 10.1038/nature05874. [DOI] [PMC free article] [PubMed] [Google Scholar]
- 61.Sumazin P, et al. An extensive microRNA-mediated network of RNA–RNA interactions regulates established oncogenic pathways in glioblastoma. Cell. 2011;147:370–381. doi: 10.1016/j.cell.2011.09.041. [DOI] [PMC free article] [PubMed] [Google Scholar]
- 62.Lewis BP, Shih IH, Jones-Rhoades MW, Bartel DP, Burge CB. Prediction of mammalian microRNA targets. Cell. 2003;115:787–798. doi: 10.1016/s0092-8674(03)01018-3. [DOI] [PubMed] [Google Scholar]
- 63.Friedlander MR, et al. Discovering microRNAs from deep sequencing data using miRDeep. Nat Biotechnol. 2008;26:407–415. doi: 10.1038/nbt1394. [DOI] [PubMed] [Google Scholar]
- 64.Rual JF, et al. Towards a proteome-scale map of the human protein-protein interaction network. Nature. 2005;437:1173–1178. doi: 10.1038/nature04209. [DOI] [PubMed] [Google Scholar]
- 65.Bandyopadhyay S, et al. A human MAP kinase interactome. Nat Methods. 2010;7:801–805. doi: 10.1038/nmeth.1506. [DOI] [PMC free article] [PubMed] [Google Scholar]
- 66.Wang K, et al. Genome-wide identification of post-translational modulators of transcription factor activity in human B cells. Nat Biotechnol. 2009;27:829–839. doi: 10.1038/nbt.1563. [DOI] [PMC free article] [PubMed] [Google Scholar]
- 67.Zhang QC, et al. Structure-based prediction of protein-protein interactions on a genome-wide scale. Nature. 2012;490:556–560. doi: 10.1038/nature11503. [DOI] [PMC free article] [PubMed] [Google Scholar]
- 68.AlQuraishi M, Koytiger G, Jenney A, MacBeath G, Sorger PK. A multiscale statistical mechanical framework integrates biophysical and genomic data to assemble cancer networks. Nat Genet. 2014;46:1363–1367. doi: 10.1038/ng.3138. [DOI] [PMC free article] [PubMed] [Google Scholar]
- 69.Faith JJ, et al. Large-scale mapping and validation of Escherichia coli transcriptional regulation from a compendium of expression profiles. PLoS Biol. 2007;5:e8. doi: 10.1371/journal.pbio.0050008. [DOI] [PMC free article] [PubMed] [Google Scholar]
- 70.Friedman N. Inferring cellular networks using probabilistic graphical models. Science. 2004;303:799–805. doi: 10.1126/science.1094068. [DOI] [PubMed] [Google Scholar]
- 71.Kundaje A, et al. Learning regulatory programs that accurately predict differential expression with MEDUSA. Ann NY Acad Sci. 2007;1115:178–202. doi: 10.1196/annals.1407.020. [DOI] [PubMed] [Google Scholar]
- 72.Kramer A, Green J, Pollard J, Jr, Tugendreich S. Causal analysis approaches in Ingenuity Pathway Analysis. Bioinformatics. 2014;30:523–530. doi: 10.1093/bioinformatics/btt703. [DOI] [PMC free article] [PubMed] [Google Scholar]
- 73.Maher B. ENCODE: the human encyclopaedia. Nature. 2012;489:46–48. doi: 10.1038/489046a. [DOI] [PubMed] [Google Scholar]
- 74.Palomero T, et al. NOTCH1 directly regulates c-MYC and activates a feed-forward-loop transcriptional network promoting leukemic cell growth. Proc Natl Acad Sci USA. 2006;103:18261–18266. doi: 10.1073/pnas.0606108103. [DOI] [PMC free article] [PubMed] [Google Scholar]
- 75.Affara M, et al. Vasohibin-1 is identified as a master-regulator of endothelial cell apoptosis using gene network analysis. BMC Genomics. 2013;14:23. doi: 10.1186/1471-2164-14-23. [DOI] [PMC free article] [PubMed] [Google Scholar]
- 76.Werner HM, Mills GB, Ram PT. Cancer systems biology: a peek into the future of patient care? Nat Rev Clin Oncol. 2014;11:167–176. doi: 10.1038/nrclinonc.2014.6. [DOI] [PMC free article] [PubMed] [Google Scholar]
- 77.Saito M, et al. BCL6 suppression of BCL2 via Miz1 and its disruption in diffuse large B cell lymphoma. Proc Natl Acad Sci USA. 2009;106:11294–11299. doi: 10.1073/pnas.0903854106. [DOI] [PMC free article] [PubMed] [Google Scholar]
- 78.Luscombe NM, et al. Genomic analysis of regulatory network dynamics reveals large topological changes. Nature. 2004;431:308–312. doi: 10.1038/nature02782. [DOI] [PubMed] [Google Scholar]
- 79.Phillips HS, et al. Molecular subclasses of high-grade glioma predict prognosis, delineate a pattern of disease progression, and resemble stages in neurogenesis. Cancer Cell. 2006;9:157–173. doi: 10.1016/j.ccr.2006.02.019. [DOI] [PubMed] [Google Scholar]
- 80.Brennan CW, et al. The somatic genomic landscape of glioblastoma. Cell. 2013;155:462–477. doi: 10.1016/j.cell.2013.09.034. [DOI] [PMC free article] [PubMed] [Google Scholar]
- 81.Wapinski OL, et al. Hierarchical mechanisms for direct reprogramming of fibroblasts to neurons. Cell. 2013;155:621–635. doi: 10.1016/j.cell.2013.09.028. [DOI] [PMC free article] [PubMed] [Google Scholar]
- 82.Hanahan D, Weinberg RA. Hallmarks of cancer: the next generation. Cell. 2011;144:646–674. doi: 10.1016/j.cell.2011.02.013. [DOI] [PubMed] [Google Scholar]
- 83.Chudnovsky Y, et al. ZFHX4 interacts with the NuRD core member CHD4 and regulates the glioblastoma tumor-initiating cell state. Cell Rep. 2014;6:313–324. doi: 10.1016/j.celrep.2013.12.032. [DOI] [PMC free article] [PubMed] [Google Scholar]
- 84.Taylor BS, et al. Integrative genomic profiling of human prostate cancer. Cancer Cell. 2010;18:11–22. doi: 10.1016/j.ccr.2010.05.026. [DOI] [PMC free article] [PubMed] [Google Scholar]
- 85.US National Library of Medicine. Clinicaltrials.gov. 2014 https://clinicaltrials.gov/ct2/show/NCT02066532.
- 86.Tzoneva G, et al. Activating mutations in the NT5C2 nucleotidase gene drive chemotherapy resistance in relapsed ALL. Nat Med. 2013;19:368–371. doi: 10.1038/nm.3078. [DOI] [PMC free article] [PubMed] [Google Scholar]
- 87.Woyach JA, et al. Resistance mechanisms for the Bruton’s tyrosine kinase inhibitor ibrutinib. N Engl J Med. 2014;370:2286–2294. doi: 10.1056/NEJMoa1400029. [DOI] [PMC free article] [PubMed] [Google Scholar]
- 88.Flusberg DA, Sorger PK. Modulating cell-to-cell variability and sensitivity to death ligands by co-drugging. Phys Biol. 2013;10:035002. doi: 10.1088/1478-3975/10/3/035002. [DOI] [PMC free article] [PubMed] [Google Scholar]
- 89.Fenner A. Prostate cancer: next-generation RNA sequencing identifies gene signature of neuroendocrine differentiation in prostate tumors. Nat Rev Urol. 2012;9:8. doi: 10.1038/nrurol.2011.213. [DOI] [PubMed] [Google Scholar]
- 90.Van Vlierberghe P, Ferrando A. The molecular basis of T cell acute lymphoblastic leukemia. J Clin Invest. 2012;122:3398–3406. doi: 10.1172/JCI61269. [DOI] [PMC free article] [PubMed] [Google Scholar]
- 91.Wei G, et al. Gene expression-based chemical genomics identifies rapamycin as a modulator of MCL1 and glucocorticoid resistance. Cancer Cell. 2006;10:331–342. doi: 10.1016/j.ccr.2006.09.006. [DOI] [PubMed] [Google Scholar]
- 92.Rubin EH, Gilliland DG. Drug development and clinical trials—the path to an approved cancer drug. Nat Rev Clin Oncol. 2012;9:215–222. doi: 10.1038/nrclinonc.2012.22. [DOI] [PubMed] [Google Scholar]
- 93.Shelanski M, et al. A systems approach to drug discovery in Alzheimer’s disease. Neurotherapeutics. 2015;12:126–131. doi: 10.1007/s13311-014-0335-5. [DOI] [PMC free article] [PubMed] [Google Scholar]
- 94.Schadt EE, et al. An integrative genomics approach to infer causal associations between gene expression and disease. Nat Genet. 2005;37:710–717. doi: 10.1038/ng1589. [DOI] [PMC free article] [PubMed] [Google Scholar]
- 95.Hofree M, Shen JP, Carter H, Gross A, Ideker T. Network-based stratification of tumor mutations. Nat Methods. 2013;10:1108–1115. doi: 10.1038/nmeth.2651. [DOI] [PMC free article] [PubMed] [Google Scholar]
- 96.Alvarez MJ, Chen JC, Califano A. DIGGIT: a Bioconductor package to infer genetic variants driving cellular phenotypes. Bioinformatics. 2015;31:4032–4034. doi: 10.1093/bioinformatics/btv499. [DOI] [PMC free article] [PubMed] [Google Scholar]
- 97.Weinstein IB. Cancer. Addiction to oncogenes—the Achilles heal of cancer. Science. 2002;297:63–64. doi: 10.1126/science.1073096. [DOI] [PubMed] [Google Scholar]
- 98.Druker BJ, et al. Effects of a selective inhibitor of the Abl tyrosine kinase on the growth of Bcr-Abl positive cells. Nat Med. 1996;2:561–566. doi: 10.1038/nm0596-561. [DOI] [PubMed] [Google Scholar]
- 99.Wang X, Haswell JR, Roberts CW. Molecular pathways: SWI/SNF (BAF) complexes are frequently mutated in cancer—mechanisms and potential therapeutic insights. Clin Cancer Res. 2014;20:21–27. doi: 10.1158/1078-0432.CCR-13-0280. [DOI] [PMC free article] [PubMed] [Google Scholar]
- 100.Vazquez M, Valencia A, Pons T. Structure-PPi: a module for the annotation of cancer-related single-nucleotide variants at protein-protein interfaces. Bioinformatics. 2015;31:2397–2399. doi: 10.1093/bioinformatics/btv142. [DOI] [PMC free article] [PubMed] [Google Scholar]
- 101.Morris JPt, Wang SC, Hebrok M. KRAS, Hedgehog, Wnt and the twisted developmental biology of pancreatic ductal adenocarcinoma. Nat Rev Cancer. 2010;10:683–695. doi: 10.1038/nrc2899. [DOI] [PMC free article] [PubMed] [Google Scholar]
- 102.Dhomen N, Marais R. BRAF signaling and targeted therapies in melanoma. Hematol Oncol Clin North Am. 2009;23:529–545. doi: 10.1016/j.hoc.2009.04.001. [DOI] [PubMed] [Google Scholar]
- 103.Davoli A, Hocevar BA, Brown TL. Progression and treatment of HER2-positive breast cancer. Cancer Chemother Pharmacol. 2010;65:611–623. doi: 10.1007/s00280-009-1208-1. [DOI] [PubMed] [Google Scholar]
- 104.Bansal M, et al. A community computational challenge to predict the activity of pairs of compounds. Nat Biotechnol. 2014;32:1213–1222. doi: 10.1038/nbt.3052. [DOI] [PMC free article] [PubMed] [Google Scholar]
- 105.Woo JH, et al. Elucidating compound mechanism of action by network dysregulation analysis in pertubed cells. Cell. 2015;162:441–451. doi: 10.1016/j.cell.2015.05.056. [DOI] [PMC free article] [PubMed] [Google Scholar]
- 106.Tallarida RJ. An overview of drug combination analysis with isobolograms. J Pharmacol Exp Ther. 2006;319:1–7. doi: 10.1124/jpet.106.104117. [DOI] [PubMed] [Google Scholar]
- 107.Patel AP, et al. Single-cell RNA-seq highlights intratumoral heterogeneity in primary glioblastoma. Science. 2014;344:1396–1401. doi: 10.1126/science.1254257. [DOI] [PMC free article] [PubMed] [Google Scholar]
- 108.Park HS, Jun CH. A simple and fast algorithm for K-medoids clustering. Expert Systems With Appl. 2009;36:3336–3341. [Google Scholar]
- 109.Lefebvre C, Rieckhof G, Califano A. Reverse-engineering human regulatory networks. Wiley Interdiscip Rev Syst Biol Med. 2012;4:311–325. doi: 10.1002/wsbm.1159. [DOI] [PMC free article] [PubMed] [Google Scholar]
- 110.Linding R, et al. Systematic discovery of in vivo phosphorylation networks. Cell. 2007;129:1415–1426. doi: 10.1016/j.cell.2007.05.052. [DOI] [PMC free article] [PubMed] [Google Scholar]
- 111.Srivas R, et al. Assembling global maps of cellular function through integrative analysis of physical and genetic networks. Nat Protoc. 2011;6:1308–1323. doi: 10.1038/nprot.2011.368. [DOI] [PMC free article] [PubMed] [Google Scholar]
- 112.Rhodes DR, et al. Mining for regulatory programs in the cancer transcriptome. Nat Genet. 2005;37:579–583. doi: 10.1038/ng1578. [DOI] [PubMed] [Google Scholar]
- 113.Lachmann A, et al. ChEA: transcription factor regulation inferred from integrating genome-wide ChIP-X experiments. Bioinformatics. 2010;26:2438–2444. doi: 10.1093/bioinformatics/btq466. [DOI] [PMC free article] [PubMed] [Google Scholar]
- 114.Needham CJ, Bradford JR, Bulpitt AJ, Westhead DR. Inference in Bayesian networks. Nat Biotechnol. 2006;24:51–53. doi: 10.1038/nbt0106-51. [DOI] [PubMed] [Google Scholar]
- 115.Yeung MK, Tegner J, Collins JJ. Reverse engineering gene networks using singular value decomposition and robust regression. Proc Natl Acad Sci USA. 2002;99:6163–6168. doi: 10.1073/pnas.092576199. [DOI] [PMC free article] [PubMed] [Google Scholar]
- 116.Martinez MR, et al. Quantitative modeling of the terminal differentiation of B cells and mechanisms of lymphomagenesis. Proc Natl Acad Sci USA. 2012;109:2672–2677. doi: 10.1073/pnas.1113019109. [DOI] [PMC free article] [PubMed] [Google Scholar]
- 117.Polynikis A, Hogan SJ, di Bernardo M. Comparing different ODE modelling approaches for gene regulatory networks. J Theor Biol. 2009;261:511–530. doi: 10.1016/j.jtbi.2009.07.040. [DOI] [PubMed] [Google Scholar]
- 118.Stuart JM, Segal E, Koller D, Kim SK. A gene-coexpression network for global discovery of conserved genetic modules. Science. 2003;302:249–255. doi: 10.1126/science.1087447. [DOI] [PubMed] [Google Scholar]
- 119.Horvath S, Dong J. Geometric interpretation of gene coexpression network analysis. PLoS Comput Biol. 2008;4:e1000117. doi: 10.1371/journal.pcbi.1000117. [DOI] [PMC free article] [PubMed] [Google Scholar]
- 120.Jansen R, et al. A Bayesian networks approach for predicting protein-protein interactions from genomic data. Science. 2003;302:449–453. doi: 10.1126/science.1087361. [DOI] [PubMed] [Google Scholar]
- 121.He F, Balling R, Zeng AP. Reverse engineering and verification of gene networks: principles, assumptions, and limitations of present methods and future perspectives. J Biotechnol. 2009;144:190–203. doi: 10.1016/j.jbiotec.2009.07.013. [DOI] [PubMed] [Google Scholar]
- 122.Stolovitzky G, Prill RJ, Califano A. Lessons from the DREAM2 Challenges. Ann NY Acad Sci. 2009;1158:159–195. doi: 10.1111/j.1749-6632.2009.04497.x. [DOI] [PubMed] [Google Scholar]
- 123.Marbach D, et al. Revealing strengths and weaknesses of methods for gene network inference. Proc Natl Acad Sci USA. 2010;107:6286–6291. doi: 10.1073/pnas.0913357107. [DOI] [PMC free article] [PubMed] [Google Scholar]
- 124.Bussemaker HJ, Li H, Siggia ED. Regulatory element detection using correlation with expression. Nat Genet. 2001;27:167–171. doi: 10.1038/84792. [DOI] [PubMed] [Google Scholar]
- 125.Fiedler D, et al. Functional organization of the S cerevisiae phosphorylation network. Cell. 2009;136:952–963. doi: 10.1016/j.cell.2008.12.039. [DOI] [PMC free article] [PubMed] [Google Scholar]
- 126.Mani KM, et al. A systems biology approach to prediction of oncogenes and molecular perturbation targets in B-cell lymphomas. Mol Syst Biol. 2008;4:169. doi: 10.1038/msb.2008.2. [DOI] [PMC free article] [PubMed] [Google Scholar]
- 127.Ideker T, Krogan NJ. Differential network biology. Mol Syst Biol. 2012;8:565. doi: 10.1038/msb.2011.99. [DOI] [PMC free article] [PubMed] [Google Scholar]
- 128.Barrios-Rodiles M, et al. High-throughput mapping of a dynamic signaling network in mammalian cells. Science. 2005;307:1621–1625. doi: 10.1126/science.1105776. [DOI] [PubMed] [Google Scholar]
- 129.Saez-Rodriguez J, et al. Comparing signaling networks between normal and transformed hepatocytes using discrete logical models. Cancer Res. 2011;71:5400–5411. doi: 10.1158/0008-5472.CAN-10-4453. [DOI] [PMC free article] [PubMed] [Google Scholar]
- 130.Menashe I, et al. Pathway analysis of breast cancer genome-wide association study highlights three pathways and one canonical signaling cascade. Cancer Res. 2010;70:4453–4459. doi: 10.1158/0008-5472.CAN-09-4502. [DOI] [PMC free article] [PubMed] [Google Scholar]
- 131.Laoukili J, et al. FoxM1 is required for execution of the mitotic programme and chromosome stability. Nature Cell Biol. 2005;7:126–136. doi: 10.1038/ncb1217. [DOI] [PubMed] [Google Scholar]
- 132.Basu A, et al. An interactive resource to identify cancer genetic and lineage dependencies targeted by small molecules. Cell. 2013;154:1151–1161. doi: 10.1016/j.cell.2013.08.003. [DOI] [PMC free article] [PubMed] [Google Scholar]
- 133.Flusberg DA, Roux J, Spencer SL, Sorger PK. Cells surviving fractional killing by TRAIL exhibit transient but sustainable resistance and inflammatory phenotypes. Mol Biol Cell. 2013;24:2186–2200. doi: 10.1091/mbc.E12-10-0737. [DOI] [PMC free article] [PubMed] [Google Scholar]
- 134.Roschewski M, Staudt LM, Wilson WH. Diffuse large B-cell lymphoma-treatment approaches in the molecular era. Nat Rev Clin Oncol. 2014;11:12–23. doi: 10.1038/nrclinonc.2013.197. [DOI] [PMC free article] [PubMed] [Google Scholar]