

Abstract
To evaluate a commercial synthetic CT (syn-CT) software for use in prostate radiotherapy.
Twenty-five prostate patients underwent CT and MR simulation scans in treatment position on a 3T MR scanner. A commercially available MR protocol was used that included a T2w turbo spin-echo sequence for soft-tissue contrast and a dual echo 3D mDIXON fast field echo (FFE) sequence for generating syn-CT. A dual-echo 3D FFE B0 map was used for patient-induced susceptibility distortion analysis and a new 3D balanced-FFE sequence was evaluated for identification of implanted gold fiducial markers and subsequent image-guidance during radiotherapy delivery. Tissues were classified as air, adipose, water, trabecular/spongy bone and compact/cortical bone and assigned bulk HU values. The accuracy of syn-CT for treatment planning was analyzed by transferring the structures and plan from planning CT to syn-CT and recalculating the dose. Accuracy of localization at the treatment machine was evaluated by comparing registration of kV radiographs to either digitally reconstructed radiographs (DRRs) generated from syn-CT or traditional DRRs generated from the planning CT. Similarly, accuracy of setup using CBCT and syn-CT was compared to that using the planning CT. Finally, a MR-only simulation workflow was established and end-to-end testing was completed on five patients undergoing MR-only simulation.
Dosimetric comparison between the original CT and syn-CT plans was within 0.5% on average for all structures. The de-novo optimized plans on the syn-CT met institutional clinical objectives for target and normal structures. Patient-induced susceptibility distortion based on B0 maps was within 1 mm and 0.5 mm in the body and prostate respectively. DRR and CBCT localization based on MR-localized fiducials showed a standard deviation of <1 mm. End-to-end testing and MR simulation workflow was successfully validated.
MRI derived synthetic CT can be successfully used for a MR-only planning and treatment for prostate radiotherapy.
Keywords: synthetic CT, MRCAT, clinical workflow, prostate cancer
1. Introduction
Magnetic resonance imaging (MRI) is increasingly used in prostate radiotherapy planning for target and normal structure delineation because of superior soft tissue contrast. The inter-observer variability in defining the prostate apex is much smaller with MR as compared to computed tomography (CT) (Wachter et al 2002, Roach, 2005, Nyholm et al 2013). Furthermore, MRI-based delineation for prostate radiotherapy has been associated with lower urinary frequency and urinary retention toxicity scores (Sander et al 2014). Recently, MR simulation platforms have been introduced and are further enabling the use of MRI as the primary or secondary imaging modality for radiotherapy planning. Preferably, MRI should be used as the primary imaging modality so as to minimize dosimetric errors introduced by mis-registration with the planning CT or changes in anatomy between the two scans (Lambert et al 2011). To perform MR-only simulation for prostate cancer, there are two requirements: synthetic CT images (syn-CT) generated from MR with high geometric and dosimetric accuracy and 2D digitally reconstructed radiographs (DRRs) or 3D reference images with sufficient bone, soft tissue, and/or implanted fiducial visualization to guide image-based patient setup. Multiple groups have published methods to generate syn-CTs and accurate bony DRRs applicable to prostate radiotherapy (Greer et al 2011, Lambert et al 2011, Dowling et al 2012, Korhonen et al 2014, Kim et al 2015a, 2015b, Siversson et al 2015, Chen et al 2016, Liu et al 2016). These methods can be grouped into bulk density assignment based, atlas-based or tissue classification-based methods. Bulk density assignment based methods rely on manual contouring of bones and other relevant tissues and have shown reasonable accuracy (Greer et al 2011, Lambert et al 2011, Kim et al 2015a). However, manual contouring of the structures is not practical for routine clinical use. Atlas-based methods rely on generation of electron density maps from an atlas of reference CT and MR images using deformable registration (Dowling et al 2012, Chen et al 2016). However, large anatomy variation may compromise the accuracy of atlas-based methods due to the limits of deformable registration. Within the tissue classification methods, some methods rely upon the use of single or multiple MR series to classify the tissue type (Korhonen et al 2014). Others have investigated methods that use an atlas (such as bone atlas) to guide tissue classification (Siversson et al 2015, Liu et al 2016). Such approaches are more practical for clinical use and are not limited by variations in patient anatomy.
Although methods for performing MR-only treatment planning (as described above) have been developed, actual clinical implementation is still in its infancy. The goal of this study was to assess the dosimetric and geometric accuracy of a recently released, FDA-approved, commercial synthetic CT software package called MRCAT (MR for Calculating ATtenuation)5. MR-only clinical workflows for prostate cancer were also developed and implemented using this package.
2. Methods and materials
Twenty-five prostate patients (intact gland or post-operative prostate bed) undergoing external beam alone (800 cGy × 5 fractions or 180 cGy × 40 fractions) or as a boost after permanent brachytherapy implant (500 cGy × 5 fractions) were evaluated in this IRB-approved study. Each patient underwent CT simulation in the supine position with a full bladder in a thermoplastic immobilization mold extending from the abdomen to mid-thigh (figure 1(a)). CT simulation was followed by MR simulation on a 3T scanner5 in the treatment position incorporating the patient’s immobilization via the use of an indexed, flat table top (figure 1). A foley catheter and a rectal catheter as well as a knee roll were used for both CT and MR simulation. Because the immobilization mold is rigid, the MR anterior phased array RF coil could be placed directly on top of the patient (figure 1(b)) without deforming the patient’s anatomy. MR scans were acquired by combining a sixteen element anterior and forty four element posterior coils. For patients with an intact prostate, three gold fiducial markers of 3 mm length and 1.2 mm diameter were implanted into the prostate under ultrasound guidance prior to simulation for image guidance during treatment.
Figure 1.

MR simulation of a prostate patient. (a) Patient on the flat table top with immobilization mold in place, (b) coil positioning during MR simulation.
2.1. Scan protocol
CT scans were acquired on a 16 slice CT scanner6 with 2 mm slice thickness extending from L1 to well below the ischial tuberosities. The MR simulation protocol consisted of a small FOV 2D axial turbo spin echo T2-weighted (T2w) sequence (TR/TE = 5200/100 ms, bandwidth = 257, slice thickness = 3 mm, FOV = 230 × 222 × 199 cm3, voxel size = 0.65 × 0.83 × 3 mm3, NSA = 3), 2D coronal (slice thickness = 3 mm) and 2D sagittal (slice thickness = 3 mm) for soft tissue delineation, a 3D dual-echo fast field echo (FFE) mDIXON MRCAT (TR/TE1/TE2 = 3.8/1.21/2.4, BW = 1072 Hz, slice thickness = 2.5 mm, FOV = 368 × 552 × 300 cm3, voxel size = 1.7 × 1.7 × 2.5 mm3) sequence for synthetic CT (syn-CT) generation, and a dual-echo 3D FFE B0 map (TR/TE1/TE2 = 30/2.3/4.7, BW = 1600, slice thickness = 4 mm, FOV = 368 × 552 × 300 cm3, voxel size = 3 × 3 × 4 mm3) matching the mDIXON sequence to evaluate patient induced susceptibility distortion. A new 3D balanced FFE-based sequence for fiducial identification was implemented for on-line image guidance for prostate radiotherapy. The sequence parameters for the fiducial sequence were: TR/TE = shortest (3.8/1.9), T2/T1, FOV = 180 × 180 × 90 mm3, voxel size = 0.6 × 0.6 × 1.00 mm3, NSA = 2). The total MR simulation scan time was approximately 20 min.
2.2. MRCAT synthetic CT generation algorithm
The commercial MRCAT package for syn-CT generation uses a single mDIXON MRI sequence and proprietary algorithm to generate electron density information (figure 2) (Helle et al 2014, Schadewaldt et al 2014, Köhler et al 2015). MRCAT is based on a dual-echo 3D Cartesian mDIXON acquisition that generates fat only, water only, in-phase and out-of-phase sequences. In the mDIXON approach, two echoes are acquired, allowing water, fat, and in-phase images to be derived from the same acquisition by using the frequency shift of the fat and water protons. Automatic body contouring and background removal is performed as a first step based on the mDIXON water and in-phase images. Everything outside the body mask is classified as air. A classification algorithm is then used to generate bone and soft tissue compartments. The soft tissue compartment is further classified into adipose and muscle/water-like tissue using the mDIXON in-phase and fat images. The bone component is divided into cortical (compact) and spongy/trabecular bone. The bone segmentation is improved beyond what is possible using the MR images alone through the additional use of a pelvic bone model/ atlas. Within this bone mask, voxels with in-phase signal intensity above a certain threshold are classified as compact bone with the remaining voxels being assigned to spongy bone. Finally, each voxel is assigned a bulk HU value based on its classification. Figure 3 compares a typical MRCAT syn-CT and the original planning CT. The MRCAT algorithm comes with its own relative electron density calibration curve which was slightly shallower than the curve used at our institution for HU > 500. For the comparisons in this study, our institutional calibration curve was used for HU assignment for both the planning CT and MRCAT syn-CT.
Figure 2.

MRCAT syn-CT generation algorithm schema (Reproduced with permission from Köhler et al 2015).
Figure 3.

Original planning CT (right) and MRCAT syn-CT (left) for a typical prostate patient.
2.3. Dosimetric evaluation
To evaluate the accuracy of the MRCAT syn-CT for patient treatment planning, the treatment plan and structure set from the original planning CT were transferred to the synthetic CT for first twenty patients and dose was recalculated and compared. Small differences in patient setup between the planning CT and MRCAT images prevented the direct transfer of structures between image sets. Therefore, the original planning CT was first deformed to the MR mDIXON source sequence using a free form (Demons based) deformable registration to create a deformed CT image set (def-CT). The resulting deformation was used to map all relevant structures (e.g. PTV, bowel, urethra, femurs, bladder and rectal walls) from the original CT to the def-CT. The MRCAT syn-CT, being a derived image set, was naturally registered to the original MR mDIXON sequence and could therefore be easily rigidly registered to the def-CT. Once this was complete, structures from the def-CT were rigidly mapped to the MRCAT syn-CT. Dose was then recalculated on both the def-CT and syn-CT and the dosimetric comparison was completed.
End-to-end testing of our proposed MR-only workflow was also performed on the 5 remaining patients. De-novo plans were generated on the MRCAT syn-CT using structures contoured on MR and transferred to the MRCAT syn-CT and a simulation workflow for MR-only contouring, planning, patient setup and treatment was established. Planning CT scans were also acquired for these five patients. De-novo plans generated on MRCAT syn-CT were also transferred to the deformed planning CT, recalculated and compared with the MRCAT plans.
2.4. Prostate localization assessment: 2D and 3D comparisons
To evaluate the accuracy of MRCAT syn-CT as a reference for 2D image-guided radiotherapy, DRRs were generated from both the original planning CT and MRCAT syn- CT for all twenty patients. 2D localization accuracy was then compared using two methods. In the first, the two sets of DRRs were registered to each other using a bony match using a cross-correlation metric and the registration results were evaluated. In the second method, DRRs from the original CT and MRCAT syn-CT were retrospectively registered based on the fiducials to the daily pre-treatment kV orthogonal radiographs and the difference between the two registration results were calculated. The fiducials were identified and segmented on the b-FFE sequence, the ROIs were transferred to the MRCAT syn-CT and then projected onto the syn-CT DRRs (figure 4). It was also convenient to burn the fiducial ROI on the MRCAT syn-CT by assigning a high HU (3000) to the pixels inside the fiducial ROI.
Figure 4.

Fiducial ROI on MRCAT syn-CT (top left) based on fiducial visualization on the 3D b-FFE fiducial sequence. T2w MRI and mDIXON source MR water images are also shown and are naturally registered to the gold fiducial sequence. The co-registration of all the MR series as well as MRCAT syn-CT allows contouring of the soft tissue structures and gold fiducials on any MR image with direct transfer to the syn-CT.
3D image-guided prostate localization was assessed by comparing the fiducial-based manual registration results between the on-treatment cone beam CT (CBCT) and either the planning CT or the MRCAT syn-CT. To perform the localization, the workflow described in figure 5 was followed. The planning CT was registered to the mDIXON simulation MR based on implanted fiducials and saved as a registered CT. Both, the registered planning CT and MRCAT syn-CT were then registered to pre-treatment CBCT based on fiducials and the difference in shifts was calculated. The difference between the shifts was evaluated as a function of treatment fractions in the X (lateral), Y (vertical) and Z (longitudinal) directions. In total, five hypofractionated cases with 5 fractions each (a total of 25 CBCTs) were analyzed.
Figure 5.

CBCT-based localization comparison between planning CT and MRCAT syn-CT.
2.5. Distortion analysis using B0 maps
B0 field maps are derived from two gradient echo images with different echo times to calculate patient specific susceptibility distortions. The change in MR signal between the two phase images is proportional to both the field inhomogeneity in that voxel and the echo time difference (Jezzard and Balaban 1995). Equation (1) was used to calculate the change in B0 inhomogeneity due to patient-induced susceptibility effects:
| (1) |
Where ΔB0 is the B0 field distortion in Hz, ϕ1 and ϕ2 are the phase values of two images, TE,1 and TE,2 are the echo times of the two images and γ is the gyromagnetic ratio. The phase images are wrapped between −π and +π and were unwrapped using a N-dimensional phase unwrapping algorithm available in FSL (Jenkinson et al 2012). The B0 maps calculated using equation (1) was converted to pixel shift maps Δx (in mm) based on the bandwidth for mDIXON sequence using (equation (2)):
| (2) |
Where BWx is the frequency encoding bandwidth in Hz/pixel, Δυx is the pixel size in the frequency encoding direction in mm. The field maps were registered to the corresponding anatomical image and pixel shifts were calculated within the entire patient body as well as the prostate ROI alone.
3. Results
3.1. Dosimetric evaluation
Dosimetric comparison between CT and MRCAT syn-CT was on average within 0.5% for all structure. In figure 6, the boxplots represent the dose difference statistics for the dosimetrically relevant structures for all twenty patients. The box represents the 25th and 75th percentile of the differences while the horizontal line within the box represents the median value. Red pluses indicate outliers. Figure 6(a) shows the percent dose difference while figure 6(b) shows absolute differences. As shown in figure 6(b), the outliers with higher percent dose difference correspond to very low dose values with absolute dose differences less than 100 cGy.
Figure 6.

Percent (a) and absolute (b) dose differences between MRCAT syn-CT and def-CT for the PTV, rectal wall, bladder wall, femurs, small and large bowel and urethra. Each boxplot analysis is based on results for twenty patients.
3.2. Treatment localization evaluation
Bony DRRs were generated from both the original planning CT and MRCAT syn-CT. The 2D registration between CT and MRCAT syn-CT DRRs was performed using the cross correlation metric. The average match for all the patients was 0.3 ± 0.4 mm, 0.03 ± 0.6 and 0.5 ± 0.8 mm in lateral, vertical and longitudinal direction respectively. The average correlation coefficient metric was −0.851 ± 0.04. Figure 7 shows the DRR bone match between the MRCAT syn-CT DRR and planning CT DRR for an example patient.
Figure 7.

2D bony registration between MRCAT syn-CT DRR and planning CT DRR performed using cross correlation metric for an example patient.
DRRs from planning CT and MRCAT syn-CT were also manually registered to the daily pre-treatment orthogonal kV DRRs using the gold seed fiducials. The average difference between the registrations of the planning CT DRRs-to-kV radiographs and the MRCAT syn DRRs-to- KV radiographs was 0.3 ± 0.4 mm, 0.3 ± 0.8 mm and 0.6 ± 1.0 mm along the lateral, vertical and longitudinal direction respectively. Figure 8 shows a fiducial match between MRCAT syn-CT DRR, planning CT DRR and kV radiograph for an example patient.
Figure 8.

Manual matching between MRCAT syn-CT DRR and kV radiograph (top row) and planning CT DRR and kV radiograph (bottom row) based on fiducials for an example patient.
For 3D CBCT localization, differences between the planning CT to CBCT and MRCAT syn-CT to CBCT registrations are shown in figure 9 along the left-right (LR), anterior-posterior (AP) and superior–inferior (SI) directions. The mean differences (dashed line) are within 1 mm for the LR and AP direction and less than 0.5 mm for the SI direction. Individual differences of up to 2 mm were observed for some fractions with large variation in prostate rotation between CT, MRCAT syn-CT and CBCT. The standard deviations (SDs) are 0.79 mm, 0.89 mm and 0.85 mm along LR, AP and SI directions respectively.
Figure 9.

Difference between planning CT to CBCT (CT-CBCT) and MRCAT syn-CT to CBCT (MRCAT-CBCT) registrations for four patents undergoing hypofractionated image-guided prostate radiotherapy. The difference is calculated along the LR, AP and SI direction.
3.3. Distortion analysis in MRCAT images
Patient induced susceptibility distortion using B0 maps were derived based on equation (1) for all twenty patients. The mean distortion within the outer body ROI and prostate ROI was −0.07 mm (range: −0.73–0.56 mm) and −0.2 mm (range: −0.62–0.35 mm) respectively. Figure 10 shows sample data from a patient’s 3D B0 map. As shown in both the color map and the body contour histogram, the majority of the pixel values are within ±1 mm. The average distortion within the prostate ROI was found to be <0.5 mm for all cases.
Figure 10.

Patient induced susceptibility distortions in the MRCAT source MR images.
3.4. MR based-workflow
A workflow for MR-only simulation, contouring, planning and pre-treatment positioning was established and in addition to pre-clinical testing, end-to-end testing was done for the first 5 patients planned and treated using this workflow. An appointment was scheduled in the CT Simulator suite to prepare the immobilization device, place the foley catheter and place initial reference tattoos. The patients were then taken to MR for simulation where a rectal catheter was placed. MR-compatible radio opaque structures (BBs) were placed on the reference tattoos and patients were scanned. MRCAT syn-CT images were generated at the scanner and sent to commercial contouring software7. Within this software, the individual MR sequences were formally registered to each other and also to the MRCAT syn-CT and the physician contoured the target and normal tissues using all appropriate MR sequences. Upon completion, the structure set, CT and MR images were sent to the treatment planning system8. De-novo plans were generated on the MRCAT syn-CTs using multiple VMAT arcs. The de-novo plans met all clinical objectives and the MUs were comparable to CT-based plans. For all five cases, the de-novo plan was mapped back to the original CT and the dose was recalculated. The dose differences were less than 0.5% for all relevant structures. Figure 9 shows an example of a MRCAT syn-CT treatment plan generated using two VMAT arcs. Also shown are the results of the pre-treatment image guidance performed by matching the kV radiographs to the MRCAT syn-CT DRRs.
3.5. Discussion
In this study, we evaluated the dosimetric and geometric accuracy of the first FDA-approved synthetic CT software and established clinical workflows for MR-only simulation, planning and image-guided radiotherapy for prostate cancer. Our analysis showed that the doses to the target and relevant normal tissues from the CT and MRCAT syn-CT plans are within 0.5% of each other on average, indicating that synthetic CT can be used for dose calculation for this site. Likewise, de-novo plans generated on the MRCAT syn-CT images were comparable to those based on CT and met all institutional clinical criteria. Our dosimetric results in synthetic CTs are similar to what several authors have previously reported in prostate. Korhonen et al showed PTV doses to be with 0.8% with an average deviation of 0.3% using a dual model HU conversion technique based on MRI intensity values within and outside of bone segment (Korhonen et al 2014). Siversson et al used an automatic tissue classification method in combination with a multitemplate MRI and CT atlas and showed a dosimetric accuracy of 0.0% ± 0.2% average mean dose difference to target between syn-CT and registered CT (Siversson et al 2015). Kim et al showed a dosimetric comparison of less than 1% between syn-CT and planning CT based on a voxel-based weighted summation approach (Kim et al 2015b). All these studies either used a common external body contour or deformed the original CT or syn-CT for their dosimetric comparison. The differences in outer body contour are due to differences in setup positioning between CT and MR and can result in larger systematic error in dosimetric evaluation of syn-CT. The impact of external body contour difference was reported by Dowling et al where they showed an average isocenter point dose discrepancy of 2% using an atlas-based electron density mapping approach to generate syn-CT (Dowling et al 2012).
The mean differences between DRRs generated from the planning CT and MRCAT syn-CT were minimal as evidenced by the small registration shifts (<1.0 mm) between them. Please note that the DRR bony registration between the MRCAT syn-CT and original planning CT is the worst case scenario as the comparison also includes the setup uncertainty in positioning between CT and MR and not just from the DRR generation. The mean difference between fiducial-based registrations to pre-treatment KV radiographs was small although standard deviation approached up to 1.0 mm in the vertical direction for fiducial match. The differences were most likely due to MR’s slightly larger slice thickness in this direction. We are currently investigating methods to overcome this and expect that this can be further improved to minimize the discrepancy in fiducial based DRR matching between planning CT and MRCAT syn-CT. Likewise, comparable differences were observed when using MRCAT syn-CT images for fiducial-based pre-treatment 3D localization compared to planning CT indicating that the MRCAT syn-CT images are sufficient not only for planning and dose calculation but also for patient setup. At our institution, the planning CT is also used to ensure reproducibility of the bladder and rectal filling on the pre-treatment CBCT. Thus far, our physicians have found the rectal and bladder outlines on syn-CT (e.g. figure 3) to be adequate for assessing rectal and bladder filling. Quantitative IGRT results were also reported by Korhonen et al in a separate study (Korhonen et al 2015). The SDs of differences in manual registrations with planar KV and MV localization images using bony match were ≤1.0 mm and ≤1.7 mm respectively. The SDs of differences between CBCT-to-MRI and CBCT-to-CT were ≤1.0 mm and 0.8°. The syn-CT to CBCT registration in their study was based on automatic gray-level registration within a 10 cm diameter cubic VOI in contrast to our study that was based on manual match with respect to the fiducials. Kim et al have reported 2D DRR comparisons in terms of dice similarity coefficients (DSC). The calculated DSCs for AP and lateral DRRs were 0.9 ± 0.04 and 0.92 ± 0.05 respectively in their study. In contrast, we have used a cross correlation metric to perform automatic registration between planning CT and syn-CT DRRs. Both metrics are reliable for investigating DRR accuracy.
Philips MR scanners include methods to correct for system-related geometric distortion: 2D correction for 2D scans, M2D or MS scans and in-plane and through-plane 3D corrections for 3D scans. However, patient-specific susceptibility distortions cannot be corrected and vary between patients. Because of the very high bandwidth of the mDIXON sequence (~1000 Hz), the patient specific distortions are <1 mm within the body and <0.5 mm within prostate. These results imply that images generated from the mDIXON sequence should have sufficient geometric integrity for external beam treatment planning. The bandwidth of the 3D b-FFE sequence is also quite large (~800 Hz) resulting in <0.5 mm distortion in the prostate implying that localization errors due to gold fiducial marker distortion should be small. These conclusions are reinforced by our MRCAT-to- CBCT localization results which are in good agreement with the CT-to-CBCT results and suggest excellent feasibility for pre-treatment image guidance. In fact, inaccuracies in the localization of gold seed fiducials are likely to be no worse and likely less than those introduced by the fiducial artifacts generated on the planning CT. Fiducial-based localization accuracy in MR for syn-CT based IGRT has not been reported. In our study, we tested a new b-FFE based sequence for improved visualization of gold seed fiducials. BFFE-based sequence employs a T2/T1 dependency which results in a sharp signal void in the implanted seeds due to T* dephasing and susceptibility providing an excellent contrast between seeds and prostate.
Finally, MRCAT package is available as a dedicated examcard for synthetic CT generation at the MR console where the imaging parameters are fixed and the user can only adjust the image stack position/location. Automatic failure detection is built into the algorithm to detect problems with the MRCAT syn-CT classification that may arise from anomalies in bone marrow content or total bone volume, bone or outer body segmentation failures. There are also failsafe steps in the MRCAT algorithm that prevent MRCAT syn-CT generation for the following scenarios: (a) presence of hip prostheses, (b) large patient size (>50 cm in LR or >30 cm in the AP direction), (c) significant bone disease in the pelvis that compromises the accuracy of the bone model, (d) significant discrepancies from the bone atlas used in MRCAT post-processing that may arise from differences in patient positioning These failure detection modes are necessary for routine clinical use of the software.
4. Conclusions
We have presented evidence of the feasibility and clinical use of a MR-only simulation, planning and treatment workflow using commercial synthetic-CT generation software for prostate radiotherapy. The dosimetric comparison between CT-based and MRCAT synthetic CT plans demonstrates agreement to within 0.5% on average for all relevant structures. De-novo plans generated on the synthetic CT meet our clinical objectives. The b-FFE fiducial sequence enables identification of gold fiducials for image-guided treatment localization although sequence improvements that lessen sensitivity to motion are needed. The 2D and 3D reference images that were generated from synthetic CT and used for image-guided delivery show excellent target localization agreement with conventional CT images and CT-based DRRs and appear adequate for ensuring reproducibility of normal tissue filling and position.
Figure 11.
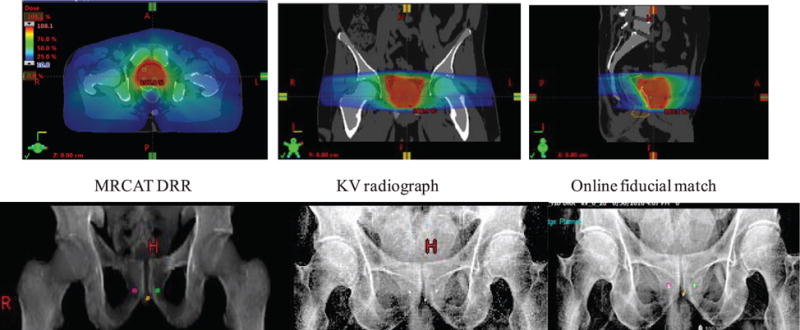
A clinical case planned with the MR-only workflow using MRCAT syn-CT. A plan using two 360° VMAT arcs was developed for a patient undergoing hypofractionated radiotherapy (800 cGy per fraction, total MU = 2715). The bottom row shows the results of the pre-treatment imaging using MRCAT syn-CT DRRs, kV radiographs and fiducial matching.
Acknowledgments
This research was partially supported by the NIH/NCI Cancer Center Support Grant/Core Grant (P30 CA008748) and by Philips Healthcare through a master research agreement between MSKCC and Philips Healthcare. We are grateful to Mr James Keller for his help in editing this manuscript.
Footnotes
(Some figures may appear in colour only in the online journal)
Ingenia 3T MR Scanner, Philips Healthcare, Cleveland, OH, USA.
Philips Healthcare, Cleveland, OH, USA.
MIM Vista, Cleveland, OH, USA.
Eclipse, Varian Medical Systems, Palo Alto, CA, USA.
References
- Chen S, Quan H, Qin A, Yee S, Yan D. MR image-based synthetic CT for IMRT prostate treatment planning and CBCT image-guided localization. J Appl Clin Med Phys. 2016;17:6065. doi: 10.1120/jacmp.v17i3.6065. [DOI] [PMC free article] [PubMed] [Google Scholar]
- Dowling JA, Lambert J, Parker J, Salvado O, Fripp J, Capp A, Wratten C, Denham JW, Greer PB. An atlas-based electron density mapping method for magnetic resonance imaging (MRI)-alone treatment planning and adaptive MRI-based prostate radiation therapy. Int J Radiat Oncol Biol Phys. 2012;83:e5–11. doi: 10.1016/j.ijrobp.2011.11.056. [DOI] [PubMed] [Google Scholar]
- Greer PB, Dowling JA, Lambert JA, Fripp J, Parker J, Denham JW, Wratten C. Capp A and Salvado O 2011 A magnetic resonance imaging-based workflow for planning radiation therapy for prostate cancer. Med J Aust. 194:S24–7. doi: 10.5694/j.1326-5377.2011.tb02939.x. [DOI] [PubMed] [Google Scholar]
- Helle M, Schadewaldt N, Frantzen-Steneker M, Schulz H, Stehning C, Heide U, Renisch S. ISMRM. 2014. Evaluation of DIXON based soft tissue and bone classification in the pelvis for MR-only-based radiation therapy planning; p. 1128. [Google Scholar]
- Jenkinson M, Beckmann CF, Behrens TE, Woolrich MW, Smith SM. FSL Neuroimage. 2012;62:782–90. doi: 10.1016/j.neuroimage.2011.09.015. [DOI] [PubMed] [Google Scholar]
- Jezzard P, Balaban RS. Correction for geometric distortion in echo planar images from B0 field variations. Magn Reson Med. 1995;34:65–73. doi: 10.1002/mrm.1910340111. [DOI] [PubMed] [Google Scholar]
- Kim J, Garbarino K, Schultz L, Levin K, Movsas B, Siddiqui MS, Chetty IJ, Glide-Hurst C. Dosimetric evaluation of synthetic CT relative to bulk density assignment-based magnetic resonance-only approaches for prostate radiotherapy. Radiat Oncol. 2015a;10:239. doi: 10.1186/s13014-015-0549-7. [DOI] [PMC free article] [PubMed] [Google Scholar]
- Kim J, Glide-Hurst C, Doemer A, Wen N, Movsas B, Chetty IJ. Implementation of a novel algorithm for generating synthetic CT images from magnetic resonance imaging data sets for prostate cancer radiation therapy. Int J Radiat Oncol Biol Phys. 2015b;91:39–47. doi: 10.1016/j.ijrobp.2014.09.015. [DOI] [PubMed] [Google Scholar]
- Köhler M, Vaara T, Grootel MV, Hoogeveen R, Kemppainen R, Renisch S. MR-only simulation for radiotherapy planning. Philips White Paper 2015 [Google Scholar]
- Korhonen J, Kapanen M, Keyrilainen J, Seppala T, Tenhunen M. A dual model HU conversion from MRI intensity values within and outside of bone segment for MRI-based radiotherapy treatment planning of prostate cancer. Med Phys. 2014;41:011704. doi: 10.1118/1.4842575. [DOI] [PubMed] [Google Scholar]
- Korhonen J, Kapanen M, Sonke JJ, Wee L, Salli E, Keyrilainen J, Seppala T, Tenhunen M. Feasibility of MRI-based reference images for image-guided radiotherapy of the pelvis with either cone-beam computed tomography or planar localization images. Acta Oncol. 2015;54:889–95. doi: 10.3109/0284186X.2014.958197. [DOI] [PubMed] [Google Scholar]
- Lambert J, et al. MRI-guided prostate radiation therapy planning: investigation of dosimetric accuracy of MRI-based dose planning. Radiother Oncol. 2011;98:330–4. doi: 10.1016/j.radonc.2011.01.012. [DOI] [PubMed] [Google Scholar]
- Liu L, Cao Y, Fessler JA, Jolly S, Balter JM. A female pelvic bone shape model for air/bone separation in support of synthetic CT generation for radiation therapy. Phys Med Biol. 2016;61:169–82. doi: 10.1088/0031-9155/61/1/169. [DOI] [PMC free article] [PubMed] [Google Scholar]
- Nyholm T, et al. Variability in prostate and seminal vesicle delineations defined on magnetic resonance images, a multi-observer, -center and -sequence study. Radiat Oncol. 2013;8:126. doi: 10.1186/1748-717X-8-126. [DOI] [PMC free article] [PubMed] [Google Scholar]
- Roach M., III Is it time to change the standard of care from CT to MRI for defining the apex of the prostate to accomplish potency-sparing radiotherapy? Int J Radiat Oncol Biol Phys. 2005;61:1–2. doi: 10.1016/j.ijrobp.2004.05.038. [DOI] [PubMed] [Google Scholar]
- Sander L, Langkilde NC, Holmberg M, Carl J. MRI target delineation may reduce long-term toxicity after prostate radiotherapy. Acta Oncol. 2014;53:809–14. doi: 10.3109/0284186X.2013.865077. [DOI] [PubMed] [Google Scholar]
- Schadewaldt N, Schulz H, Helle M, Frantzen-Steneker M, Heide U, Renisch S. Comparison of dose calculation on automatically generated MR based ED maps and corresponding patient CT for clinical prostate EBRT plans. Med Phys. 2014;41:188. [Google Scholar]
- Siversson C, Nordstrom F, Nilsson T, Nyholm T, Jonsson J, Gunnlaugsson A, Olsson LE. Technical note: MRI only prostate radiotherapy planning using the statistical decomposition algorithm. Med Phys. 2015;42:6090–7. doi: 10.1118/1.4931417. [DOI] [PubMed] [Google Scholar]
- Wachter S, Wachter-Gerstner N, Bock T, Goldner G, Kovacs G, Fransson A, Potter R. Interobserver comparison of CT and MRI-based prostate apex definition. Clinical relevance for conformal radiotherapy treatment planning. Strahlenther Onkol. 2002;178:263–8. doi: 10.1007/s00066-002-0907-x. [DOI] [PubMed] [Google Scholar]