Abstract
Kidney transplant provides significant survival, cost, and quality-of-life benefits over dialysis in patients with end-stage kidney disease, but the number of kidney transplant candidates on the waiting list continues to grow annually. By the end of 2014, nearly 100,000 adult candidates and 1500 pediatric candidates were waiting for kidney transplant. Not surprisingly, waiting times also continued to increase, along with the number of adult candidates removed from the list due to death or deteriorating medical condition. Death censored graft survival has increased after both living and deceased donor transplants over the past decade in adult recipients. The majority of the trends seen over the past 5 years continued in 2014. However, the new allocation system was implemented in late 2014, providing an opportunity to assess changes in these trends in the coming years.
Keywords: End-stage renal disease, kidney transplant, organ allocation, waiting list
Introduction
The 2014 kidney transplant data report reveals ongoing trends consistent with the past 5–10 years, including a growing waiting list, longer waiting times, and decreasing rates of living donation. More encouraging are ongoing improvements in posttransplant outcomes, such as rates of acute rejection, death censored graft loss, and posttransplant diabetes. These trends are particularly interesting, however, in light of the new allocation system implemented in December 2014, and they provide an opportunity to look for signals of changes brought about by the new system in 2015.
The new allocation system characterizes deceased donors using the kidney donor risk index (KDRI), which includes donor age, height, weight, race/ethnicity, history of hypertension or diabetes, cause of death, serum creatinine, hepatitis C status, and donation after cardiac death status. A lower KDRI score is associated with longer graft survival. KDRI scores are converted to percentiles (kidney donor profile index [KDPI]) every year based on all donors from whom a kidney was recovered for the purpose of transplant during the previous year. In an attempt to better match donor kidneys that have a longer predicted survival to recipients with the longest predicted survival, kidneys with a KDRI percentile of 20% or less are now preferentially allocated to candidates in the top 20% of estimated posttransplant survival. Priority is given to candidates awaiting multiple organs, candidates with calculated panel-reactive antibodies (CPRA) 98% and above, zero-HLA mismatch kidneys, pediatric candidates, and prior living donors. Additional priority points are given on a sliding scale to candidates with CPRA greater than 19%, and the most priority is given to the most highly sensitized candidates, with local, regional, and national priority for organ offers given to those with CPRA 98%, 99%, and 100%, respectively. Blood type A2 and A2B kidneys are now offered to medically suitable type B candidates. In addition, children receive priority for kidneys with a KDPI of less than 35%. Finally, candidates who are listed after initiating dialysis are given credit for time spent on dialysis prior to listing.
Many predictions have been made regarding how these changes will affect waitlist and posttransplant outcomes. However, these forecasts were not designed to predict how human behaviors will change in response to this new system, allowing the possibility of some unexpected changes. Results from the first 6 months under the new system reveal several noteworthy changes that were predicted, including greatly increased access to transplant for high-CPRA candidates, more transplants for candidates with longer dialysis duration, and fewer mismatches in expected longevity between donor kidneys and recipients. Since the new system was not implemented until late in the year, its impact was limited in 2014 but will be fully evident in 2015 and in subsequent years.
Regarding overall trends, 2014 was similar to the previous 5 years, and this consistency may provide increased ability to detect early signals of changing outcomes in the years to come. Of particular interest are the populations who are intended to benefit from the new system, such as highly sensitized candidates or those with blood type B, as well as candidates with lengthy pre-listing dialysis time. While we will have to wait several years to assess many of the anticipated benefits of the new system, such as the rate of death with a functioning graft among deceased donor recipients, some changes may be evident within 1 or 2 years, such as the proportion of waitlisted candidates who have been on dialysis for longer than 6 years.
Ultimately, the new allocation system may have only limited ability to correct the most fundamental challenge to kidney transplantation in the current era: a growing demand for kidney transplants that continues to outpace a stagnant or declining supply of both deceased and living donor kidneys. These data illustrate this issue while also highlighting potential targets for improvement.
Adult Kidney Transplant
Waiting List
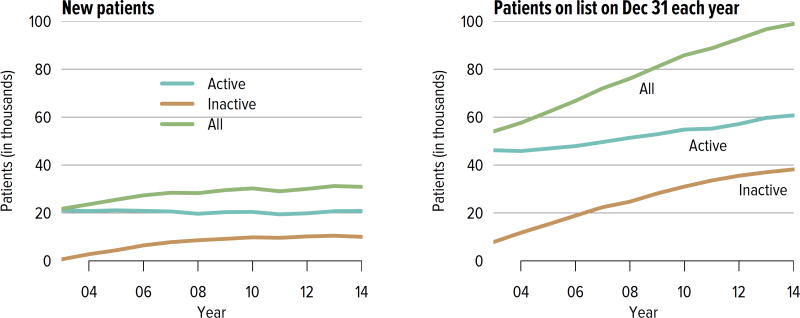
The number of candidates on the kidney transplant waiting list continued to increase steadily, from nearly 58,000 in 2004 to 98,956 in 2014 (Figure KI 1.1). More than a third of the nearly 100,000 candidates on the list in 2014 were listed as inactive. Seventy-three percent of those who were inactive on day 7 post-listing were still undergoing workup. Of those who were active at the time of listing but inactive at the end of 2014, 36.8% were inactivate due to deteriorating medical condition (Table KI 1.1). Given that prevalent dialysis patients are now given credit for time spent on dialysis, the numbers of new candidates listed as inactive may decline, as there will be no benefit to early inactive listing.
Figure KI 1.1. Adults waiting for kidney transplant.
Candidates concurrently listed at multiple centers are counted once. Candidates who are active at at least one program are considered active; otherwise they are inactive. Active status is determined on day 7 after first listing. A new patient is one who first joined the list during the given year without ever listing in a prior year, or one who listed and underwent transplant in a prior year and relisted in the given year.
Table KI 1.1. Reasons for inactive status among adult kidney transplant listings, 2014.
As candidates can be concurrently listed at more than one center and reasons for inactive status may differ, each listing is counted separately.
| Inactive 7 days after listing |
Active at listing, inactive on Dec 31 |
|||
|---|---|---|---|---|
| Reasons for inactive status | N | % | N | % |
| Candidate work-up incomplete | 8,539 | 73.0 | 5,884 | 31.0 |
| Insurance issues | 1,024 | 8.8 | 1,711 | 9.0 |
| Too sick | 800 | 6.8 | 6,972 | 36.8 |
| Weight inappropriate | 521 | 4.5 | 1,019 | 5.4 |
| Too well | 389 | 3.3 | 925 | 4.9 |
| Candidate choice | 164 | 1.4 | 1,016 | 5.4 |
| Transplant pending | 84 | 0.7 | 53 | 0.3 |
| Candidate for LD transplant only | 72 | 0.6 | 11 | 0.1 |
| Inappropriate substance abuse | 35 | 0.3 | 232 | 1.2 |
| Medical non-compliance | 34 | 0.3 | 651 | 3.4 |
| Unknown | 33 | 0.3 | 113 | 0.6 |
| Candidate could not be contacted | 2 | 0.0 | 366 | 1.9 |
| Removal pending data correction | 1 | 0.0 | 0 | 0.0 |
| Physician/surgeon unavailable | 1 | 0.0 | 10 | 0.1 |
LD, living donor.
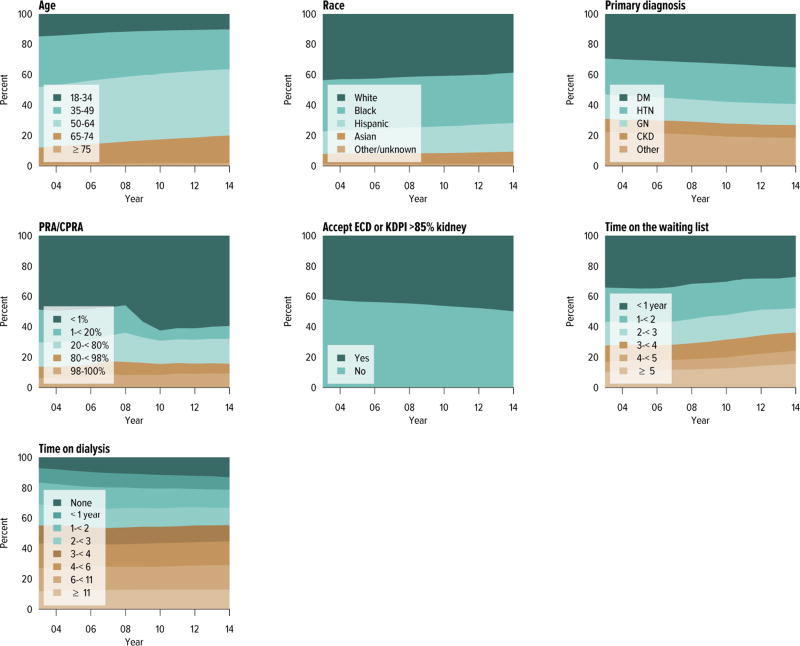
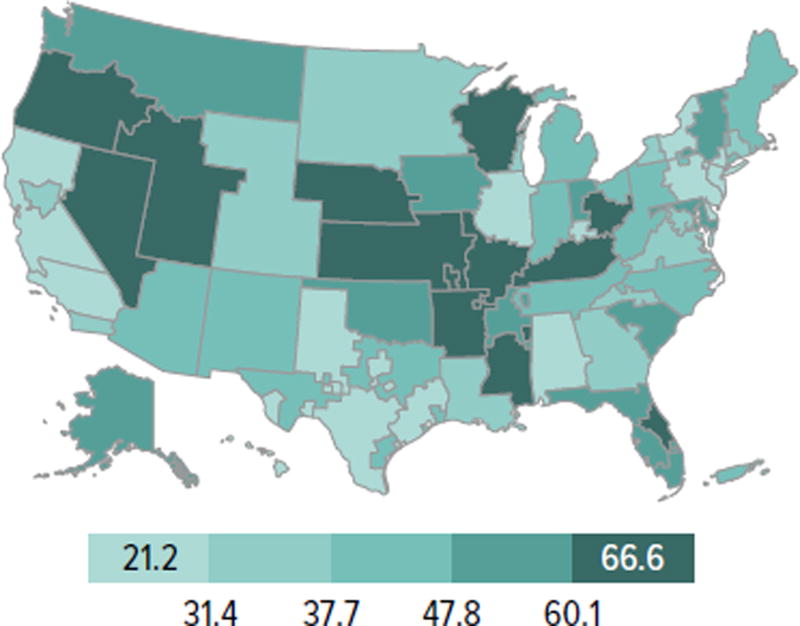
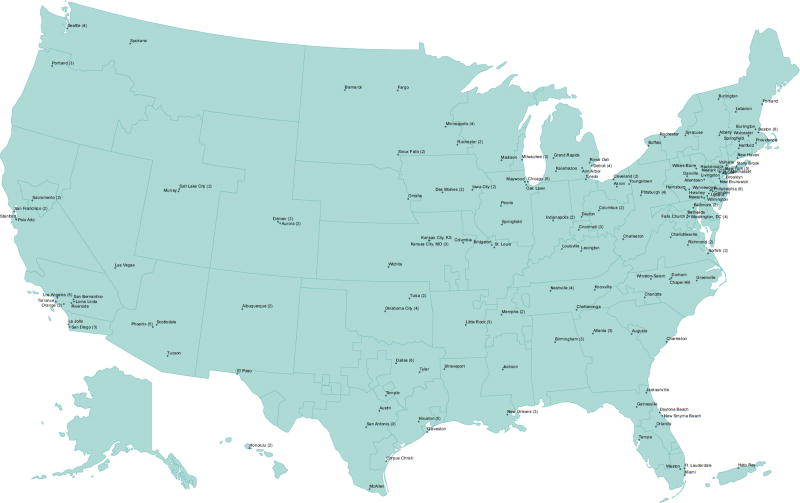
Candidates aged 65 years or older continued to make up an increasing proportion of the waiting list; although they accounted for only 21.2% of the waiting list in 2014, this is an increase from 13.8% in 2004. Candidate racial and sex distribution changed little in 10 years, with slight increases in the proportion of Hispanic candidates and decreases in the proportion of white candidates. Diabetes as the cause of end-stage kidney disease also increased slightly from 29.7% to 35.5% over 10 years. The number of candidates on dialysis for at least 6 years remained high but relatively stable at 29.0%, but this proportion may change, particularly within the next 1 or 2 years as patients who were on dialysis for many years prior to listing will immediately gain priority. Time on the waiting list continued to increase; the proportion of candidates waiting more than 5 years rose from 10.9% in 2004 to 14.7% in 2014, and fewer candidates had been waiting for less than 1 year (27.4%, vs. 34.3% in 2004). Waiting time increased despite an increase from 43.0% to 51.5% in the proportion of candidates who reported willingness to accept an expanded criteria kidney (Figure KI 1.2, Table KI 1.2). Large geographic variation by donation service area remained in the percentage of candidates undergoing deceased donor transplant within 5 years, ranging from 6.0% to 72.2% (Figure KI 1.5).
Figure KI 1.2. Distribution of adults waiting for kidney transplant.
Candidates waiting for transplant at any time in the given year. Candidates listed concurrently at multiple centers are counted once. Age is determined at the later of listing date or January 1 of the given year. Time on the waiting list and on dialysis are determined at the earlier of December 31 or removal from the waiting list. PRA is the highest value during the year. Active and inactive candidates are included. CKD, cystic kidney disease; DM, diabetes. HTN, hypertension. GN, glomerulonephritis. ECD, expanded criteria donor.
Table KI 1.2. Characteristics of adults on the kidney transplant waiting list on December 31, 2004 and December 31, 2014.
Candidates waiting for transplant on December 31, 2004, and December 31, 2014, regardless of first listing date; active/inactive status is on this date, and multiple listings are not counted.
| 2004 | 2014 | ||||
|---|---|---|---|---|---|
|
|
|||||
| N | % | N | % | ||
| Age | 18–34 | 7,422 | 12.9 | 9,177 | 9.3 |
| 35–49 | 18,534 | 32.2 | 25,558 | 25.8 | |
| 50–64 | 23,711 | 41.1 | 43,282 | 43.7 | |
| ≥65 | 7,956 | 13.8 | 20,939 | 21.2 | |
|
| |||||
| Sex | Female | 24,306 | 42.2 | 39,754 | 40.2 |
| Male | 33,317 | 57.8 | 59,202 | 59.8 | |
|
| |||||
| Race | White | 22,908 | 39.8 | 35,942 | 36.3 |
| Black | 20,479 | 35.5 | 34,007 | 34.4 | |
| Hispanic | 9,288 | 16.1 | 19,222 | 19.4 | |
| Asian | 4,125 | 7.2 | 8,242 | 8.3 | |
| Other/unknown | 823 | 1.4 | 1,543 | 1.6 | |
|
| |||||
| Citizenship | US citizen | 54,323 | 94.3 | 90,523 | 91.5 |
| Non-citizen resident | 2,699 | 4.7 | 2,762 | 2.8 | |
| Non-citizen non-resident | 492 | 0.9 | 361 | 0.4 | |
| Other/unknown | 109 | 0.2 | 5,310 | 5.4 | |
|
| |||||
| Primary diagnosis | Diabetes | 17,136 | 29.7 | 35,138 | 35.5 |
| Hypertension | 14,338 | 24.9 | 24,117 | 24.4 | |
| GN | 8,994 | 15.6 | 13,825 | 14.0 | |
| CKD | 4,680 | 8.1 | 7,998 | 8.1 | |
| Other | 12,475 | 21.6 | 17,878 | 18.1 | |
|
| |||||
| Diabetes (any source) | 21,538 | 37.4 | 44,868 | 45.3 | |
|
| |||||
| Kidney transplant history | First transplant | 47,741 | 82.9 | 85,288 | 86.2 |
| Retransplant | 9,882 | 17.1 | 13,668 | 13.8 | |
|
| |||||
| Blood type | A | 16,123 | 28.0 | 28,340 | 28.6 |
| B | 9,624 | 16.7 | 16,035 | 16.2 | |
| AB | 1,559 | 2.7 | 2,796 | 2.8 | |
| O | 30,317 | 52.6 | 51,785 | 52.3 | |
|
| |||||
| PRA/CPRA | < 1% | 28,649 | 49.7 | 60,469 | 61.1 |
| 1–< 20% | 11,225 | 19.5 | 8,410 | 8.5 | |
| 20–< 80% | 8,378 | 14.5 | 14,760 | 14.9 | |
| 80–< 98% | 4,215 | 7.3 | 6,013 | 6.1 | |
| 98–100% | 3,677 | 6.4 | 8,590 | 8.7 | |
| Unknown | 1,479 | 2.6 | 714 | 0.7 | |
|
| |||||
| Waiting time | < 1 year | 19,760 | 34.3 | 27,068 | 27.4 |
| 1–< 2 years | 12,911 | 22.4 | 21,811 | 22.0 | |
| 2–< 3 years | 8,869 | 15.4 | 16,139 | 16.3 | |
| 3–< 4 years | 5,909 | 10.3 | 11,336 | 11.5 | |
| 4–< 5 years | 3,878 | 6.7 | 8,066 | 8.2 | |
| ≥ 5 years | 6,296 | 10.9 | 14,536 | 14.7 | |
|
| |||||
| Will accept ECD or KDPI >85% kidney | 24,754 | 43.0 | 50,925 | 51.5 | |
|
| |||||
| Multi-organ | Kidney alone | 54,977 | 95.4 | 95,953 | 97.0 |
| Kidney-pancreas | 2,328 | 4.0 | 1,979 | 2.0 | |
| Kidney-liver | 259 | 0.4 | 844 | 0.9 | |
| Kidney-heart | 54 | 0.1 | 165 | 0.2 | |
| Other | 5 | 0.0 | 15 | 0.0 | |
|
| |||||
| All candidates | 57,623 | 100.0 | 98,956 | 100.0 | |
CKD, cystic kidney disease; GN, glomerulonephritis; KDPI, kidney donor profile index.
Figure KI 1.5. Percentage of adults who underwent deceased donor kidney transplant within 5 years of listing in 2009, by DSA.
Candidates listed concurrently in a single DSA are counted once in that DSA; candidates listed in multiple DSAs are counted separately per DSA.
The new kidney allocation system may alleviate this geographic disparity somewhat, but reducing geographic imbalances in access to transplant was not its central goal. Rather, it was designed such that future changes to the geographic distribution of kidneys could be integrated into the system while still preserving its core elements (e.g., longevity matching). Under the new allocation system, more priority is given to the most highly sensitized candidates with the highest CPRA values (≥ 98%), and blood type A2 and A2B kidneys are offered to appropriate blood type B candidates; it will be interesting to see whether the proportion of candidates with these characteristics who undergo transplant increases in the years to come. In addition, as priority for low KDPI kidneys will be given to patients with the greatest predicted posttransplant survival, it will be important to note the proportion of older patients who undergo transplant.
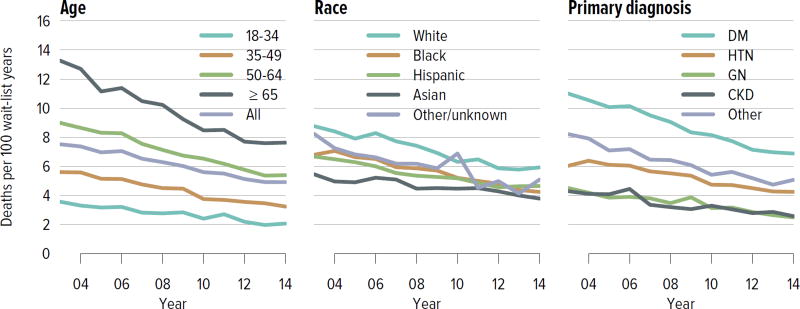
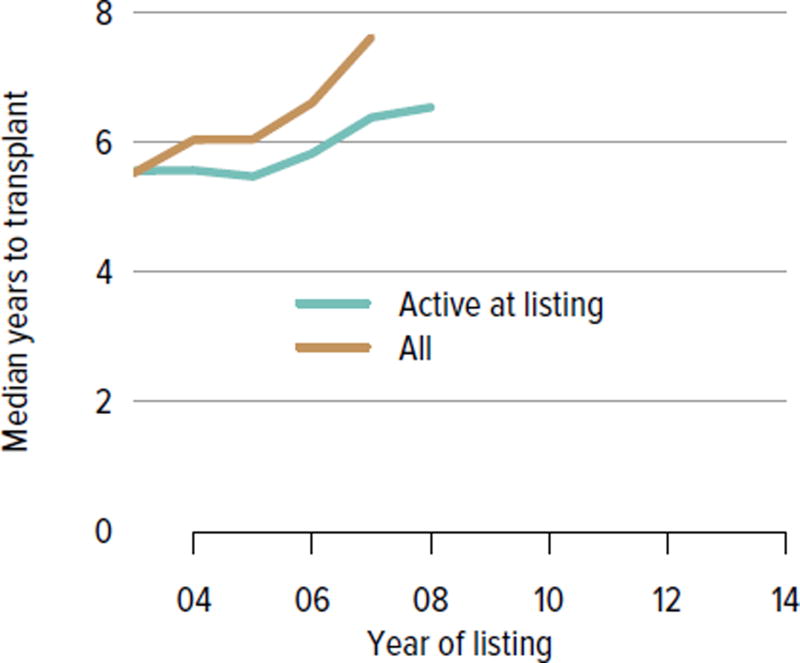
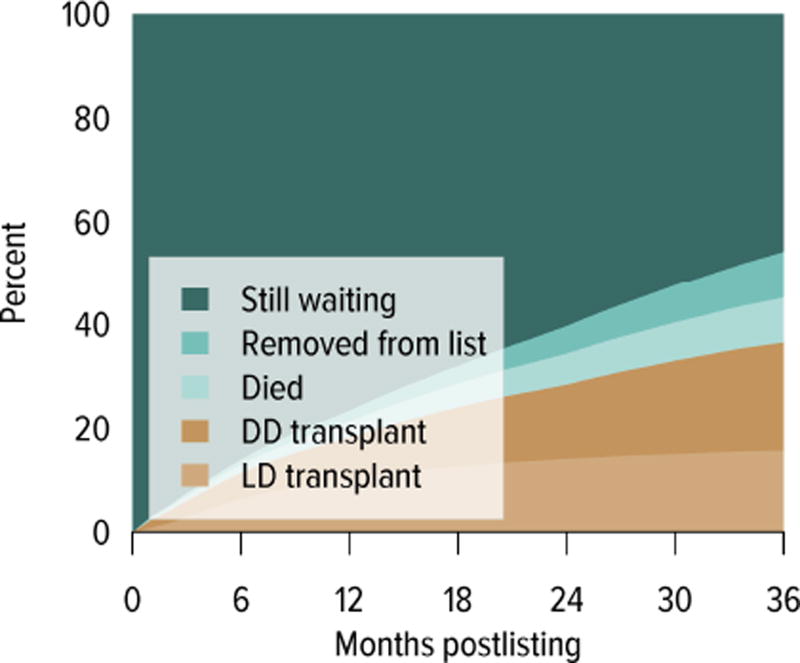
The demand for kidney transplant continues to outstrip supply. In 2014, 31,288 adult candidates were added to the waiting list and 29,023 were removed. While the number of candidates on the list increased, the number of living donor kidney transplants decreased. In 2014, 11,594 candidates underwent deceased donor transplant and 5082 underwent living donor transplant (after waiting on the deceased donor waiting list), and over 8000 candidates died or were removed from the list due to deteriorating medical condition. Although the mortality rate on the waiting list has been declining (Figure KI 1.9), the number of candidates removed from the list due to deteriorating medical condition increased from 2511 in 2012 to 3384 in 2014 (Table KI 1.3). The median number of years to deceased donor transplant also increased markedly from 5.5 in 2003 and 7.6 in 2007. The median time to transplant for candidates listed since 2008 has yet to be determined as half of these candidates have not yet undergone transplant (Figure KI 1.7). Of candidates listed in 2011, 45.7% were still waiting by the end of 2014, 8.7% had died, 9.0% had been removed from the list, 20.8% had undergone deceased donor transplant, and 15.7% had undergone living donor transplant (Figure KI 1.6). Given the increased morbidity, mortality, and allograft failure associated with longer time on dialysis before transplant, these trends may worsen, particularly in older adults, as waiting times continue to increase. In addition, as the new allocation system may decrease the likelihood of transplant in older adults, trends in waitlist outcomes by age and willingness to accept a kidney with KDPI greater than 85% will be important areas of research.
Figure KI 1.9. Mortality rates among adults waitlisted for kidney transplant.
Mortality rates are computed as the number of deaths per 100 patient-years of waiting in the given year. Individual listings are counted separately. Rates with less than 10 patient-years of exposure are not shown. Age is determined at the later of listing date or January 1 of the given year. CKD, cystic kidney disease; DM, diabetes. HTN, hypertension. GN, glomerulonephritis.
Table KI 1.3. Kidney transplant waitlist activity among adults.
Candidates concurrently listed at more than one center are counted once, from the time of earliest listing to the time of latest removal. Candidates who are listed, undergo transplant, and are relisted are counted more than once. Candidates are not considered to be on the list on the day they are removed; counts on January 1 may differ from counts on December 31 of the prior year. Candidates listed for multi-organ transplants are included.
| 2012 | 2013 | 2014 | |
|---|---|---|---|
| Patients at start of year | 88,753 | 92,669 | 96,691 |
| Patients added during year | 30,345 | 31,598 | 31,288 |
| Patients removed during year | 26,388 | 27,522 | 29,023 |
| Patients at end of year | 92,710 | 96,745 | 98,956 |
| Removal reason | |||
| Deceased donor transplant | 11,032 | 11,278 | 11,594 |
| Living donor transplant | 4,935 | 5,100 | 5,082 |
| Transplant (type unspecified) | 56 | 54 | 56 |
| Patient died | 4,736 | 4,752 | 4,931 |
| Patient refused transplant | 443 | 455 | 483 |
| Improved, transplant not needed | 157 | 194 | 197 |
| Too sick for transplant | 2,511 | 2,886 | 3,384 |
| Other | 2,518 | 2,803 | 3,296 |
Figure KI 1.7. Median years to deceased donor kidney transplant for waitlisted adults.
Observations censored on December 31, 2014; Kaplan-Meier competing risk methods used to estimate time to transplant. Analysis performed per candidate not per listing. If an estimate is not plotted, 50% of the cohort listed in that year had not undergone transplant by the censoring date. Only the first transplant is counted.
Figure KI 1.6. Three-year outcomes for adults waiting for kidney transplant, new listings in 2011.
Adults waiting for any kidney transplant and first listed in 2011. Candidates concurrently listed at more than one center are counted once, from the time of earliest listing to the time of latest removal. DD, deceased donor; LD, living donor.
Deceased Donation
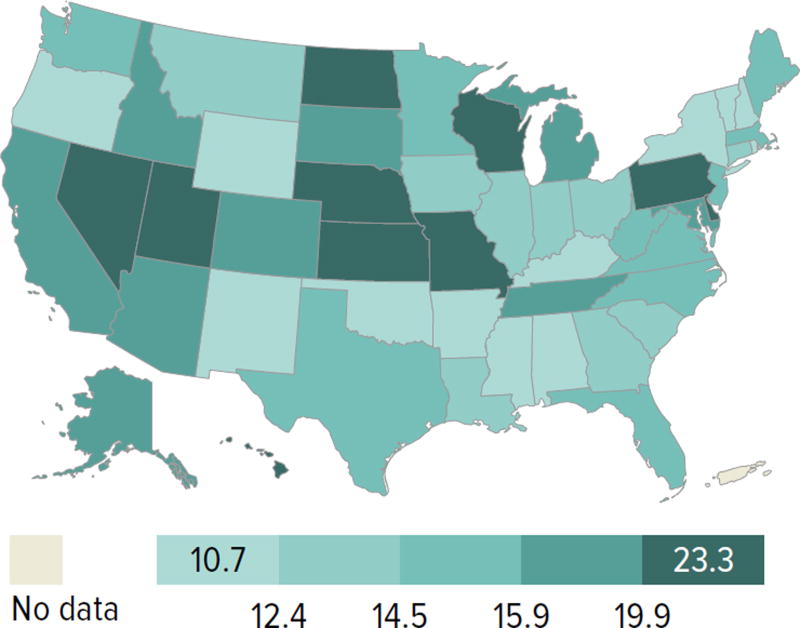
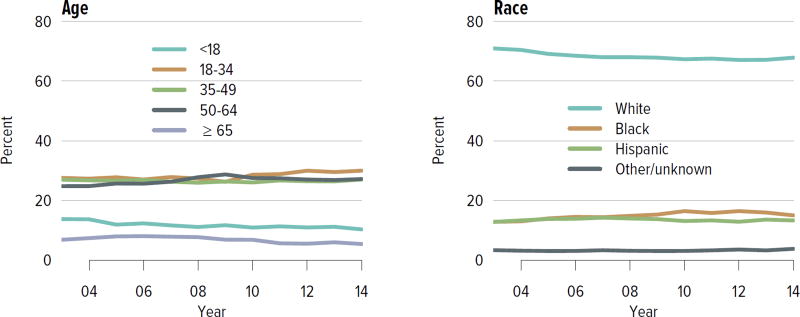
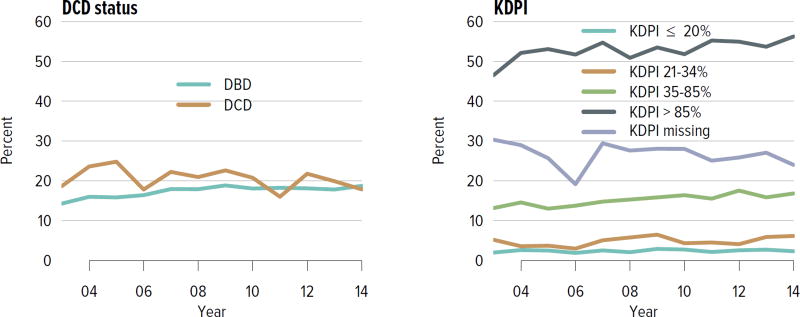
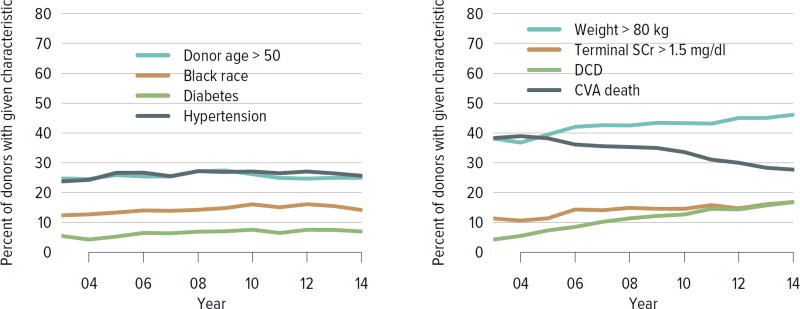
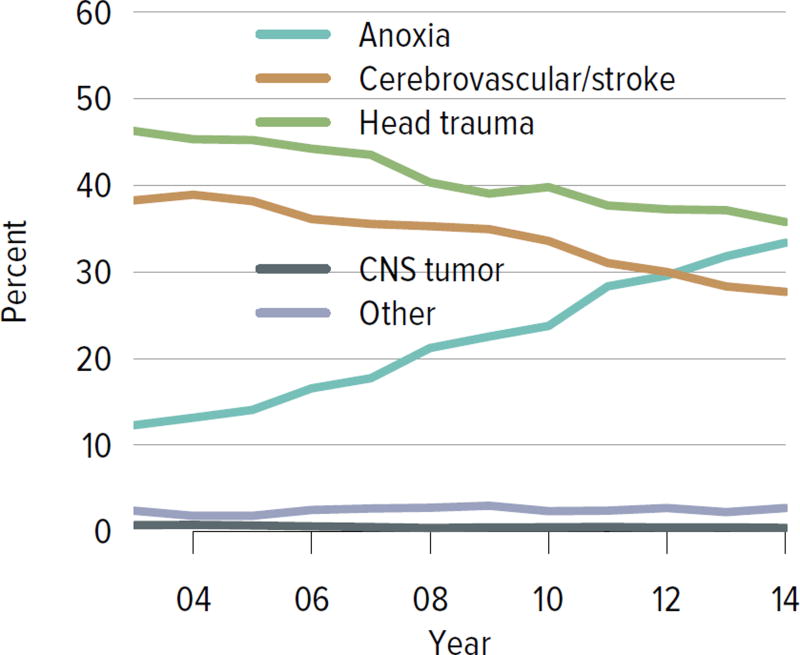
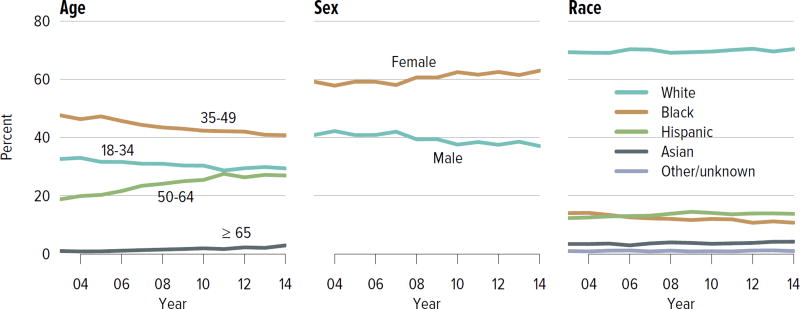
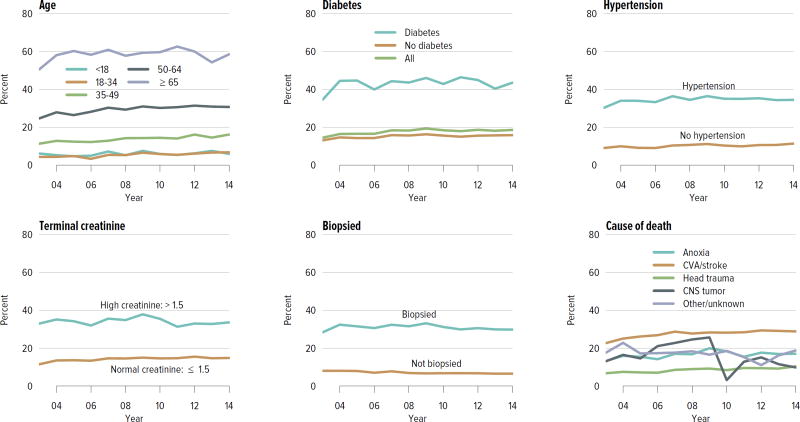
The rate of deceased donor kidney donation by state ranged from 6.7 to 29.7 donations per 1000 deaths in 2011–2013 (Figure KI 2.2). Demographic characteristics of donors remained relatively unchanged over the past decade (Figure KI 2.1). However, as in previous years, a large proportion of kidneys recovered for transplant were not transplanted, particularly kidneys recovered from donors aged 50 to 64 years (30.7% not transplanted); donors aged 65 years or older (58.5%); and donors with diabetes (43.5%), hypertension (34.5%), or terminal creatinine above 1.5 mg/dL (33.6%). Of particular alarm, 29.8% of kidneys that were biopsied were not transplanted, compared with 6.6% of kidneys that were not biopsied, despite lack of evidence that biopsy findings predict patient or graft survival. Given increasing time on the waiting list and increasing rates of removal from the list due to deteriorating medical condition, in conjunction with relatively stagnant rates of deceased donor kidney transplants, the potential use of these kidneys should be investigated. Figure KI 2.4 shows the percentages of kidneys recovered in 2014 that were not transplanted by donation after circulatory death (DCD)/donation after brain death (DBD) status (18.7% and 17.8%, respectively). Of note, the rate of discard was no higher for DCD than for DBD kidneys, despite the challenges of successfully transplanting DCD kidneys. This may be due to obtaining transplant center commitment to use DCD kidneys before they are retrieved. In contrast, there was a graded effect of KDPI on the rate of kidneys not transplanted; 56.2% of kidneys with a KDPI greater than 85% were not transplanted in 2014. The new allocation system includes changes in the way these kidneys are allocated with the intent of reducing the numbers not transplanted, and it will be important to assess whether this desired effect is realized. Percentages of donors with the ten characteristics included in the KDRI remained relatively stable for most factors; however, the percentage of donors with cerebrovascular accident as cause of death continued a long-term decreasing trend, while the percentages with weight greater than 80 kg, terminal serum creatinine greater than 1.5, and DCD status continued to increase (Figure KI 2.5). Among donors whose kidneys were ultimately transplanted, the number who died of anoxia increased and the number who died of head trauma or cerebrovascular accident/stroke decreased (Figure KI 2.6).
Figure KI 2.2. Deceased donor kidney donation rates (per 1000 deaths), by state, 2011–2013.
Numerator: Deceased donors aged < 70 years, by state of death, whose kidneys were recovered for transplant from 2011 through 2013. Denominator: US deaths aged < 70 years, by state of death, from 2011 through 2013. State death data by age obtained through agreement with NAPHSIS (http://www.naphsis.org/programs/vital-statistics-data-research-request-process). Donors whose kidneys were recovered en-bloc are counted once, and donors whose kidneys were recovered separately are counted twice.
Figure KI 2.1. Demographics of deceased kidney donors.
Deceased donors with at least one kidney recovered for transplant. Donors whose kidneys were recovered en-bloc are counted once, and donors whose kidneys were recovered separately are counted twice.
Figure KI 2.4. Kidneys recovered for transplant and not transplanted, by donor type.
Percentages of kidneys not transplanted out of all kidneys recovered for transplant, by DCD/DBD and KDPI donor classification. The reference population for the KDRI to KDPI conversion is all deceased donor kidneys recovered for transplant in the US in 2014. Kidneys recovered en-bloc are counted once. DBD, donation after brain death; DCD, donation after circulatory death; KDPI, kidney donor profile index; KDRI, kidney donor risk index.
Figure KI 2.5. Donor-specific components of the kidney donor risk index.
Donors with at least one transplanted kidney. The donor-specific components of the kidney donor risk index are shown, except for donor height and hepatitis C virus positive status. CVA, cerebrovascular accident; DCD, donation after circulatory death; SCr, serum creatinine.
Figure KI 2.6. Cause of death among deceased kidney donors.
Deceased donors whose kidneys were transplanted. Each donor is counted once. CNS, central nervous system.
Living Donation
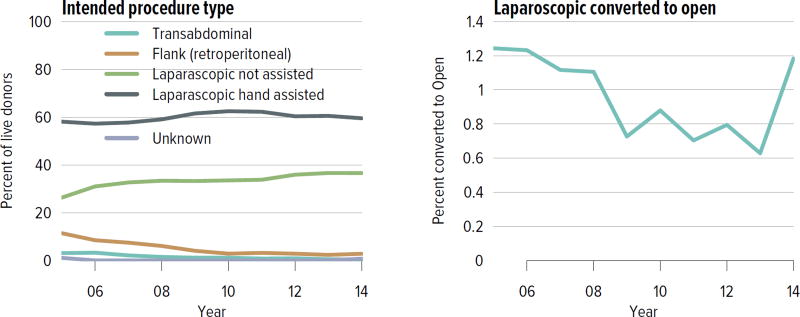
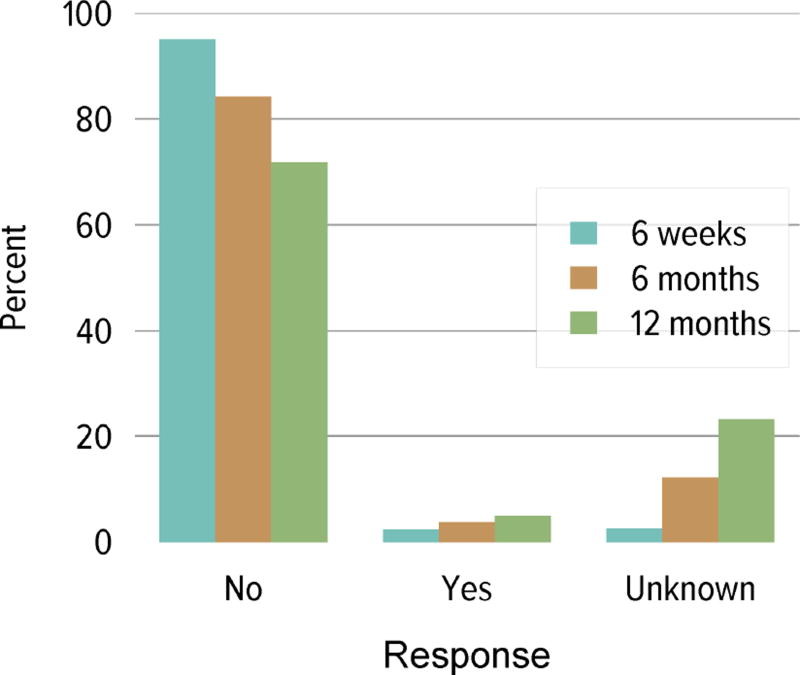
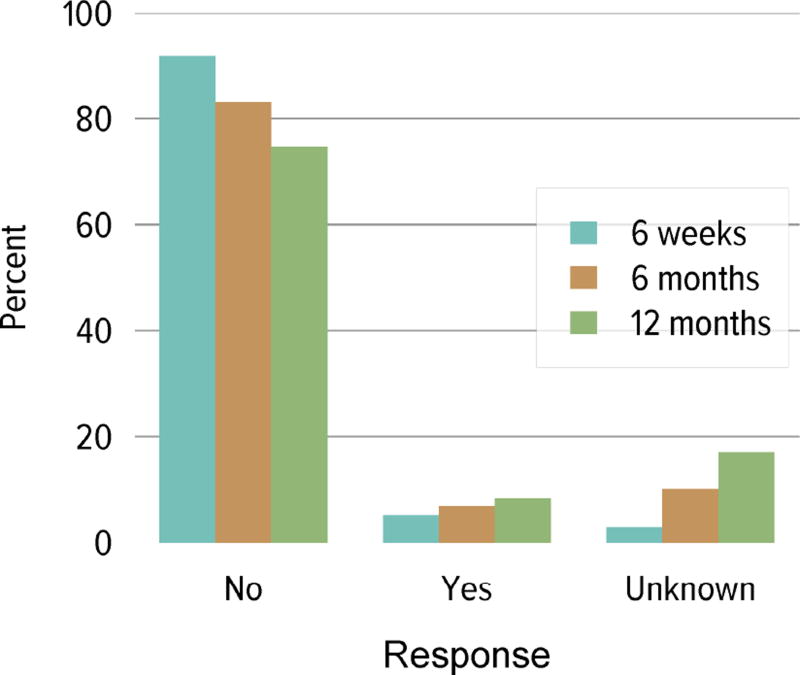
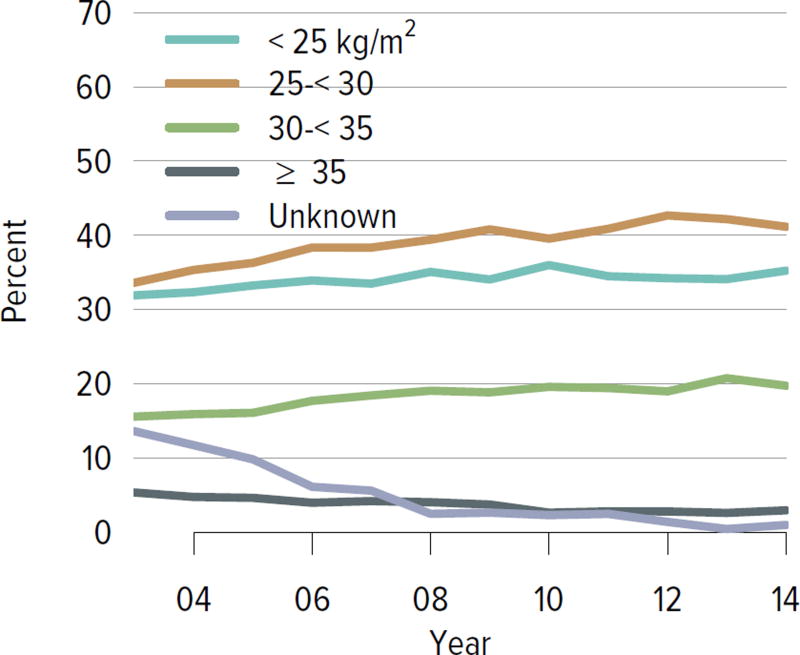
Living donation rates have declined steadily for more than a decade, largely driven by a decrease in the number of biologically related kidney donations, from 4340 in 2004 to 2693 in 2014 (Figure KI 3.1). The proportion of donors aged 50 years or older increased, while the proportion of younger donors decreased (Figure KI 3.2). Living kidney donation remained largely a laparoscopic procedure, with a rate of conversion to open procedures of only 1.2.% (Figure KI 3.3). Reported complications at the time of donation and at 6 months and 12 months, including readmission, re-operation, vascular complications, and other complications were rare, but loss to follow-up, particularly at 12 months, may result in underreporting of adverse events (Figure KI 3.4, Figure KI 3.5). Transplant programs have been accepting living donors with increasing donor body mass index (BMI); percentages of donors with BMI 25 to less than 30 and 30 to less than 35 kg/m2 increased from 35.3% and 15.9% in 2004 to 41.2% and 19.7% in 2014 (Figure KI 3.6), respectively. Deaths within 1 year of living donation were rare; in all, 20 deaths were reported within the first year between 2010 and 2014, only nine of which were attributed to causes other than trauma or suicide (Table KI 3.1).
Figure KI 3.1. Kidney transplants from living donors, by donor relation.
Numbers of living donor donations; characteristics recorded on the OPTN Living Donor Registration Form.
Figure KI 3.2. Living kidney donors, by age, sex and race.
As reported on the OPTN Living Donor Registration Form.
Figure KI 3.3. Intended living kidney donor procedure type.
As reported on the OPTN Living Donor Registration Form. Right-hand panel shows percentages of intended laparoscopic procedures converted to open.
Figure KI 3.4. Rehospitalization in the first 6 weeks, 6 months, and 1 year among living kidney donors, 2009–2013.
Cumulative hospital readmission. The 6-week time point is recorded at the earliest of discharge or 6 weeks after donation.
Figure KI 3.5. Kidney complications among living kidney donors, 2009–2013.
Complications reported on the OPTN Living Donor Registration and Living Donor Follow-up Forms at each time point. Complications include readmission, re-operation, vascular complications, and other complications requiring intervention. Multiple complications may be reported at any time point.
Figure KI 3.6. BMI among living kidney donors.
Donor height and weight reported on the OPTN Living Donor Registration Form.
Table KI 3.1. Living kidney donor deaths, 2010–2014.
Living kidney donors. Numbers of deaths reported to OPTN or the Social Security Administration. Donation-related deaths are included in the Medical category.
| Days after donation | |||
|---|---|---|---|
| Cause | 0–30 | 31–90 | 91–365 |
| Suicide | 1 | 1 | 4 |
| Accident/homicide | 0 | 0 | 5 |
| Medical | 3 | 2 | 1 |
| Cancer | 0 | 0 | 1 |
| Unknown | 0 | 1 | 1 |
| TOTAL | 4 | 4 | 12 |
Transplant
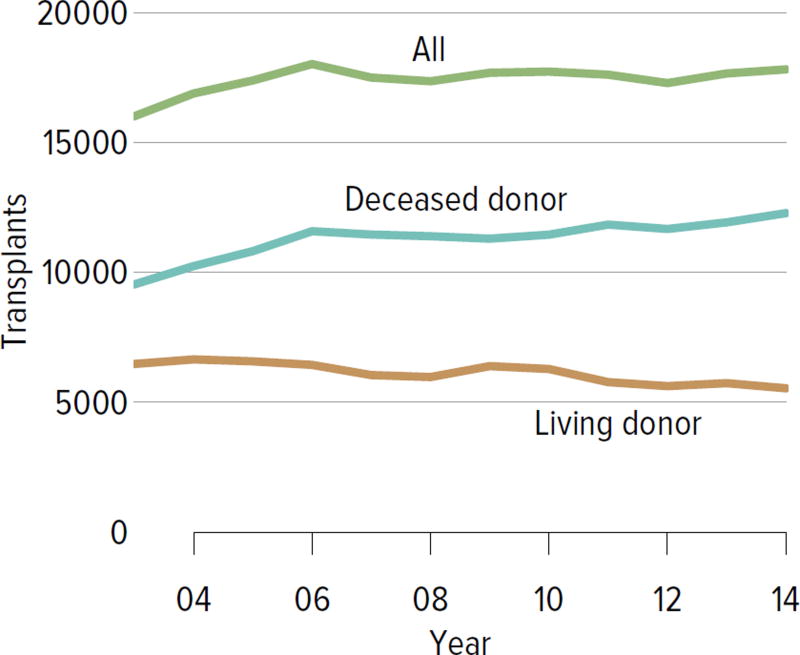
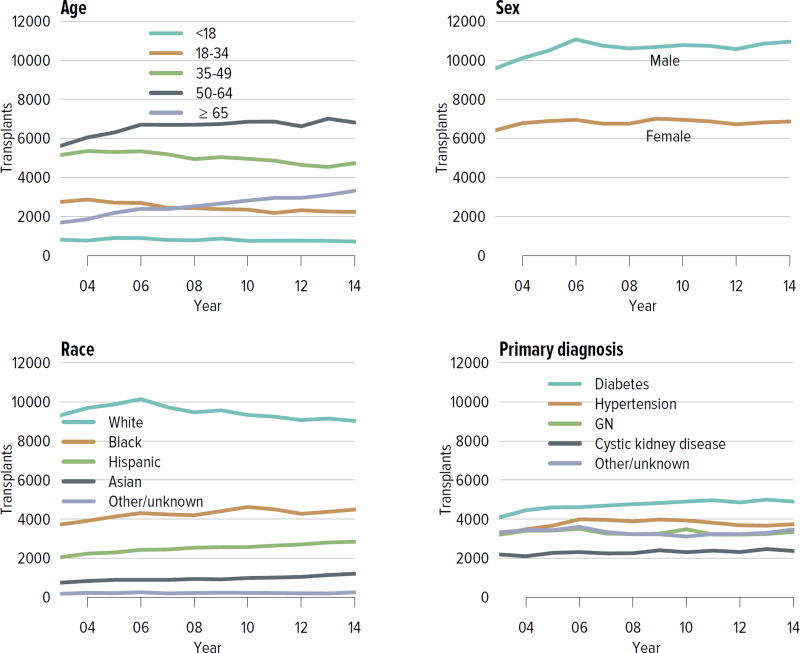
In all, 17,814 adult and pediatric kidney transplants were performed in the US in 2014 (Figure KI 4.1). The distribution by age, sex, race, and primary diagnosis is shown in Figure KI 4.2; rates have been relatively stable among these groups, except for an increase in the number of transplants among adults aged 65 years or older and slight increases among black and Hispanic candidates and candidates with diabetes as a primary diagnosis. Table KI 4.1 shows the demographics for all adults who underwent transplant in 2014; most transplants occurred in recipients aged 50 to 64 years; 61.5% of recipients were male and 50.7% were white, 25.4% black, 15.7% Hispanic, and 6.8% Asian. Diabetes was a primary diagnosis for 28.6%, and 12.5% had a CPRA of 80% or higher. Medicare was primary payer for 58.6%, and most had some time on renal replacement therapy (Table KI 4.1).
Figure KI 4.1. Total kidney transplants.
All kidney transplant recipients, including adult and pediatric, retransplant, and multi-organ recipients.
Figure KI 4.2. Kidney transplants.
All kidney transplant recipients, including adult and pediatric, retransplant, and multi-organ recipients. GN, glomerulonephritis.
Table KI 4.1. Characteristics of adult kidney transplant recipients, 2014.
Adult kidney transplant recipients, including retransplants.
| Deceased | Living | All | |||||
|---|---|---|---|---|---|---|---|
|
|
|||||||
| N | % | N | % | N | % | ||
| Age | 18–34 | 1,202 | 10.2 | 1,035 | 19.6 | 2,237 | 13.1 |
| 35–49 | 3,141 | 26.6 | 1,590 | 30.1 | 4,731 | 27.7 | |
| 50–64 | 4,902 | 41.5 | 1,913 | 36.2 | 6,815 | 39.9 | |
| ≥65 | 2,562 | 21.7 | 753 | 14.2 | 3,315 | 19.4 | |
|
| |||||||
| Sex | Female | 4,606 | 39.0 | 1,970 | 37.2 | 6,576 | 38.5 |
| Male | 7,201 | 61.0 | 3,321 | 62.8 | 10,522 | 61.5 | |
|
| |||||||
| Race | White | 5,144 | 43.6 | 3,523 | 66.6 | 8,667 | 50.7 |
| Black | 3,660 | 31.0 | 690 | 13.0 | 4,350 | 25.4 | |
| Hispanic | 1,940 | 16.4 | 743 | 14.0 | 2,683 | 15.7 | |
| Asian | 876 | 7.4 | 294 | 5.6 | 1,170 | 6.8 | |
| Other/unknown | 187 | 1.6 | 41 | 0.8 | 228 | 1.3 | |
|
| |||||||
| Primary diagnosis | Diabetes | 3,741 | 31.7 | 1,156 | 21.8 | 4,897 | 28.6 |
| Hypertension | 2,844 | 24.1 | 892 | 16.9 | 3,736 | 21.9 | |
| GN | 1,887 | 16.0 | 1,326 | 25.1 | 3,213 | 18.8 | |
| CKD | 1,201 | 10.2 | 868 | 16.4 | 2,069 | 12.1 | |
| Other | 2,134 | 18.1 | 1,049 | 19.8 | 3,183 | 18.6 | |
|
| |||||||
| Blood type | A | 4,339 | 36.7 | 2,042 | 38.6 | 6,381 | 37.3 |
| B | 1,546 | 13.1 | 729 | 13.8 | 2,275 | 13.3 | |
| AB | 580 | 4.9 | 213 | 4.0 | 793 | 4.6 | |
| O | 5,342 | 45.2 | 2,307 | 43.6 | 7,649 | 44.7 | |
|
| |||||||
| PRA/CPRA | < 1% | 7,284 | 61.7 | 3,843 | 72.6 | 11,127 | 65.1 |
| 1–< 20% | 941 | 8.0 | 431 | 8.1 | 1,372 | 8.0 | |
| 20–< 80% | 1,734 | 14.7 | 718 | 13.6 | 2,452 | 14.3 | |
| 80–< 98% | 1,337 | 11.3 | 195 | 3.7 | 1,532 | 9.0 | |
| 98–100% | 510 | 4.3 | 95 | 1.8 | 605 | 3.5 | |
| Unknown | 1 | 0.0 | 9 | 0.2 | 10 | 0.1 | |
|
| |||||||
| History of RRT | Preemptive transplant | 1,246 | 10.6 | 1,670 | 31.6 | 2,916 | 17.1 |
| < 1 year | 926 | 7.8 | 1,181 | 22.3 | 2,107 | 12.3 | |
| < 3 years | 2,485 | 21.0 | 1,285 | 24.3 | 3,770 | 22.0 | |
| < 5 years | 2,505 | 21.2 | 384 | 7.3 | 2,889 | 16.9 | |
| ≥5 years | 4,645 | 39.3 | 771 | 14.6 | 5,416 | 31.7 | |
|
| |||||||
| Insurance | Private | 2,883 | 24.4 | 2,990 | 56.5 | 5,873 | 34.3 |
| Medicare | 8,056 | 68.2 | 1,962 | 37.1 | 10,018 | 58.6 | |
| Medicaid | 536 | 4.5 | 199 | 3.8 | 735 | 4.3 | |
| Other government | 189 | 1.6 | 59 | 1.1 | 248 | 1.5 | |
| Other/unknown | 143 | 1.2 | 81 | 1.5 | 224 | 1.3 | |
|
| |||||||
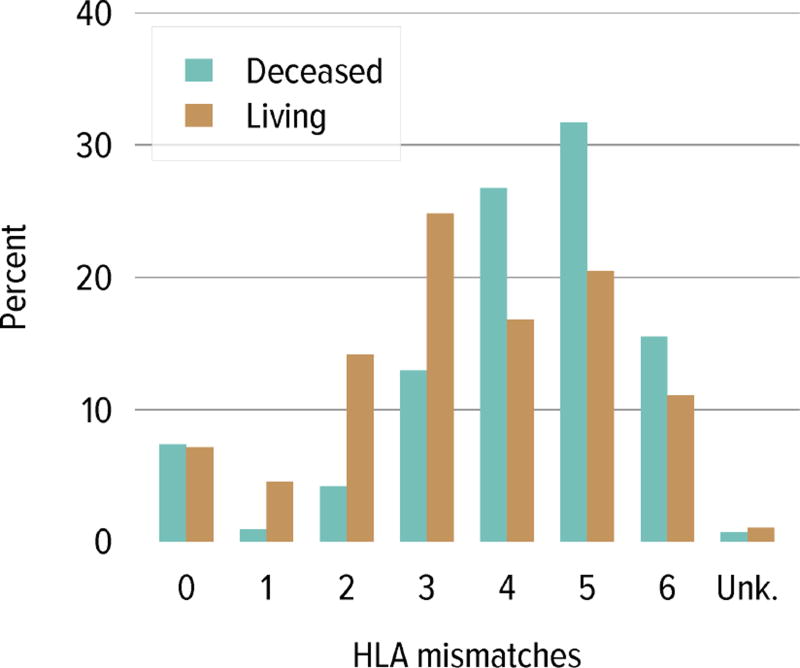
| HLA mismatches | 0 | 878 | 7.4 | 357 | 6.7 | 1,235 | 7.2 |
| 1 | 107 | 0.9 | 261 | 4.9 | 368 | 2.2 | |
| 2 | 535 | 4.5 | 722 | 13.6 | 1,257 | 7.4 | |
| 3 | 1,490 | 12.6 | 1,230 | 23.2 | 2,720 | 15.9 | |
| 4 | 3,170 | 26.8 | 889 | 16.8 | 4,059 | 23.7 | |
| 5 | 3,674 | 31.1 | 1,137 | 21.5 | 4,811 | 28.1 | |
| 6 | 1,889 | 16.0 | 599 | 11.3 | 2,488 | 14.6 | |
| Unknown | 64 | 0.5 | 96 | 1.8 | 160 | 0.9 | |
|
| |||||||
| Kidney transplant history | First transplant | 10,379 | 87.9 | 4,707 | 89.0 | 15,086 | 88.2 |
| Retransplant | 1,428 | 12.1 | 584 | 11.0 | 2,012 | 11.8 | |
|
| |||||||
| DCD status* | DBD | 9,791 | 82.9 | ||||
| DCD | 2,016 | 17.1 | |||||
|
| |||||||
| KDPI* | ≤20% | 2,529 | 21.4 | ||||
| 21–34% | 1,842 | 15.6 | |||||
| 35–85% | 6,116 | 51.8 | |||||
| > 85% | 965 | 8.2 | |||||
| Unknown | 355 | 3.0 | |||||
|
| |||||||
| All recipients | 11,807 | 100.0 | |||||
CKD, cystic kidney disease; DCD, donation after circulatory death; GN, glomerulonephritis; KDPI, kidney donor profile index; RRT, renal replacement therapy.
DCD status and KDPI scores apply to deceased donor transplants only.
Immunosuppressive medication use has continued to evolve over the past decade, with more recipients receiving induction therapy with T-cell depleting agents and 92.3% receiving tacrolimus, compared with 2.4% receiving cyclosporine. Seventy percent of recipients were on corticosteroids at 1 year posttransplant, a decrease from 81.6% in 2003 (Figure KI 4.4).
Figure KI 4.4. Immunosuppression in adult kidney transplant recipients.
One-year posttransplant data are limited to patients alive with graft function at 1 year posttransplant. Mycophenolate includes mycophenolate mofetil and mycophenolate sodium. IL2-RA, interleukin-2 receptor antagonist; mTOR, mammalian target of rapamycin.
Outcomes
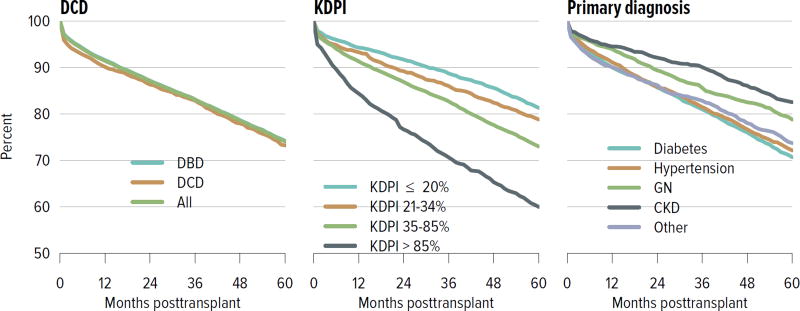
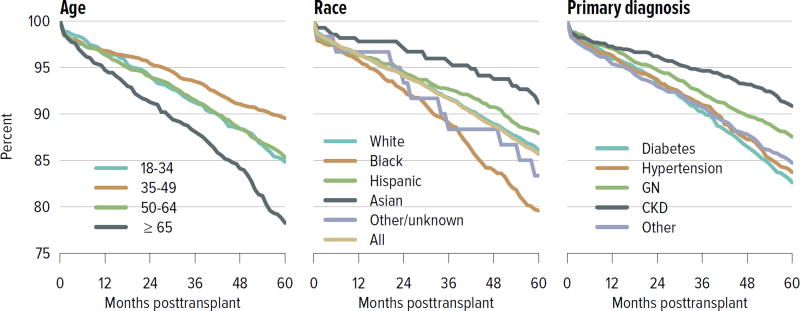
For both deceased donor and living donor transplants, rates of death-censored graft failure improved steadily over the past decade; 5-year all-cause graft failure rates were 26.5% for deceased donor transplants and 14.3% for living donor transplants. Rates of death with a functioning graft have remained the same or slightly increased at 10 years for both deceased and living donor transplants, which may reflect a higher rate of transplants in older recipients who are more likely to die before graft failure (Figure KI 5.1, Figure KI 5.2). Of particular interest under the new allocation system will be how kidneys with the highest KDPI compare to expanded criteria donor kidneys; 5-year graft survival was substantially lower for the highest KDPI group of greater than 85%, at 60.0%, compared with 81.3% for the lowest KDPI group of 20% or less. Graft survival also differed by primary diagnosis; recipients with cystic kidney disease and glomerulonephritis had better graft survival at 5 years than those with hypertension or diabetes as a cause of kidney failure (Figure KI 5.3). Among living donors, 5-year graft survival differed by recipient age and primary diagnosis. In addition, race continued to play a role; graft survival was worse for black recipients and best for Asian recipients (Figure KI 5.4).
Figure KI 5.1. Outcomes among adult kidney transplant recipients: deceased donor.
Percentage for each outcome is unadjusted, computed using Kaplan-Meier competing risk methods. Death with function (DWF) is defined as no graft failure before death; death-censored graft failure (DCGF) is defined as return to dialysis or retransplant; all-cause graft failure (GF) is defined as any graft failure.
Figure KI 5.2. Outcomes among adult kidney transplant recipients: living donor.
Percentage for each outcome is unadjusted, computed using Kaplan-Meier competing risk methods. Death with function (DWF) is defined as no graft failure before death; death-censored graft failure (DCGF) is defined as return to dialysis or retransplant; all-cause graft failure (GF) is defined as any graft failure.
Figure KI 5.3. Graft survival among adult kidney transplant recipients, 2009: deceased donors.
Graft survival estimated using unadjusted Kaplan-Meier methods. CKD, cystic kidney disease; DCD, donation after circulatory death; GN, glomerulonephritis; KDPI, kidney donor profile index.
Figure KI 5.4. Graft survival among adult kidney transplant recipients, 2009: living donors.
Graft survival estimated using unadjusted Kaplan-Meier methods. CKD, cystic kidney disease; GN, glomerulonephritis.
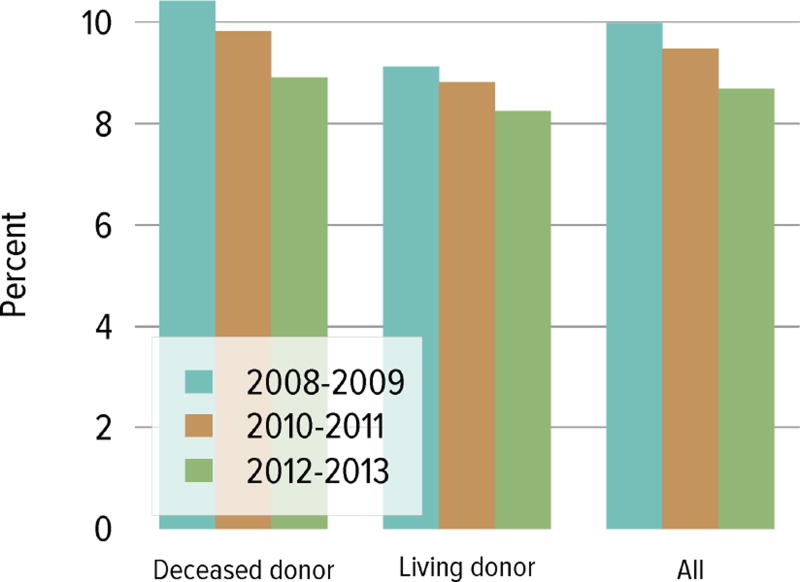
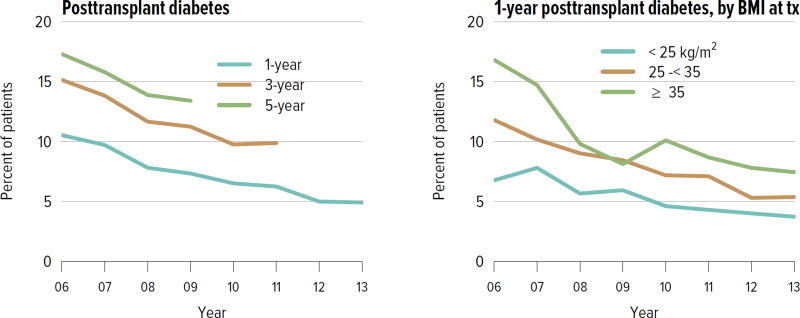
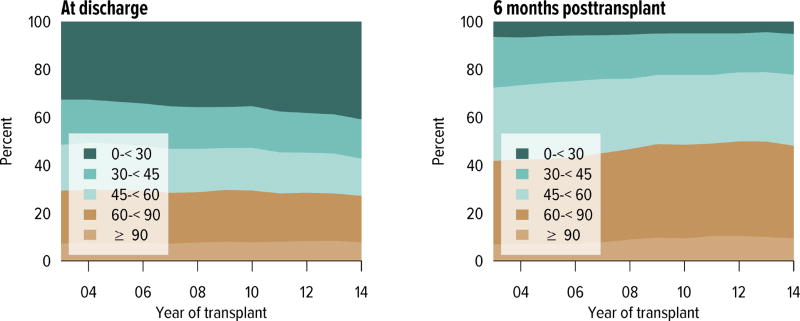
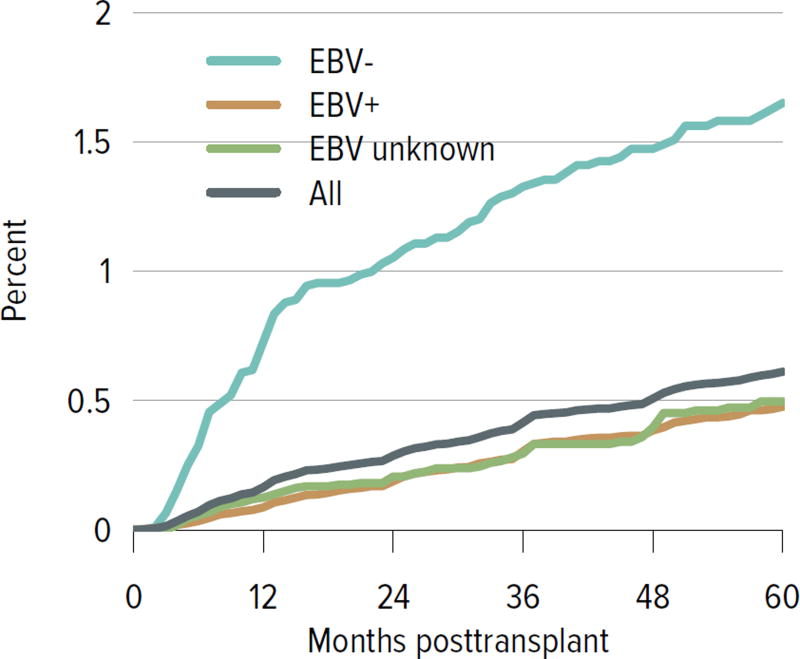
Rates of acute rejection in the first year posttransplant have improved consistently since 2008 and have been similar for deceased donor and living donor recipients (Figure KI 5.6). Rates of posttransplant diabetes have also improved, including rates at 1 year for recipients with BMI 35 kg/m2 or higher at the time of transplant (Figure KI 5.7). The incidence of posttransplant lymphoproliferative disorder (PTLD) at 5 years remained highest for recipients who were Epstein-Barr virus (EBV) negative at the time of transplant, 1.7% compared with 0.5% for those who were EBV positive. Finally, the percentage of recipients with an estimated glomerular filtration rate (eGFR) of 60 mL/min/1.73 m2 or higher at 6 months increased from 42.4% in 2004 to 48.2% in 2014 (Figure KI 5.9).
Figure KI 5.6. Incidence of acute rejection in year 1 posttransplant among adult kidney transplant recipients.
Acute rejection is defined as a record of acute or hyperacute rejection, as reported on the OPTN Transplant Recipient Registration or Transplant Recipient Follow-up Form. Only the first rejection event is counted. Cumulative incidence is estimated using the Kaplan-Meier competing risk method.
Figure KI 5.7. Posttransplant diabetes among adult kidney transplant recipients.
Percentage of adult deceased donor kidney recipients who were free of diabetes at transplant and developed diabetes posttransplant. Posttransplant diabetes is reported on the Transplant Recipient Follow-up Form. Death and graft failure are treated as competing events.
Figure KI 5.9. Distribution of eGFR at discharge and at 6 months posttransplant among adult kidney transplant recipients.
GFR (mL/min/1.73 m2) estimated using the Chronic Kidney Disease Epidemioogy Collaboration equation, and computed for patients alive with graft function at the given time point.
Pediatric Kidney Transplant
Waiting List
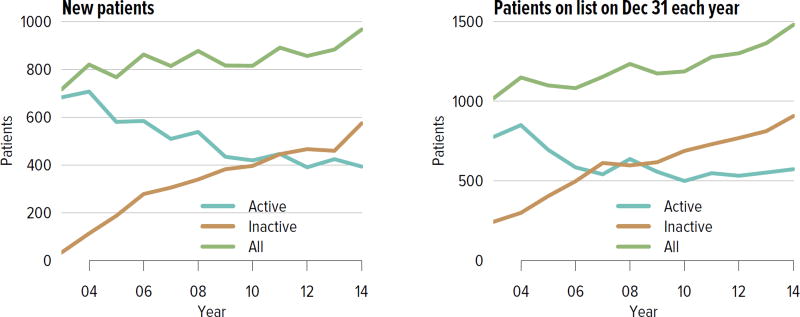
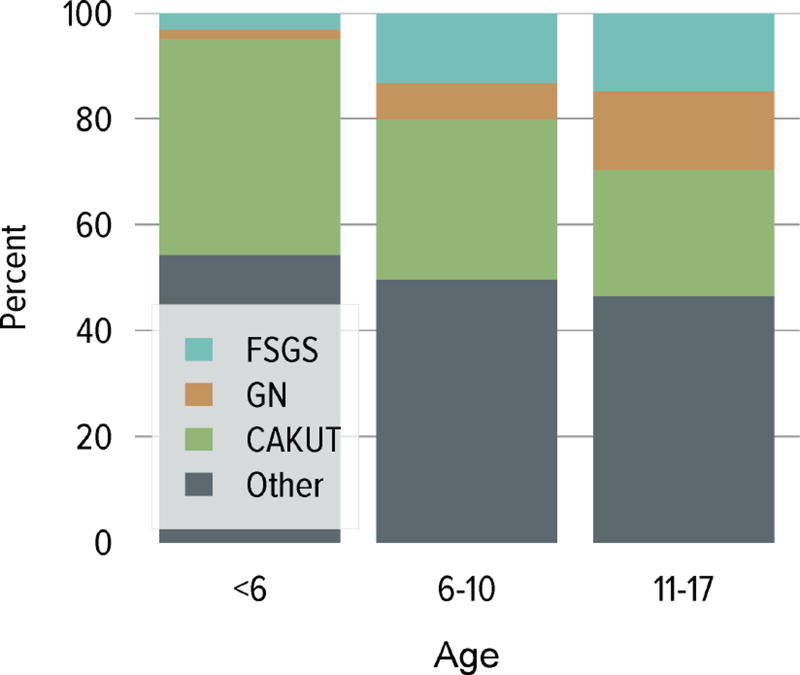
In 2014, 967 pediatric candidates were added to the kidney transplant waiting list; 60% were added as inactive (Figure KI 6.1). The number of prevalent pediatric candidates on the waiting list has been slowly increasing and reached 1480 on December 31, 2014. The most common reason for inactive status among newly listed candidates in 2014 was incomplete work-up (60.3%). In contrast, the most common reasons among candidates who were active at listing but were inactive at the end of the year were too sick to undergo transplant (27.7%), too well to require transplant (20.5%), incomplete work-up (17.5%), and medical noncompliance (13.3%) (Table KI 6.1). The largest proportion of waitlisted pediatric candidates in 2014 were adolescents (aged 11 to 17 years, 68.4%), followed by ages 1 to 5 (16.3%) and 6 to 10 years (14.3%) (Figure KI 6.2). From 2004 to 2014, the age distribution shifted toward a lower proportion of adolescent candidates (49.6% in 2004, 37.8% in 2014) (Table KI 6.2). Proportions with congenital anomalies of the kidney and urinary tract (CAKUT) as primary cause of disease increased from 25.7% on December 31, 2004, to 32.6% on December 31, 2014, and glomerulonephritis decreased from 15.1% to 10.7%. Regarding sensitization, most candidates (66.1%) had a CPRA of less than 20%, and 20% had a CPRA of greater than 80%. Multi-organ listing was uncommon; only 1.8% of pediatric candidates were awaiting multi-organ transplant in 2014. The leading cause of end-stage kidney disease changed with age; CAKUT was most common in children aged younger than 6 years, while focal segmental glomerulosclerosis and glomerulonephritis were more common in older children (Figure KI 6.3).
Figure KI 6.1. Pediatric candidates waiting for kidney transplant.
Candidates concurrently listed at multiple centers are counted once. Candidates who are active at at least one program are considered active; otherwise they are inactive. Active status is determined on day 7 after first listing. A new patient is one who first joined the list during the given year without ever listing in a prior year, or one who listed and underwent transplant in a prior year and relisted in the given year. Patients on the list on December 31 were pediatric at listing.
Table KI 6.1. Reasons for inactive status among pediatric kidney transplant listings, 2014.
As candidates can be concurrently listed at more than one center and reasons for inactive status may differ, each listing is counted separately.
| Inactive 7 days after listing |
Active at listing, inactive on Dec 31 |
|||
|---|---|---|---|---|
| Reasons for inactive status | N | % | N | % |
| Candidate work-up incomplete | 359 | 60.3 | 29 | 17.5 |
| Too well | 58 | 9.7 | 34 | 20.5 |
| Too sick | 49 | 8.2 | 46 | 27.7 |
| Candidate for LD transplant only | 48 | 8.1 | 2 | 1.2 |
| Candidate choice | 33 | 5.5 | 16 | 9.6 |
| Insurance issues | 16 | 2.7 | 8 | 4.8 |
| Weight inappropriate | 16 | 2.7 | 4 | 2.4 |
| Medical non-compliance | 10 | 1.7 | 22 | 13.3 |
| Transplant pending | 6 | 1.0 | 1 | 0.6 |
| Unknown | 0 | 0.0 | 2 | 1.2 |
| Candidate could not be contacted | 0 | 0.0 | 1 | 0.6 |
| Inappropriate substance abuse | 0 | 0.0 | 1 | 0.6 |
LD, living donor.
Figure KI 6.2. Distribution of pediatric candidates waiting for kidney transplant.
Candidates waiting for transplant any time in the given year. Candidates listed concurrently at multiple centers are counted once. Age is determined at the later of listing date or January 1 of the given year. Time on the waiting list is determined at the earlier of December 31 or removal from the waiting list. Diagnosis categories follow North American Pediatric Renal Trials and Collaborative Studies recommendations. PRA is the highest value during the year. Active and inactive patients are included. FSGS, focal segmental glomerulosclerosis; GN, glomerulonephritis; CAKUT, congenital anomalies of the kidney and urinary tract.
Table KI 6.2. Characteristics of pediatric candidates on the kidney transplant waiting list on December 31, 2004 and December 31, 2014.
Candidates aged younger than 18 years at listing waiting for transplant on December 31, 2004, and December 31, 2014, regardless of first listing date; multiple listings are not counted. In 2014, 37.8% were adults on December 31.
| 2004 | 2014 | ||||
|---|---|---|---|---|---|
|
|
|||||
| N | % | N | % | ||
| Age | < 1 | 4 | 0.3 | 3 | 0.2 |
| 1–5 | 96 | 8.4 | 222 | 15.0 | |
| 6–10 | 130 | 11.3 | 188 | 12.7 | |
| 11–17 | 570 | 49.6 | 559 | 37.8 | |
| ≥18 | 349 | 30.4 | 508 | 34.3 | |
|
| |||||
| Sex | Female | 475 | 41.3 | 623 | 42.1 |
| Male | 674 | 58.7 | 857 | 57.9 | |
|
| |||||
| Race | White | 458 | 39.9 | 572 | 38.6 |
| Black | 327 | 28.5 | 362 | 24.5 | |
| Hispanic | 290 | 25.2 | 451 | 30.5 | |
| Asian | 51 | 4.4 | 67 | 4.5 | |
| Other/unknown | 23 | 2.0 | 28 | 1.9 | |
|
| |||||
| Citizenship | US citizen | 1,045 | 90.9 | 1,380 | 93.2 |
| Non-citizen resident | 64 | 5.6 | 20 | 1.4 | |
| Non-citizen non-resident | 29 | 2.5 | 9 | 0.6 | |
| Other/unknown | 11 | 1.0 | 71 | 4.8 | |
|
| |||||
| Primary diagnosis | FSGS | 161 | 14.0 | 181 | 12.2 |
| GN | 173 | 15.1 | 158 | 10.7 | |
| CAKUT | 295 | 25.7 | 483 | 32.6 | |
| Other | 520 | 45.3 | 658 | 44.5 | |
|
| |||||
| Kidney transplant history | First transplant | 779 | 67.8 | 1,076 | 72.7 |
| Retransplant | 370 | 32.2 | 404 | 27.3 | |
|
| |||||
| Blood type | A | 341 | 29.7 | 446 | 30.1 |
| B | 180 | 15.7 | 246 | 16.6 | |
| AB | 31 | 2.7 | 39 | 2.6 | |
| O | 597 | 52.0 | 749 | 50.6 | |
|
| |||||
| PRA/CPRA | < 1% | 567 | 49.3 | 873 | 59.0 |
| 1–< 20% | 173 | 15.1 | 105 | 7.1 | |
| 20–< 80% | 145 | 12.6 | 195 | 13.2 | |
| 80–< 98% | 100 | 8.7 | 98 | 6.6 | |
| 98–100% | 115 | 10.0 | 198 | 13.4 | |
| Unknown | 49 | 4.3 | 11 | 0.7 | |
|
| |||||
| Waiting time | < 1 year | 550 | 47.9 | 618 | 41.8 |
| 1–< 2 years | 264 | 23.0 | 292 | 19.7 | |
| 2–< 3 years | 105 | 9.1 | 169 | 11.4 | |
| 3–< 4 years | 57 | 5.0 | 105 | 7.1 | |
| 4–< 5 years | 29 | 2.5 | 79 | 5.3 | |
| ≥ 5 years | 144 | 12.5 | 217 | 14.7 | |
|
| |||||
| Multi-organ | Kidney alone | 1,124 | 97.8 | 1,453 | 98.2 |
| Kidney-pancreas | 3 | 0.3 | 2 | 0.1 | |
| Kidney-liver | 15 | 1.3 | 18 | 1.2 | |
| Kidney-heart | 6 | 0.5 | 4 | 0.3 | |
| Other | 1 | 0.1 | 3 | 0.2 | |
|
| |||||
| All candidates | 1,149 | 100.0 | 1,480 | 100.0 | |
FSGS, focal segmental glomerulosclerosis; GN, glomerulonephritis; CAKUT, congenital anomalies of the kidney and urinary tract.
Figure KI 6.3. Primary cause of ESRD in pediatric candidates for kidney transplant, by age, 2010–2014.
Includes candidates first listed 2010–2014. Candidates concurrently listed at more than one center are counted once. Patients who were listed, underwent transplant, and were relisted during the time period are counted more than once. Age is computed at earliest listing date. FSGS, focal segmental glomerulosclerosis; GN, glomerulonephritis; CAKUT, congenital anomalies of the kidney and urinary tract.
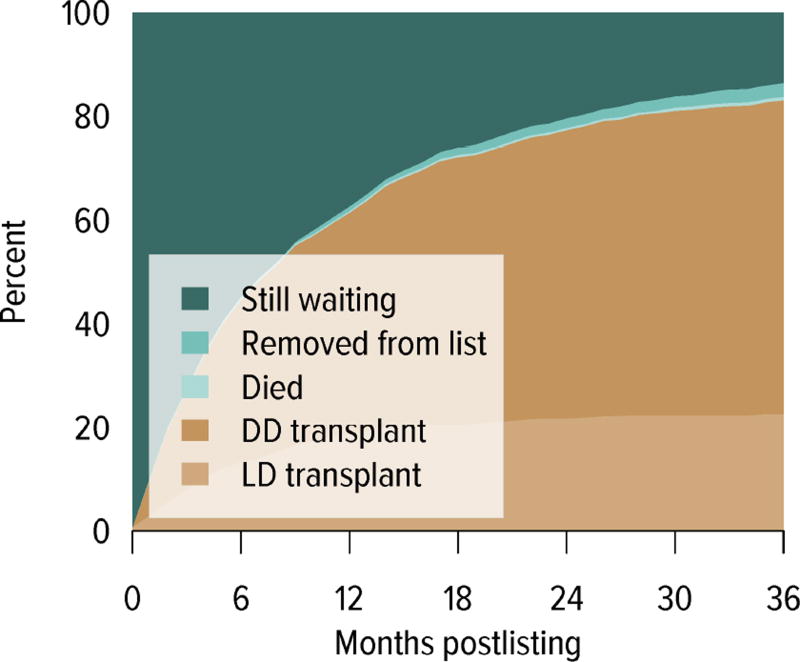
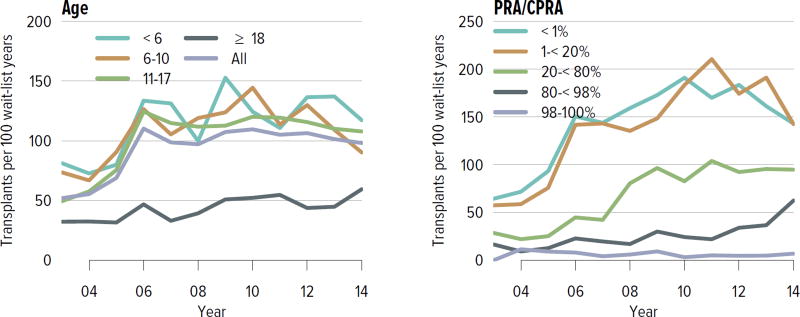
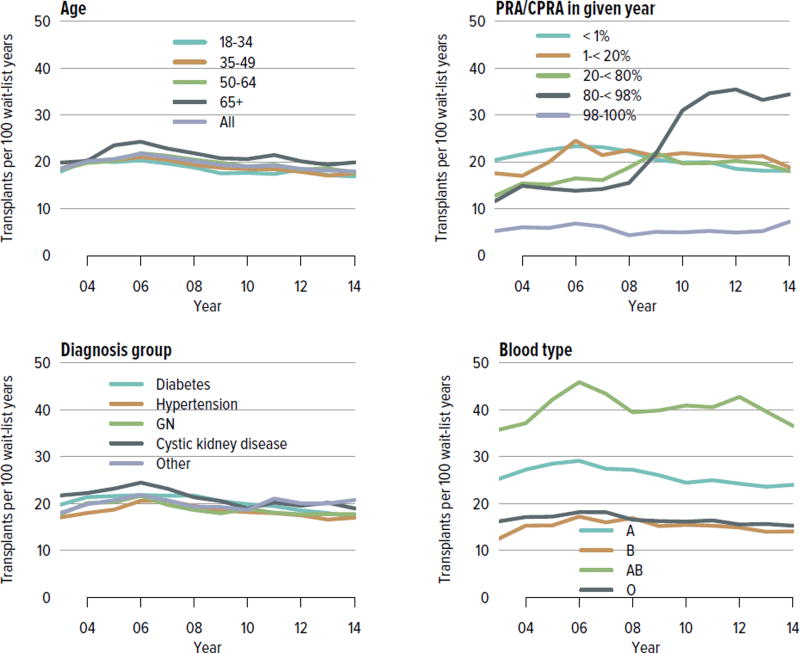
Of pediatric candidates removed from the waiting list in 2014, 65.1% received a deceased donor kidney, 27.0% received a living donor kidney, 2.5% died, 1.0% were considered too sick to undergo transplant, and 0.2% were removed from the list because their condition improved (Table KI 6.3). Just over 60% of patients newly listed in 2011 underwent deceased donor transplant within 3 years, 22.7% underwent living donor transplant, 0.7% died, 2.6% were removed from the list, and 13.7% were still waiting (Figure KI 6.4). The rate of deceased donor transplant in 2014 among pediatric waitlisted candidates was 98.2 per 100 active waitlist years (Figure KI 6.5), compared to 18.0 for adult candidates (Figure KI 1.4). The intent of the new kidney allocation system is to maintain this high level of access to transplant for pediatric patients. Transplant rates varied by age; the highest rate was for candidates aged younger than 6 years, at 117 per 100 active waitlist years. Rates also varied by CPRA, ranging from 143.0 per 100 active waitlist years for candidates with a CPRA of less than 1% to only 6.9 for those with a CPRA of 98% or higher. In contrast to mortality among candidates waiting for other organs, pretransplant mortality among pediatric candidates waiting for kidney transplant was low: 1.3 per 100 waitlist years in 2013–2014 (Figure KI 6.6).
Table KI 6.3. Kidney transplant waitlist activity among pediatric candidates.
Candidates concurrently listed at more than one center are counted once, from the time of earliest listing to the time of latest removal. Candidates who are listed, undergo transplant, and are relisted are counted more than once. Candidates are not considered to be on the list on the day they are removed; counts on January 1 may differ from counts on December 31 of the prior year. Candidates listed for multi-organ transplants are included.
| 2012 | 2013 | 2014 | |
|---|---|---|---|
| Patients at start of year | 1,278 | 1,301 | 1,361 |
| Patients added during year | 884 | 907 | 1,002 |
| Patients removed during year | 861 | 844 | 883 |
| Patients at end of year | 1,301 | 1,364 | 1,480 |
| Removal reason | |||
| Deceased donor transplant | 562 | 557 | 575 |
| Living donor transplant | 212 | 217 | 238 |
| Transplant (type unspecified) | 2 | 0 | 0 |
| Patient died | 22 | 15 | 22 |
| Patient refused transplant | 2 | 0 | 2 |
| Improved, transplant not needed | 8 | 4 | 2 |
| Too sick for transplant | 5 | 8 | 8 |
| Other | 48 | 43 | 36 |
Figure KI 6.4. Three-year outcomes for pediatric candidates waiting for kidney transplant, new listings in 2011.
Candidates waiting for any kidney transplant and first listed in 2011. Candidates concurrently listed at more than one center are counted once, from the time of earliest listing to the time of latest removal. DD, deceased donor; LD living donor.
Figure KI 6.5. Deceased donor kidney transplant rates among active pediatric waitlist candidates.
Transplant rates are computed as the number of deceased donor transplants per 100 patient-years of active waiting in a given year. Individual listings are counted separately. Rates with less than 10 patient-years of exposure are not shown. Rates by PRA/CPRA at computed in a time-dependent manner. The age category 18 years or older includes candidates listed when aged younger than 18 years but still on the list in the given year.
Figure KI 1.4. Deceased donor kidney transplant rates among active adult waitlist candidates.
Transplant rates are computed as the number of deceased donor transplants per 100 patient-years of active waiting in a given year. Individual listings are counted separately. Rates with less than 10 patient-years of exposure are not shown. Rates by PRA/CPRA are computed in a time-dependent manner. GN, glomerulonephritis.
Figure KI 6.6. Pretransplant mortality rates among pediatric kidney transplant candidates.
Mortality rates are computed as the number of deaths per 100 patient-years of waiting in the given year. Individual listings are counted separately. Age is determined at the later of listing date or January 1 of the given year.
Transplant
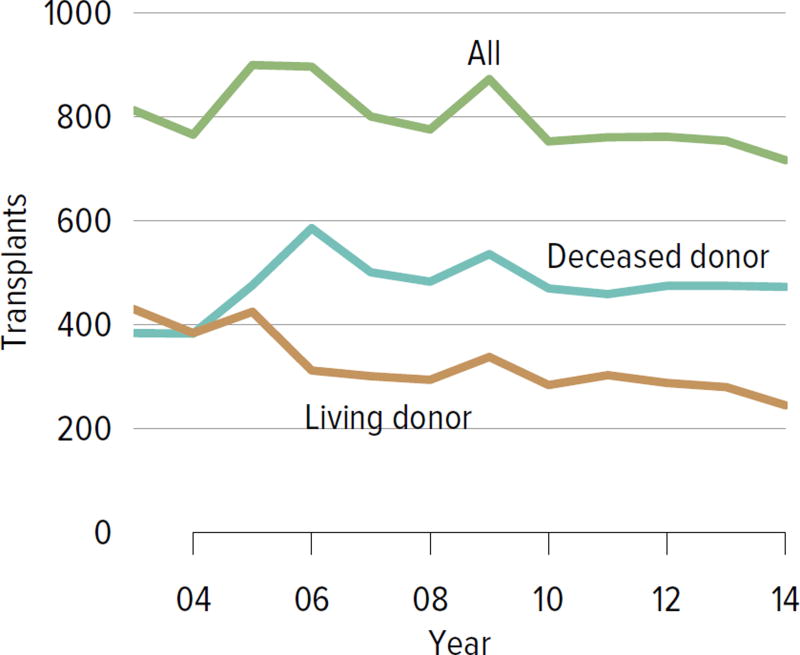
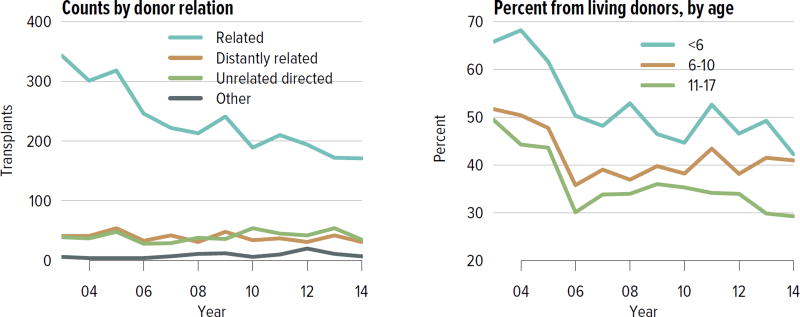
The number of pediatric kidney transplants peaked in 2005 at 899, was approximately 750 between 2010 and 2013, and decreased to 716 in 2014 (Figure KI 6.7). The number of deceased donor transplants has exceeded the number of living donor transplants since 2005; in 2014 these numbers were 472 and 244, respectively. Just over 40% of recipients aged younger than 6 and 6 to 10 years underwent living donor transplant in 2014, compared with only 29.3% of those aged 11 to 17 years (Figure KI 6.8).
Figure KI 6.7. Pediatric kidney transplants, by donor type.
All pediatric kidney transplant recipients, including retransplant, and multi-organ recipients.
Figure KI 6.8. Pediatric kidney transplants from living donors.
Relationship of living donor to recipient is as indicated on the OPTN Living Donor Registration Form.
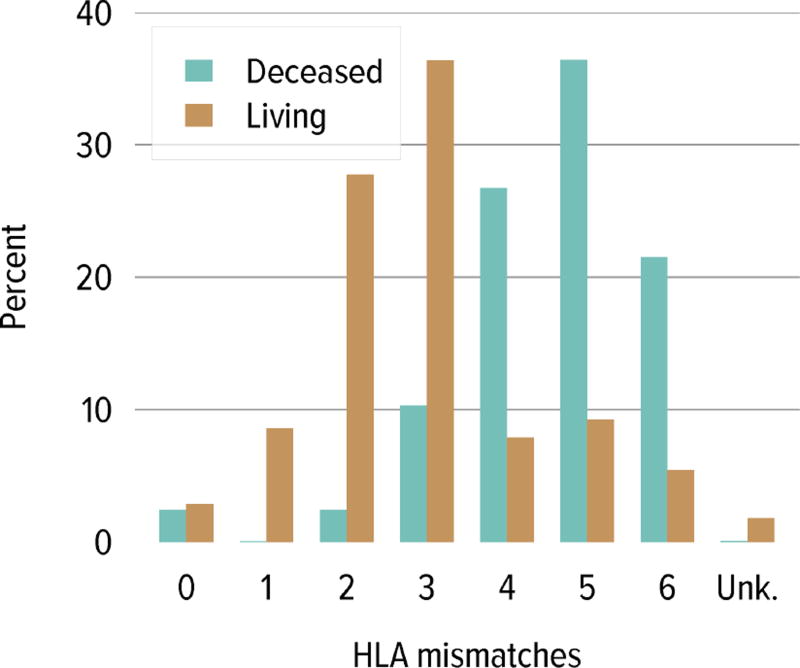
Regarding donor source and age at transplant, a higher proportion of living donor transplants were in recipients aged 1 to 5 years; this group accounted for 30.4% of pediatric living donor transplants and 20.2% of pediatric deceased donor transplants, compared with 20.5% and 17.6%, respectively, for recipients aged 6 to 10 years. A higher proportion of deceased donor transplants were in recipients aged 11 to 17 years (62.0% vs. 48.8%) (Table KI 6.4). The racial distribution differed among deceased and living donor transplant recipients. A higher proportion of living donor recipients were white (72.1% vs. 39.1%) and a higher proportion of deceased donor recipients were black (24.2% vs. 7.7%) and Hispanic (29.8% vs. 14.9%). Private insurance was more common among living donor recipients and Medicare/Medicaid was more common among deceased donor recipients. Most deceased donor recipients (63.9%) underwent transplant with a kidney from a donor with KPDI less than 20%; these kidneys are expected to last the longest. ABO incompatible transplants remained uncommon in pediatric kidney recipients, less than 1%. The number of HLA mismatches was higher among deceased donor recipients than among living donor recipients; 83.5% of deceased donor recipients and 22.2% of living donor recipients had more than three HLA mismatches in 2012–2014.
Table KI 6.4. Characteristics of pediatric kidney transplant recipients, 2012–2014.
Kidney transplant recipients, including retransplants. Diagnosis categories follow North American Pediatric Renal Trials and Collaborative Studies recommendations.
| Deceased | Living | All | |||||
|---|---|---|---|---|---|---|---|
|
|
|||||||
| N | % | N | % | N | % | ||
| Age | < 1 | 2 | 0.1 | 3 | 0.4 | 5 | 0.2 |
| 1–5 | 287 | 20.2 | 246 | 30.4 | 533 | 23.9 | |
| 6–10 | 250 | 17.6 | 166 | 20.5 | 416 | 18.7 | |
| 11–17 | 881 | 62.0 | 395 | 48.8 | 1,276 | 57.2 | |
|
| |||||||
| Sex | Female | 592 | 41.7 | 320 | 39.5 | 912 | 40.9 |
| Male | 828 | 58.3 | 490 | 60.5 | 1,318 | 59.1 | |
|
| |||||||
| Race | White | 555 | 39.1 | 584 | 72.1 | 1,139 | 51.1 |
| Black | 343 | 24.2 | 62 | 7.7 | 405 | 18.2 | |
| Hispanic | 423 | 29.8 | 121 | 14.9 | 544 | 24.4 | |
| Asian | 63 | 4.4 | 27 | 3.3 | 90 | 4.0 | |
| Other/unknown | 36 | 2.5 | 16 | 2.0 | 52 | 2.3 | |
|
| |||||||
| Primary diagnosis | FSGS | 169 | 11.9 | 81 | 10.0 | 250 | 11.2 |
| GN | 167 | 11.8 | 72 | 8.9 | 239 | 10.7 | |
| CAKUT | 492 | 34.6 | 300 | 37.0 | 792 | 35.5 | |
| Other | 592 | 41.7 | 357 | 44.1 | 949 | 42.6 | |
|
| |||||||
| Blood type | A | 454 | 32.0 | 313 | 38.6 | 767 | 34.4 |
| B | 186 | 13.1 | 97 | 12.0 | 283 | 12.7 | |
| AB | 56 | 3.9 | 41 | 5.1 | 97 | 4.3 | |
| O | 724 | 51.0 | 359 | 44.3 | 1,083 | 48.6 | |
|
| |||||||
| PRA/CPRA | < 1% | 1,074 | 75.6 | 590 | 72.8 | 1,664 | 74.6 |
| 1–< 20% | 115 | 8.1 | 72 | 8.9 | 187 | 8.4 | |
| 20–< 80% | 169 | 11.9 | 86 | 10.6 | 255 | 11.4 | |
| 80–< 98% | 57 | 4.0 | 20 | 2.5 | 77 | 3.5 | |
| 98–100% | 5 | 0.4 | 13 | 1.6 | 18 | 0.8 | |
| Unknown | 0 | 0.0 | 29 | 3.6 | 29 | 1.3 | |
|
| |||||||
| History of RRT | Preemptive transplant | 377 | 26.5 | 313 | 38.6 | 690 | 30.9 |
| < 1 year | 319 | 22.5 | 244 | 30.1 | 563 | 25.2 | |
| < 3 years | 453 | 31.9 | 158 | 19.5 | 611 | 27.4 | |
| < 5 years | 137 | 9.6 | 31 | 3.8 | 168 | 7.5 | |
| ≥ 5 years | 134 | 9.4 | 64 | 7.9 | 198 | 8.9 | |
|
| |||||||
| Insurance | Private | 409 | 28.8 | 485 | 59.9 | 894 | 40.1 |
| Medicare | 477 | 33.6 | 162 | 20.0 | 639 | 28.7 | |
| Medicaid | 419 | 29.5 | 120 | 14.8 | 539 | 24.2 | |
| Other government | 96 | 6.8 | 23 | 2.8 | 119 | 5.3 | |
| Other/unknown | 19 | 1.3 | 20 | 2.5 | 39 | 1.7 | |
|
| |||||||
| HLA mismatches | 0 | 43 | 3.0 | 25 | 3.1 | 68 | 3.0 |
| 1 | 1 | 0.1 | 76 | 9.4 | 77 | 3.5 | |
| 2 | 41 | 2.9 | 215 | 26.5 | 256 | 11.5 | |
| 3 | 148 | 10.4 | 297 | 36.7 | 445 | 20.0 | |
| 4 | 395 | 27.8 | 63 | 7.8 | 458 | 20.5 | |
| 5 | 502 | 35.4 | 77 | 9.5 | 579 | 26.0 | |
| 6 | 289 | 20.4 | 40 | 4.9 | 329 | 14.8 | |
| Unknown | 1 | 0.1 | 17 | 2.1 | 18 | 0.8 | |
|
| |||||||
| Kidney transplant history | First transplant | 1,298 | 91.4 | 746 | 92.1 | 2,044 | 91.7 |
| Retransplant | 122 | 8.6 | 64 | 7.9 | 186 | 8.3 | |
|
| |||||||
| DCD status* | DBD | 1,351 | 95.1 | ||||
| DCD | 69 | 4.9 | |||||
|
| |||||||
| KDPI* | ≤ 20% | 907 | 63.9 | ||||
| 21–34% | 266 | 18.7 | |||||
| 35–85% | 220 | 15.5 | |||||
| > 85% | 0 | 0.0 | |||||
| Unknown | 27 | 1.9 | |||||
|
| |||||||
| Delayed graft function | Non-DGF | 1,325 | 93.3 | 777 | 95.9 | 2,102 | 94.3 |
| DGF | 95 | 6.7 | 33 | 4.1 | 128 | 5.7 | |
|
| |||||||
| ABO compatibility | Compatible/identical | 1,420 | 100.0 | 805 | 99.4 | 2,225 | 99.8 |
| Incompatible | 0 | 0.0 | 5 | 0.6 | 5 | 0.2 | |
|
| |||||||
| All recipients | 1,420 | 100.0 | 810 | 100.0 | 2,230 | 100.0 | |
FSGS, focal segmental glomerulosclerosis; GN, glomerulonephritis; CAKUT, congenital anomalies of the kidney and urinary tract; RRT, renal replacement therapy; KDPI, kidney donor profile index.
DCD status and KDPI scores apply to deceased donor transplants only.
The combination of a donor who was positive for cytomegalovirus and a pediatric recipient who was negative occurred in 34.8% of deceased donor transplants and in 29.2% of living donor transplants (Table KI 6.5). The combination of a donor who was positive for EBV and a recipient who was negative occurred in 36.9% of deceased donor transplants and in 43.1% of living donor transplants.
Table KI 6.5. Pediatric kidney donor-recipient serology matching, 2010–2014.
Donor serology is reported on the OPTN Donor Registration Form and recipient serology on the OPTN Transplant Recipient Registration Form. Any evidence for a positive serology is treated as positive for that serology. If all fields are unknown, incomplete, or pending, the person is categorized as unknown for that serology; otherwise, serology is assumed negative.
| Recipient − | Recipient + | Recipient unk. | ||||||||
|---|---|---|---|---|---|---|---|---|---|---|
|
|
||||||||||
| Donor | D− | D+ | D unk. | D− | D+ | D unk. | D− | D+ | D unk. | |
| CMV | Deceased | 25.0 | 34.8 | 0.3 | 16.4 | 21.7 | 0.3 | 0.5 | 1.0 | 0.0 |
| Living | 33.9 | 29.2 | 3.8 | 7.2 | 21.4 | 1.3 | 1.4 | 1.8 | 0.1 | |
|
| ||||||||||
| EBV | Deceased | 5.1 | 36.9 | 0.2 | 5.8 | 47.1 | 0.1 | 0.5 | 4.3 | 0.0 |
| Living | 6.7 | 43.1 | 5.3 | 2.9 | 32.5 | 3.1 | 0.6 | 4.2 | 1.5 | |
CMV, cytomegalovirus; EBV, Epstein-Barr virus.
Immunosuppressive Medication Use
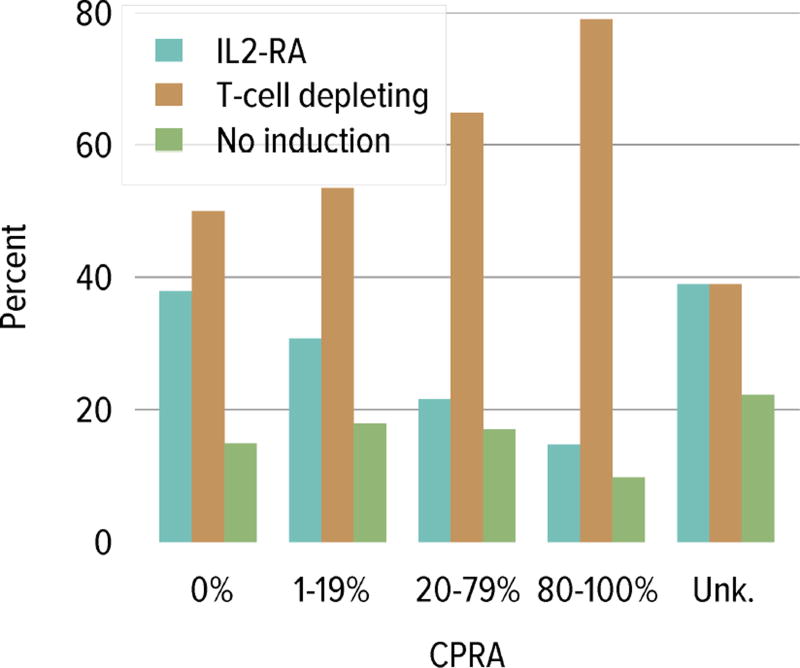
Trends in immunosuppressive medications used in children and adolescents were similar to trends for adults. In 2014, interleukin-2 receptor antagonist (IL-2-RA) therapy for induction was used in 35.8% and T-cell depleting agents in 57.0%. The percentage of recipients receiving no induction therapy continued to decline, reaching a low of 10.7% in 2014 (Figure KI 6.9). In 2014, tacrolimus was used as part of the initial maintenance immunosuppressive medication regimen in 95.0% of pediatric transplant recipients and mycophenolate in 94.9%. Mammalian target of rapamycin inhibitors were used in 5.3% of 2013 pediatric recipients at 1 year posttransplant. Corticosteroids were used in 61.4% of 2014 pediatric recipients at the time of transplant and in 64.7% of 2013 recipients at 1 year posttransplant. Regarding induction use by CPRA, T-cell depleting agents were more common with increasing CPRA and IL-2-RA use was more common with decreasing CPRA (Figure KI 6.10).
Figure KI 6.9. Immunosuppression in pediatric kidney transplant recipients.
One-year posttransplant data are limited to patients alive with graft function at 1 year posttransplant. Mycophenolate includes mycophenolate mofetil and mycophenolate sodium. IL2-RA, interleukin-2 receptor antagonist; mTor, mammalian target of rapamycin.
Figure KI 6.10. Induction use by CPRA among pediatric kidney transplant recipients, 2010–2014.
IL2-RA, interleukin-2 receptor antagonist.
Outcomes
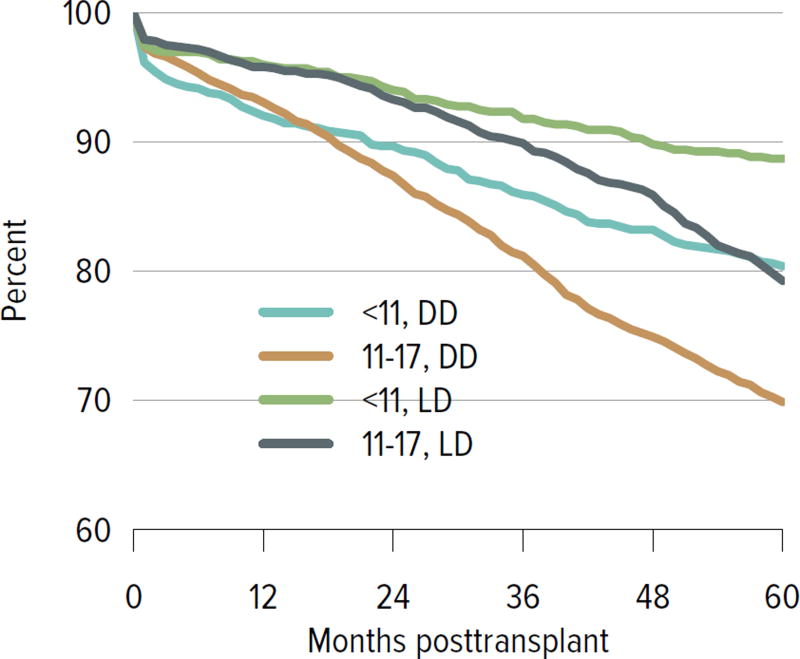
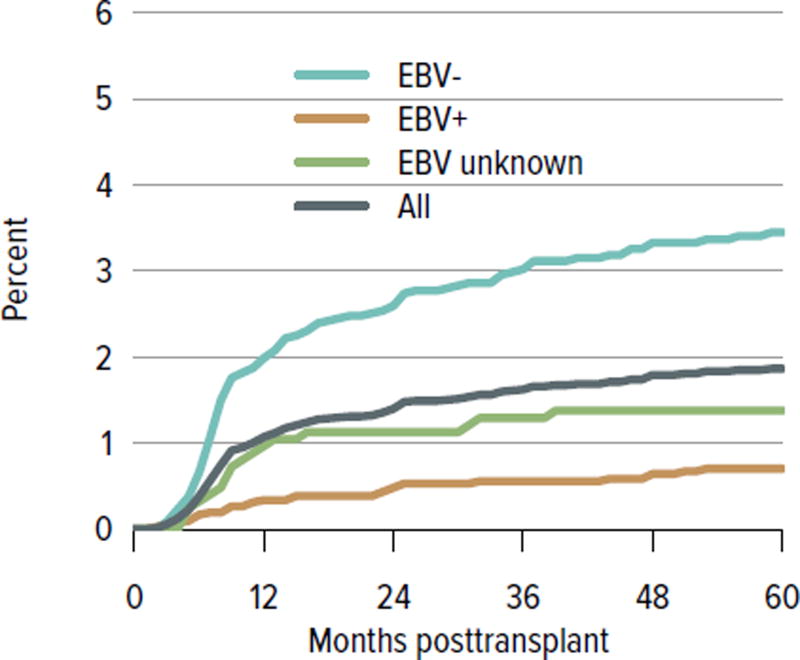
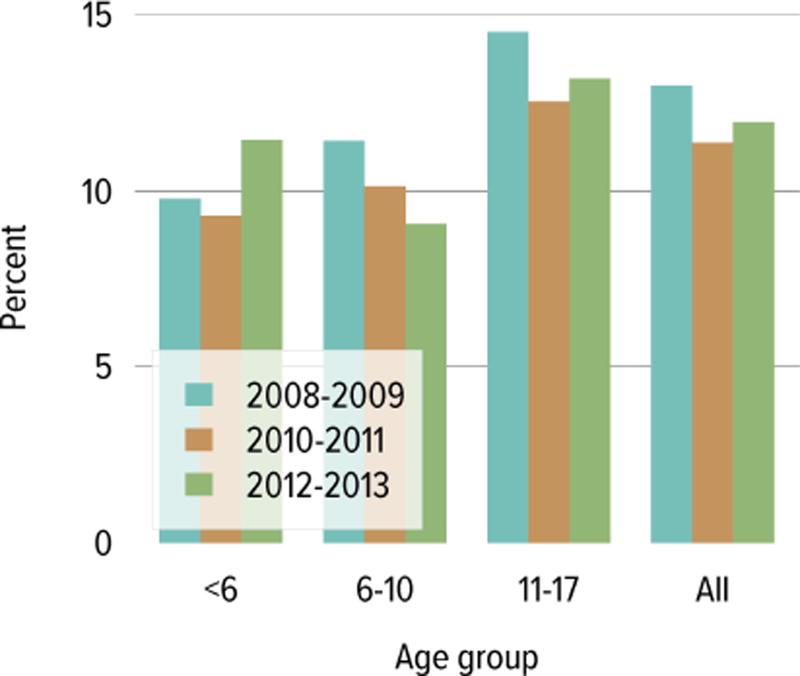
All-cause graft failure for deceased donor transplants was 3.2% at 6 months and 4.4% at 1 year for transplants in 2013–2014, 8.6% at 3 years for transplants in 2011–2012, 21.3% at 5 years for transplants in 2009–2010, and 51.2% at 10 years for transplants in 2003–2004 (Figure KI 6.12). Corresponding graft failure for living donor transplants was 2.7% at 6 months and 1 year for transplants in 2013–2014, 4.8% at 3 years for transplants in 2011–2012, 14.0% at 5 years for transplants in 2009–2010, and 34.1% at 10 years for transplants in 2003–2004 (Figure KI 6.13). For a cohort of recipients who underwent transplant 2005–2009, graft survival was highest for living donor recipients aged younger than 11 years (88.7% at 5 years) and lowest for deceased donor recipients aged 11 to 17 years (69.9% at 5 years) (Figure KI 6.14). The incidence of PTLD among EBV-negative recipients was 3.4% at 5 years posttransplant, compared with 0.7% among EBV-positive recipients (Figure KI 6.15). By age, incidence of reported acute rejection in the first posttransplant year was highest for recipients aged 11 to 17 years, at 13.2% for patients who underwent transplant in 2012–2013, compared with 11.5% among recipients aged younger than 6 years and 9% among recipients aged 6 to 10 years (Figure KI 6.16).
Figure KI 6.12. Outcomes among pediatric kidney-alone transplant recipients: deceased donor.
Percentage for each outcome is unadjusted, computed using Kaplan-Meier competing risk methods. Death with function (DWF) is defined as no graft failure before death; death-censored graft failure (DCGF) is defined as return to dialysis or retransplant; all-cause graft failure (GF) is defined as any graft failure.
Figure KI 6.13. Outcomes among pediatric kidney-alone transplant recipients: living donor.
Percentage for each outcome is unadjusted, computed using Kaplan-Meier competing risk methods. Death with function (DWF) is defined as no graft failure before death; death-censored graft failure (DCGF) is defined as return to dialysis or retransplant; all-cause graft failure (GF) is defined as any graft failure.
Figure KI 6.14. Graft survival among pediatric kidney transplant recipients, by age and donor type, 2005–2009.
Graft survival estimated using unadjusted Kaplan-Meier methods. DD, deceased donor; LD, living donor.
Figure KI 6.15. Incidence of PTLD among pediatric kidney transplant recipients, by recipient EBV status at transplant, 2002–2012.
Cumulative incidence is estimated using the Kaplan-Meier competing risk method. Posttransplant lymphoproliferative disorder (PTLD) is identified as a reported complication or cause of death on the OPTN Transplant Recipient Follow-up Form or on the Posttransplant Malignancy form as polymorphic PTLD, monomorphic PTLD, or Hodgkin disease. Only the earliest date of PTLD diagnosis is considered. EBV, Epstein-Barr virus.
Figure KI 6.16. Incidence of acute rejection in year 1 posttransplant among pediatric kidney transplant recipients, by age.
Acute rejection is defined as a record of acute or hyperacute rejection, as reported on the OPTN Transplant Recipient Registration Form or Transplant Recipient Follow-up Form. Only the first rejection event is counted. Cumulative incidence is estimated using the Kaplan-Meier competing risk method.
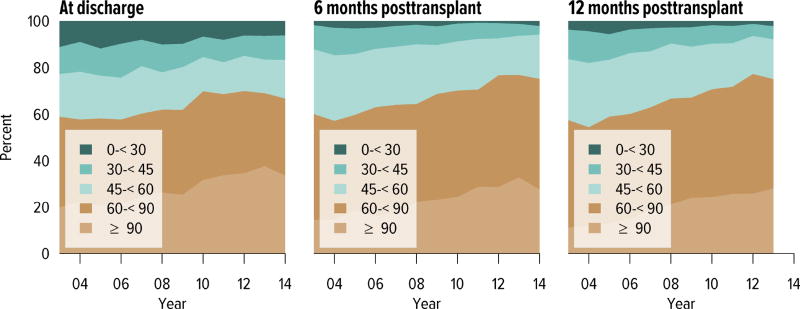
Short-term renal function, measured by eGFR, improved substantially over the past decade. The proportion of recipients with an eGFR of 90 mL/min/1.73 m2 or higher at discharge increased from 20.7% in 2005 to 33.8% in 2014; at 6 months posttransplant, from 18.5% to 27.8; and at 1 year posttransplant, from 13.0% to 28.1% (Figure KI 6.17). Of recipients in the 2013 cohort, 75.1% had chronic kidney disease stage 1–2 at 1 year posttransplant, with an eGFR of 60 mL/min/1.73 m2 or higher.
Figure KI 6.17. Distribution of eGFR at discharge and at 6 and 12 months posttransplant, among pediatric kidney-alone transplant recipients.
GFR (mL/min/1.73 m2) estimated using the bedside Schwartz equation, and computed for patients alive with graft function at the given time point. Equation: eGFR = 0.413*Height(cm)/Creatinine (mg/dL).
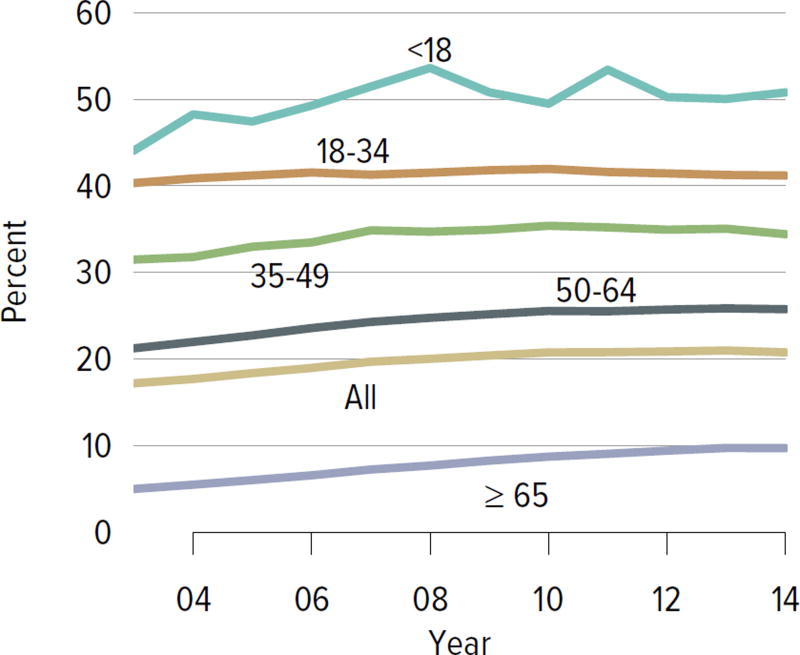
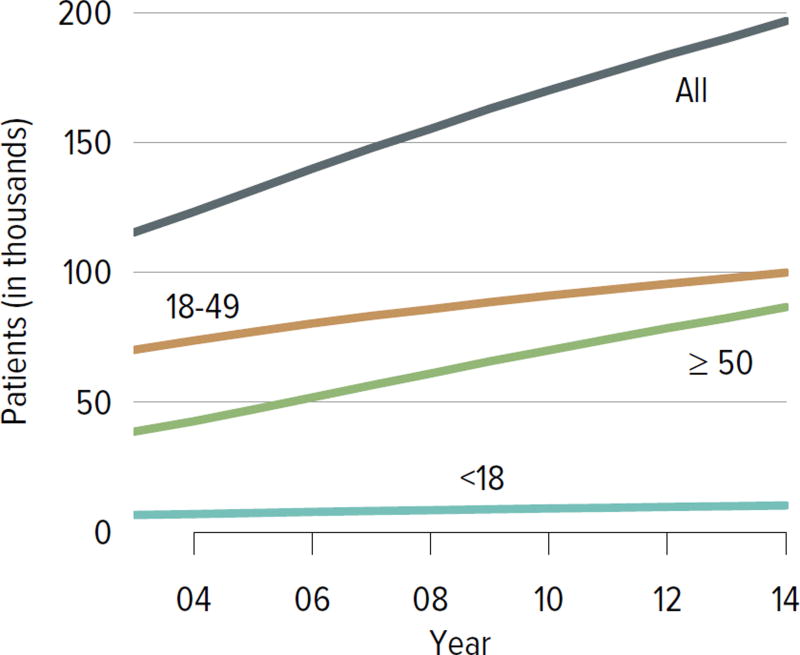
Figure KI 1.3. Prevalent dialysis patients waitlisted for kidney transplant, by age.
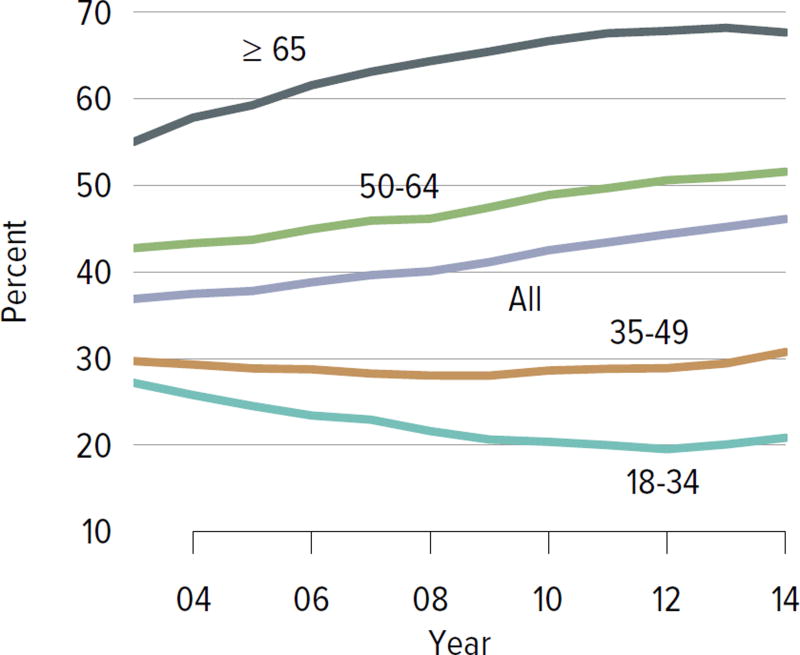
Estimated percentage of prevalent dialysis patients waitlisted for kidney-alone transplant. Percentage calculated as the sum of point prevalent waitlist candidates divided by the sum of point prevalent dialysis patients on December 31 of each year. Dialysis data from the Consolidated Renal Operations in a Web-enabled Network (CROWN) dataset. Age calculated on December 31 of given year.
Figure KI 1.8. Adults willing to accept an ECD kidney, by age.
Adults waiting for kidney transplant on December 31 of the given year. Candidates concurrently listed at more than one center are counted once, from the time of earliest listing to the time of latest removal. Candidates are considered willing to accept an ECD kidney if so identified in at least one listing. In 2014, willingness to accept an ECD kidney also included willingness to accept a kidney with kidney donor profile index > 85%.
Figure KI 2.3. Rates of organs recovered for transplant and not transplanted.
Percentages of kidneys not transplanted out of all kidneys recovered for transplant. Kidneys recoverd en-bloc are counted once, and kidneys recovered separately are counted twice. CNS, central nervous system; CVA, cerebrovascular accident.
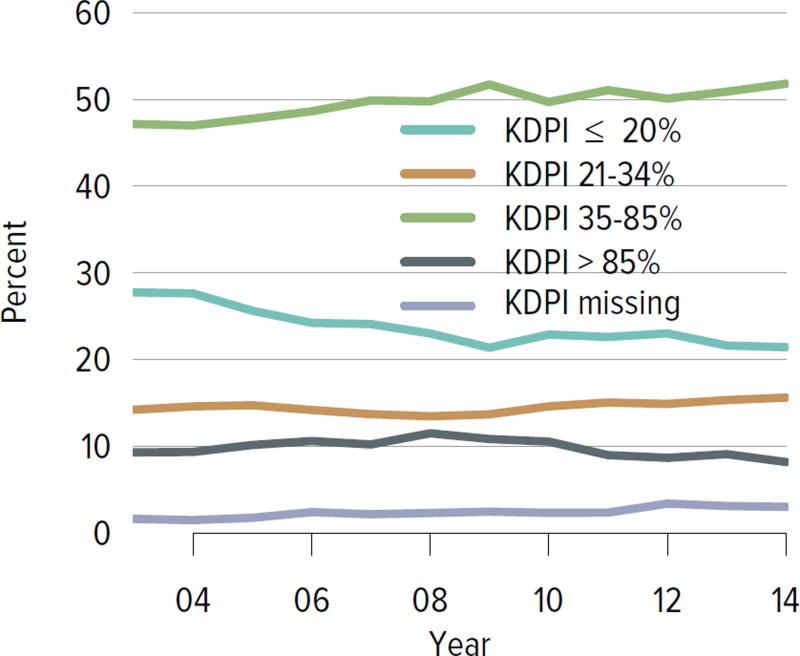
Figure KI 4.3. Kidney transplants by kidney donor profile index.
All adult recipients of deceased donor kidneys, including multi-organ transplants. The reference population for the KDRI to KDPI conversion is all deceased donor kidneys recovered for transplant in the US in 2014. Kidneys recovered en-bloc are counted once. KDPI, kidney donor profile index; KDRI, kidney donor risk index.
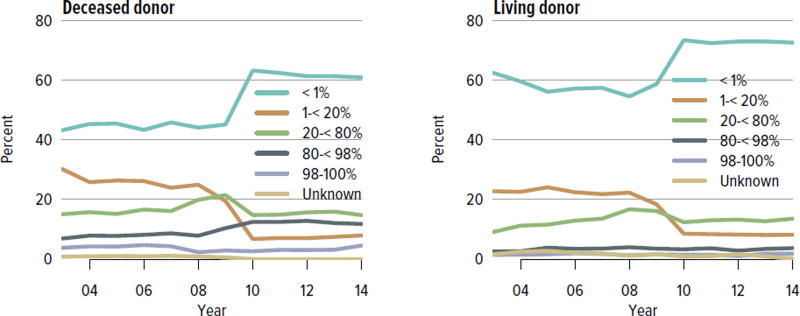
Figure KI 4.5. PRA at time of kidney transplant in adult recipients.
From December 1, 2007, through September 30, 2009, CPRA was used if greater than 0; otherwise, the maximum pretransplant PRA was used. Before December 1, 2007, the maximum pretransplant PRA was used unconditionally. CPRA is used after September 30, 2009, unless it is missing; if it is missing, the maximum pretransplant PRA is used. Kidney-alone transplants only.
Figure KI 4.6. Total HLA A, B, and DR mismatches among adult kidney transplant recipients, 2010–2014.
Donor and recipient antigen matching is based on OPTN antigen values and split equivalences policy as of 2014.
Figure KI 5.5. Recipients alive with a functioning kidney graft on June 30 of the year, by age at transplant.
Recipients are assumed to be alive with function unless a death or graft failure is recorded. A recipient may experience a graft failure and be removed from the cohort, undergo retransplant, and re-enter the cohort.
Figure KI 5.8. Incidence of PTLD among adult kidney transplant recipients, by recipient EBV status at transplant, 2008–2012.
Cumulative incidence is estimated using the Kaplan-Meier competing risk method. PTLD is identified as a reported complication or cause of death on the OPTN Transplant Recipient Follow-up Form or the Posttransplant Malignancy Form as polymorphic PTLD, monomorphic PTLD, or Hodgkin disease. Only the earliest date of PTLD diagnosis is considered. EBV, Epstein-Barr virus; PTLD, posttransplant lymphoproliferative disorder.
Figure KI 6.11. Total HLA A, B, and DR mismatches among pediatric kidney transplant recipients, 2010–2014.
Donor and recipient antigen matching is based on OPTN antigen values and split equivalences policy as of 2014.
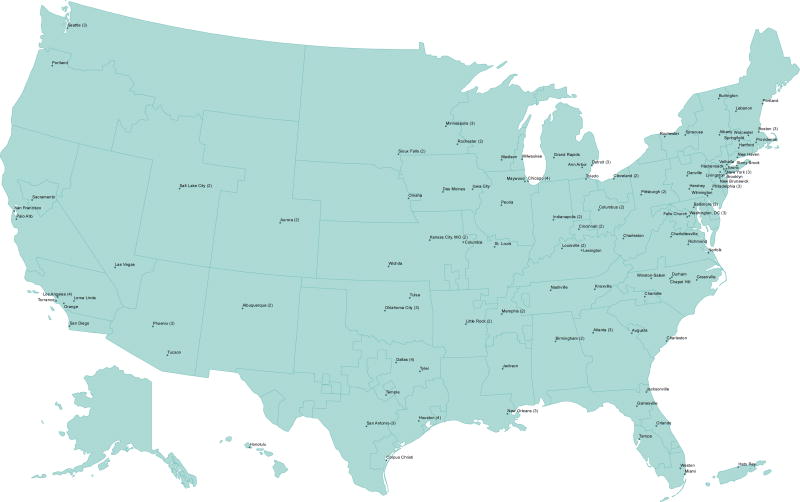
Figure KI 7.1. Centers performing adult transplants or listing active adult kidney candidates, within DSAs, 2012–2014.
Figure KI 7.2. Centers performing pediatric transplants or listing active pediatric kidney candidates, within DSAs, 2012–2014.
Table KI 4.2. Top 15 medications filled by adult kidney transplant recipients, 2010.
Adult kidney transplant recipients, 2010, who were matched to the IMS Health pharmacy claims database and had at least one medication filled during year 1 or year 2 posttransplant. Immunosuppression data may differ from data reported to OPTN due to different patient subsets and data sources.
| Medication | % in 1st yr posttransplant |
Medication | % in 2nd yr posttransplant |
|---|---|---|---|
| Mycophenolate | 54.0 | Mycophenolate | 39.9 |
| Tacrolimus | 52.8 | Tacrolimus | 39.7 |
| Sulfamethoxazole-Trimethoprim | 50.9 | Prednisone | 33.9 |
| Prednisone | 44.3 | Amlodipine Besylate | 19.0 |
| Valganciclovir | 42.2 | Hydrocodone | 18.8 |
| Hydrocodone | 32.2 | Sulfamethoxazole-Trimethoprim | 18.1 |
| Oxycodone | 29.9 | Metoprolol Tartrate | 16.9 |
| Amlodipine Besylate | 29.4 | Amoxicillin | 16.8 |
| Metoprolol Tartrate | 27.0 | Omeprazole | 14.3 |
| Ciprofloxacin | 25.6 | Ciprofloxacin | 13.2 |
| Furosemide | 24.6 | Furosemide | 13.1 |
| Omeprazole | 21.8 | Azithromycin | 12.7 |
| Docusate Sodium | 18.4 | Oxycodone | 12.0 |
| Amoxicillin | 18.3 | Insulin Glargine | 11.9 |
| Clotrimazole | 16.7 | Simvastatin | 10.9 |
Table KI 4.3. Adult kidney donor-recipient serology matching, 2010–2014.
Donor serology is reported on the OPTN Donor Registration Form and recipient serology on the OPTN Transplant Recipient Registration Form. Any evidence for a positive serology is treated as positive for that serology. If all fields are unknown, incomplete, or pending, the person is categorized as unknown for that serology; otherwise, serology is assumed negative.
| Recipient − | Recipient + | Recipient unk. | ||||||||
|---|---|---|---|---|---|---|---|---|---|---|
|
|
||||||||||
| Donor | D− | D+ | D unk. | D− | D+ | D unk. | D− | D+ | D unk. | |
| CMV | Deceased | 12.6 | 18.4 | 0.1 | 24.8 | 42.5 | 0.2 | 0.4 | 0.9 | 0.0 |
| Living | 23.8 | 16.3 | 1.4 | 20.7 | 34.6 | 1.9 | 0.5 | 0.4 | 0.4 | |
|
| ||||||||||
| EBV | Deceased | 0.7 | 8.7 | 0.0 | 4.5 | 71.3 | 0.1 | 0.9 | 13.8 | 0.0 |
| Living | 1.6 | 6.9 | 1.4 | 5.7 | 64.0 | 5.7 | 0.5 | 5.1 | 9.1 | |
|
| ||||||||||
| HB core | Deceased | 78.1 | 2.7 | 0.0 | 7.9 | 0.6 | 0.0 | 10.3 | 0.3 | 0.0 |
| Living | 75.9 | 1.4 | 5.9 | 3.4 | 0.3 | 0.4 | 7.4 | 0.1 | 5.1 | |
|
| ||||||||||
| HB surface antigen | Deceased | 95.6 | 0.0 | 0.1 | 2.4 | 0.0 | 0.0 | 1.8 | 0.0 | 0.0 |
| Living | 90.1 | 0.2 | 5.9 | 1.4 | 0.0 | 0.1 | 1.9 | 0.0 | 0.4 | |
|
| ||||||||||
| HCV | Deceased | 91.2 | 0.2 | 0.0 | 4.2 | 2.0 | 0.0 | 2.3 | 0.0 | 0.0 |
| Living | 91.0 | 0.2 | 3.8 | 2.0 | 0.0 | 0.1 | 2.1 | 0.0 | 0.7 | |
|
| ||||||||||
| HIV | Deceased | 90.4 | 0.0 | 0.1 | 0.7 | 0.0 | 0.0 | 8.8 | 0.0 | 0.0 |
| Living | 85.7 | 0.0 | 5.5 | 0.4 | 0.0 | 0.0 | 3.9 | 0.0 | 4.5 | |
CMV, cytomegalovirus; EBV, Epstein-Barr virus; HB, hepatitis B; HCV, hepatitis C virus; HIV, human immunodeficiency virus.


