Abstract
The normal elastic X-ray scattering that depends only on electron density can be modulated by an ‘anomalous’ component due to resonance between X-rays and electronic orbitals. Anomalous scattering thereby precisely identifies atomic species, since orbitals distinguish atomic elements, which enables the multi- and single-wavelength anomalous diffraction (MAD and SAD) methods. SAD now predominates in de novo structure determination of biological macromolecules, and we focus here on the prevailing SAD method. We describe the anomalous phasing theory and the periodic table of phasing elements that are available for SAD experiments, differentiating between those readily accessible for at-resonance experiments and those that can be effective away from an edge. We describe procedures for present-day SAD phasing experiments and we discuss optimization of anomalous signals for challenging applications. We also describe methods for using anomalous signals as molecular markers for tracing and element identification. Emerging developments and perspectives are discussed in brief.
Keywords: Anomalous scattering, crystal structure, phasing problem, native SAD, multiple crystals, de novo structure determination
1 Introduction and Theoretical Background
X-ray diffraction analysis is very effective for determining atomic structures of biological macromolecules. It does not produce images directly, however, rather the image is synthesized computationally from the diffracted waves, for which we can record directly only the amplitudes and need to evaluate the phases by other means. Anomalous diffraction has become the method of choice for de novo structure determination of biomolecules. In this chapter, we summarize the theory, approaches, and applications that are currently most effective for using anomalous diffraction in structure analysis.
X-rays are scattered from electrons in the atoms from which molecules are built; and, when these molecules are arrayed into a crystal, the coherent component of the scattering is restricted to discretely directed and highly amplified beams. Each diffracted X-ray beam (Bragg reflection) is characterized by its direction, encoded by Miller indices h(h,k,l); its amplitude, for which the structure-dependent factor is designated |F(h)|; and its phase ϕ(h). The theory of diffraction from a crystal has the form of a Fourier transformation of the distribution of electron density ρ(r) for all positions r within the unit cell of the crystal: F(h) = |F(h)| exp(iϕ(h)) = ℱ [ρ(r)]. By Fourier theory, the electron-density distribution can be reconstituted by Fourier inversion of the comprehensive set of diffracted waves: ρ(r) = ℱ−1 [{F(h)}]. Since X-ray experiments record only the amplitudes of diffracted X-ray waves, this poses the phase problem – what is ϕ(h) for each of the many thousands of Bragg reflections from a biomolecular crystal?
Several ingenious methods have been invented for solving the phase problem, and the one that took hold initially for proteins was that of multiple isomorphous replacement (MIR), which takes advantage of the distinctively strong scattering of heavy metals that can be added to the natural macromolecule. Scattering strength from matter is defined by the atomic scattering factor, f, which is measured relative to the inelastic scattering expected from a single electron and is proportional to the number of electrons in an atom (atomic number Z). Hence, as an example, mercury at Z=80 is highly potent as a scatterer when inserted into biomolecules, which are largely made of carbon (Z=6), nitrogen (Z=7), and oxygen (Z=8). Scattering from atoms includes not only this ‘normal’ component proportional to electron density, f∘, but also an ‘anomalous’ increment, fΔ, due to resonance between the incident X-ray waves and electronic orbitals. A 90° phase shift accompanies anomalous (resonant) scattering, which resolves into real and imaginary parts, f′ and f″. Thus,
| (1) |
Anomalous scattering factors are usually small relative to normal scattering factors; nevertheless, anomalous scattering proved effective from the earliest days of protein crystallography for enhancing MIR (MIRAS) or for making single derivative analyses possible (SIRAS).
Eventually, it became clear that anomalous scattering on its own could suffice to solve the phase problem for macromolecular crystals. We have thoroughly reviewed the ensuing development of multi- and single-wavelength anomalous diffraction (MAD and SAD) [1]. Here, we simply summarize the theoretical underpinnings. Phase evaluation by MAD or SAD begins by measuring complete diffraction data {|λF(±h)|2} at an appropriate set of wavelengths λ (only one for SAD) and usually at ±h (Friedel mates or symmetry equivalents, i.e. the Bijvoet mates); atomic positions for the anomalous scatterers are then determined, usually from an analysis of Bijvoet differences; next, contributions to the diffraction from the normal scattering, f∘, of this ‘anomalous’ substructure can be calculated, ∘FA(h) = |∘FA(h)| exp(i ∘ϕA); and, ultimately, these ∘FA(h) components serve as reference waves for evaluating structure factors, ∘FT(h) = |∘FT(h)| exp(i ∘ϕT), that correspond to the actual electron density for the entire structure (T for total).
Such structure analyses can be made for arbitrarily complex situations, but the formulation simplifies for the case of only one kind of anomalous scatterer (e.g. Se atoms in a selenomethionyl protein). Then
| (2) |
where all wavelength dependence is in the factors a, b and c:
This system of equations from multiple wavelengths and Friedel mates (±h) provides a basis for definitive phase evaluation by MAD [2,3]. The definitive character of MAD is seen from the orthogonality of phase information in appropriate diffraction differences. By differencing between Friedel mates, it follows from Eqs. 2 that
| (3) |
Similarly, after defining <|λF(h)|2> = (|λF(h)|2 + |λF(−h)|2)/2, one can obtain the dispersive differences between measurements made at two wavelengths, λi and λj:
| (4) |
Moreover, since |∘FT(h)| ≈ (|λF(h)| + |λF(−h)|)/2 for typical cases where anomalous scattering is relatively weak, Eq. 3 reduces to the Bijvoet-difference equation for the desired ∘ϕT phase information in terms of the ∘FA(h) reference wave:
| (5) |
Eq. 5 was used as the basis for determining the structure of crambin from the anomalous scattering of its intrinsic sulfur atoms [4], a method that would now be known as native SAD.
The analysis of crambin confronted the complication of phase ambiguity – from Eq. 3 we obtain the sine of an angle but need the angle itself. The partial structure of sulfur atoms was used for ambiguity resolution for the crambin analysis, but it became clear that this approach would not be powerful enough for structure determinations in general. It was the motivation to find a better alternative that led to MAD, where definitive phase evaluation is manifestly feasible – mathematically, Eq. 4 provides cosine values to complement the sine values obtained from Eqs. 3 and 5. MAD analysis developed very effectively, and its varied implementations have been reviewed by us and others [3,5–7,1]. By the year 2000, MAD had surpassed MIR for de novo determination of biomolecular structures [1]. At about that time, a more efficient alternative for resolving phase ambiguities emerged with density modification procedures. Density modification originated with solvent flattening as devised by Wang [8], but it was with systematic incorporation of molecular averaging and other features into the program DM [9] that its effectiveness for SAD grew. By 2006, SAD had overtaken MAD and it now predominates overall for de novo phasing of biomolecules [1].
In this chapter we summarize practical aspects of structure analysis from anomalous diffraction measurements with emphasis on SAD phasing procedures as currently practiced.
2 Phasing elements and anomalous scattering factors
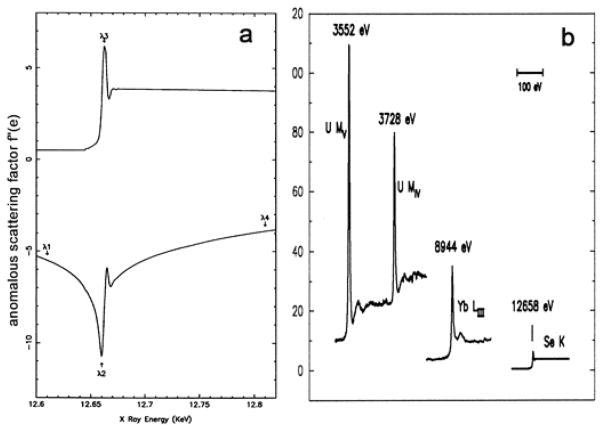
MAD phasing experiments rely on the sharp variation of anomalous scattering that occurs near the resonance energy for a suitable electronic transition. The spectrum of anomalous scattering factors at the Se K edge of a selenomethionyl (SeMet) protein is shown in Fig. 1a as an example. Definitive phase evaluations can be made with a judicious selection of wavelengths, chosen as indicated to optimize the complementarity from the f′ and f″ contributions defined by Eqs. 3 and 4. To a first approximation, all K edges are alike except that their resonant energies progress systematically with atomic number; likewise for L and M edges. K, L and M resonances do give rise to successively larger anomalous scattering factors, however, as they respectively engage more electrons. Moreover, electrons in molecular orbitals may give rise to especially sharp edge variations (white lines), as seen in the f″ spectra (Fig. 1b). Peak f″ values vary from a few electrons for Se at its K edge (E=12.66 keV), to some 30 electrons for Yb at its LIII edge (E=8.94 keV), to over 100 electrons for U at its MV edge (E=3.55 keV).
Fig. 1. X-ray anomalous scattering absorption edges.
(a) Anomalous scattering factor real component f′ (bottom) and imaginary component f″ (top) from Se. (b) Anomalous diffraction imaginary component f″ for Se K edge, Yb LIII edge, U MIV and U Mv edges. The Se K edge is from a crystal of selenomethionyl human chorionic gonadotropin [76], the U MIV and U MV edges are from uranyl nitrate [77], and the Yb LIII edge is from a ytterbium-derivatized crystal of N-cadherin [78]. Reproduced with permission from Elsevier Ltd. for (a) and the Proceedings of the National Academy of Sciences of the United States of America for (b).
SAD phasing depends only on f″, and it can be highly effective when freed by density modification from the tyranny of phase ambiguity. The strength of anomalous diffraction for SAD can be estimated as the Bijvoet diffraction ratio [4]. For the case of one kind of anomalous scatterer, this ratio approximates to
| (6) |
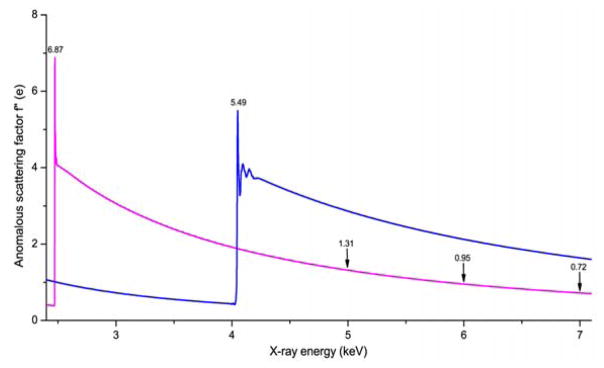
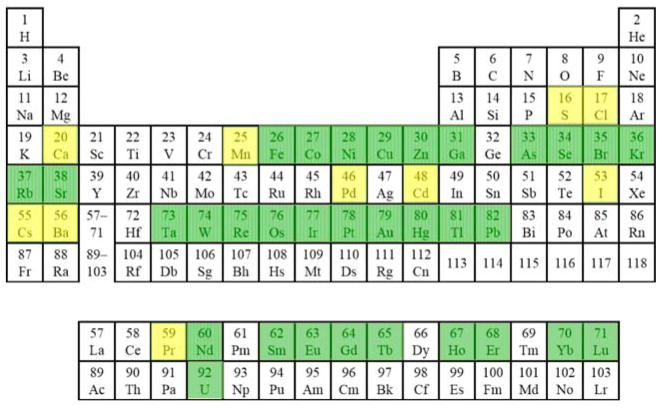
where NA and NP are the numbers of anomalous scatterers and total non-hydrogen atoms, respectively, and Zeff is the effective atomic number (~6.7 for proteins). Thus, the Bijvoet signals needed for SAD phasing are proportional to the strength of f″, the imaginary component of anomalous scattering for the phasing element in a specific subject of interest, and to the relative abundance of ordered atoms of this element. For a given crystal, the optimization of f″ is of paramount importance. For an accessible edge, the X-ray energy needs to be tuned precisely to obtain the highest possible f″. For lighter atoms, the resonance energy is too low to be accessible at many synchrotron beamlines, as for the sulfur and calcium K edges at 2.47 keV and 4.04 keV, respectively (Fig. 2). Nevertheless, these atoms can produce weak but measurable anomalous signals at off-resonance energies; for sulfur, f″ is 1.31 electrons at 5 keV, 0.96 electrons at 6 keV and 0.72 electrons at 7 keV. The anomalous scattering signals from sulfur can be harvested for phasing at most crystallographic beamlines. Fig. 3 has the periodic table colored for phasing elements that have been used for MAD and SAD experiments, at-resonance (green) or off-resonance (yellow).
Fig. 2. Anomalous scattering factor f″ for light phasing atoms S (magenta) and Ca (blue).
The near-edge data for S and Ca were combined with off-resonance f″ spectra from quantum calculations [79] with experimental X-ray Absorption Near-Edge Structure (XANES) data for S [80] and Ca [81] fitted by using program Chooch [82].
Fig. 3. Periodic table of phasing elements.
Elements currently used in at-resonance experiments are highlighted in green; and elements used in off-resonance experiments are highlighted in yellow. Reproduced from [1] with permission from Cambridge University Press.
Appropriate phasing atoms have to be incorporated into biomolecules for analysis by anomalous diffraction For proteins that do not contain desired phasing atoms natively, co-crystallization or soaking are two popular ways of introducing phasing atoms [10]. Derivatization of heavy atoms to proteins may be screened in solution ahead of crystallization experiments [11]. However, it is hard to predict the results and anomalous data have to be measured for screening suitable phasing atoms. This is a trial-and-error process with significant overhead in time and cost in dealing with toxic heavy atoms. To facilitate phasing atom incorporation, selenomethionyl (SeMet) substitution method was invented by biochemical incorporation in vivo [12]. The substituted SeMet gave reliable incorporation and robust anomalous signals and is now the most popular method for introducing phasing atoms. Of course, transition metals such as iron, zinc, and copper are present naturally in about 30% native proteins. These metals are suitable phasing atoms for at-resonance experiments (K edges are at 7.11 keV for Fe, 8.98 keV for Cu and 9.66 keV for Zn). Beyond these heavier phasing atoms, most proteins contain sulfur in methionine and cysteine residues and all nucleic acids contain phosphorus. With no need of heavy atom derivatization, native-SAD phasing is a very attractive approach.
3 Routine Procedures for SAD Phasing
SAD phasing depends on what are often relatively delicate anomalous signals embodied in the Bijvoet differences (Eq. 5). Nevertheless, SAD structure determinations are often quite routine for metalloproteins or SeMet proteins and now even for native, only-light-atom biomolecules. SAD phasing procedures include preparation of suitable cryogenic samples, anomalous data collection and analysis, substructure and phase determination, model building and refinement. We discuss these individual procedures with our recently solved DnaK structure in ATP state (DnaK-ATP) by native SAD [13,14].
3.1 Cryogenic sample preparation
Cryocooling is the most efficient way to stretch the lifetime of biomolecular crystals under X-ray exposure [15]. The standard procedure is to transfer a crystal on a micromount into cryoprotectant for a short time soaking before immersion into liquid nitrogen at 100 K. The purpose of using cryoprotectant is to slow the rate of ice nucleation so that flash cooling produces a rigid glass instead of crystalline ice. For most crystals, a few seconds of soaking suffice for the exchange process. If the standard protocol does not work, for example resulting in cracked crystals or deteriorated diffraction, stepwise cryoprotectant exchange may be necessary to minimize the osmotic and surface stress shock. To find a suitable cryoprotectant, a screening kit such as CryoPro from Hampton Research may be used. For challenging samples that could not survive externally added cryoprotectant, dehydration could be used to increase the precipitant concentration; and crystals might then be frozen directly. The size of crystals and the amount of solvents around crystals are also important factors for cryocooling [16]. For optimized anomalous data collection, one should minimize solvents around crystals as much as possible before cryocooling. This can be realized by matching micromount size to crystal size and by removing solvents with a filter paper. To prevent over-dehydration, cryogenic sample preparation is better performed at lower temperature, for example in a cold room or a temperature-controllable glove box or cabinet.
3.2 Anomalous data measurement
Contemporary anomalous data are preferably measured at sophisticated modern synchrotron beamlines with X-ray energy tunable to desired values. A list of synchrotron beamlines for macromolecular crystallography may be found at BioSync (biosync.sbkb.org). Most beamlines can either be tuned to cover the anomalous diffraction spectrum for multiple phasing atoms or fixed to specific energies for popular phasing atoms, such as 12.67 keV for SeMet crystals.
Prior to anomalous data collection at an energy-tunable beamline, the X-ray energy needs first to be calibrated. For at-resonance experiment, a two-stage fluorescence scanning protocol is used. With SeMet K edge resonance as an example, first the Se foil standard is used for an EXAFS scanning to calibrate the energy to Se K edge at 12.67 keV. Then a SeMet crystal is used for a second scanning from which the resonant X-ray energy is determined for anomalous data collection. For off-resonance anomalous data collection, only the foil scanning is needed for energy calibration. For sulfur off-resonance anomalous data collection, X-ray energy at around 7 keV or lower is desirable. To collect anomalous data at 7 keV, Fe K edge (E=7.11 keV) is used for calibration. Similarly Cr K edge (E=5.99 keV) is used for 6 keV; and Cs LIII edge (E=5.01 keV) is used for 5 keV energy calibration.
Expected Bijvoet-difference signals are relatively weak for many SAD phasing problems, certainly so for native SAD structures and often also for low-resolution SeMet SAD cases. It then becomes imperative to take special considerations in reducing errors when making the diffraction measurements. Errors may be random, systematic, or sporadic (i.e. inexplicable). Random errors might be overcome by increasing the average measurement time for reflections, or alternatively by increasing the redundancy in measurements at a given dose rate. Radiation damage is, of course, detrimental to the purpose of reducing random errors by increased exposure [17], and this may introduce added systematic error if excessive. If multiplicity is achieved from different samples or different crystal orientations, systematic components of error tend to be randomized which drives toward accuracy. High multiplicity achieved at reduced dose in multiple orientation has proved very effective for achieving satisfactory signal-to-noise [18]. This approach requires use of a multi-axis goniometer such as PRIGo [19]. When radiation damage is a concern, data from different crystals may be used to improve data quality [20,21]. Systematic errors that may arise from various effects, such as sample absorption, may cancel in differences obtained by inverse-beam data collection [22]. A common inverse-beam procedure is first to collect a wedge of data (5–10° rotation), and then to repeat this wedge with the crystal rotated by 180° about an axis perpendicular to the X-ray beam. By this strategy, Friedel mates recorded in the two wedges suffer similar systematic errors, including those from the similar prior radiation doses, which then tend to cancel on differencing. Sporadic errors can be eliminated by outlier rejection procedures that are integrated into most data reduction packages such as those noted below [23].
For a good start in SAD phasing, diffraction data better than 6 Å spacings for at-resonance experiments and better than 3.5 Å for off-resonance native SAD experiments are recommended.
3.3 Anomalous signal analysis
Diffraction data processing packages HKL2000 [23], d*TREK[24], XDS [25], and MOSLFM [26] may be used conveniently for anomalous data processing. All these packages index diffraction patterns to obtain the lattice information, from which reflections can be integrated and used for subsequent data reduction process either internally or through external programs. Procedures for using individual programs may be found from their website documentation and published literature. Here we use XDS [25,27] to illustrate the deduction of anomalous signals. With XDS, the indexing may be performed from a single pattern, wedge data or the entire data. For diffraction data to 3 Å spacings or beyond, default refinement parameters may be used; while for low resolution data, worse than 3.5 Å, parameters of beam center and the sample-to-detector distance may be better fixed for reliable indexing and integration. The two parameters may be refined during the optimization steps after the orientation matrix and unit cell parameters have been well determined. To accommodate radiation damage, it is beneficial to use corrections for “ALL” factors with “STRICT_ABSORPTION_CORRECTION=TRUE” for Bijvoet mates. During integration, Bijvoet mates are separated and are not used for calculation of statistics. After integration, XSCALE and XDSCONV within the XDS package can be used for obtaining reduced data. Alternatively, XDS output can be used for downstream data processing by external packages such as CCP4 [28] or PHENIX [29]. CCP4 programs POINTLESS and AIMLESS (a new version of SCALA) [30,31] can be used for data analysis and reduction. The same as in XDS, Friedel mates are treated as two separate reflections during merging in AIMLESS or SCALA.
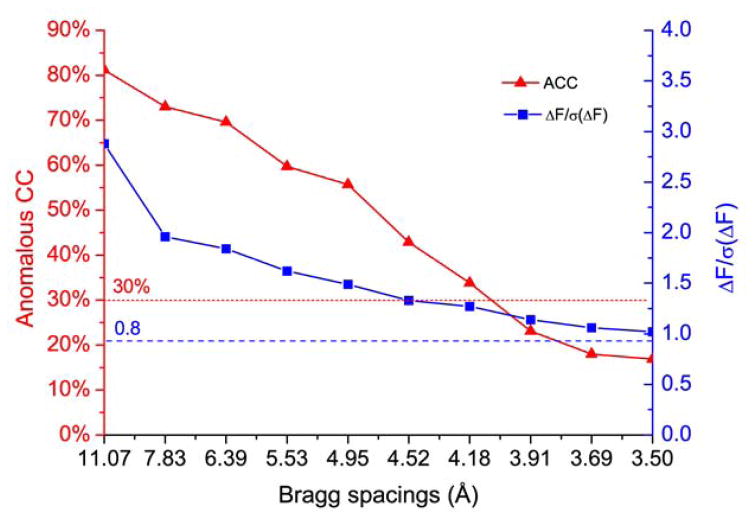
Data quality indicators for anomalous signals have been reviewed thoroughly [32,33]. Among these we prefer to use anomalous CC (ACC) and ΔF/σ(ΔF) to quantify anomalous signals (Fig. 4). ACC calculates the correlation coefficients between anomalous differences in randomly split halves of data. The plot of ACC with respect to Bragg spacings gives an indication of meaningful anomalous signals cutoff for substructure determination and phasing. Due to increased measurement noise, anomalous signals drop with decreasing Bragg spacings. The suggested cutoff value for ACC is 25–30% [34]; nevertheless, in our practice, data at lower ACC may still be useful for substructure determination and phasing. A second useful measure is the experimental anomalous signal-to-noise ratio, <|ΔF|> / σ(<|ΔF|>), which is calculated by SHELXC or CCP4 programs and denoted ΔF/σ(ΔF) for short. As for ACC, the plot of ΔF/σ(ΔF) with respect to Bragg spacings also indicates the strength of anomalous signals. The expected value of ΔF/σ(ΔF) for random data is (2/π)1/2 [SHELX manual, http://shelx.uni-ac.gwdg.de/SHELX/]; therefore values over 0.8 are associated with meaningful anomalous signals provided that σ values are properly estimated. Anomalous signals in DnaK-ATP are significant as shown by the two dashed lines, red for ACC and blue for ΔF/σ(ΔF) (Fig. 4). Based on the ACC and ΔF/σ(ΔF) analyses, anomalous signals at 3.8 Å may be used for substructure determination where ACC and ΔF/σ(ΔF) are 20.5% and 1.1, respectively.
Fig. 4. Anomalous signal indicators.
Anomalous correlation coefficient (ACC) (red) and ΔF/σ(ΔF) (blue) for DnaK-ATP [13,14] were shown. Dashed red line at 30% and dashed blue line at 0.8 are cutoff values for evaluation of ACC and ΔF/σ(ΔF), respectively.
3.4 Substructure determination
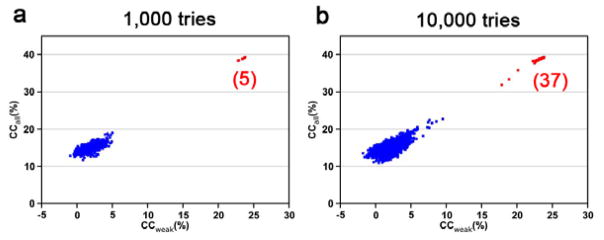
To determine the phases for the overall structure, first the anomalous substructure has to be determined, which is done from |ΔF±h| data with reference to Eq. 5 for relatedness to the |∘FA| coefficients for the substructure. CCP4, PHENIX, SHELXD [35], and SnB [36] packages can be used to determine the substructure of phasing atoms by direct methods. SHELXD uses correlation coefficients (CC) between normalized structure factors of observed |ΔF±h | data and those calculated from trial models as criteria to evaluate the validity of substructure solutions. For each trial structure, CCall and CCweak are calculated based on all data and 30% of the weak data, respectively (Fig. 5) [34]. For DnaK-ATP substructure determinations, we used 3.8 Å data for search of 32 sites for either 10,000 or 1000 tries, both yielding clear separation of correct solutions (red cluster) and random candidates (blue cluster). Although clear separation almost certainly indicates correctness of solutions, candidates separated even marginally from the random CCall/CCweak cluster, as in Fig. 5b) might be useful. Such candidates may contain a partial substructure, which could be refined and expanded to a complete structure during the phasing procedure (see Section 3.5). For substructure determination by SHELXD, a few parameters have to be explored to enhance the success structure determination practice. The first parameter is the number of tries. More tries will give a high probability of finding correct solutions. For DnaK-ATP, we could not find substructures with 100 tries; but we found 5 solutions from 1,000 tries and 37 from 10,000 tries. It is advisable to have 10,000 tries for routine substructure determination. The second parameter is the resolution cutoff as shown in Fig. 4. Including noisy high angle data is detrimental for substructure determination. In general, a series of resolution cutoffs for ACC between 30% and 10% may be screened for substructure determination. The third parameter is the number of substructure phasing atoms for the searches. The exact number of phasing atoms is often uncertain or unknown, for example, because of an ambiguous number of molecules per asymmetric unit, unclear stoichiometry of heavy-atom derivatization, or uncertainty in site flexibility and solvent ions for native SAD. In general, it is wise to search for atoms from as few as 2 to as many as 100 to best cover the possibilities.
Fig. 5. CCweak/CCall plots for substructure determination by SHELXD.
Red and blue clusters show the correct and random solutions, respectively. The numbers of correct solutions from 1,000 and 10,000 tries were indicated. The native-SAD data for DnaK-ATP were used for the plots.
3.5 Phasing and density modification
Prior to phase calculation, the coordinate, occupancy and temperature factor parameters for the deduced substructure are refined based on ΔF±h data. Then, the refined substructure is used to calculate |∘FA(h)| and ∘ϕA, from which in principle ∘ϕT for the whole structure may be evaluated algebraically from Eq. 5 as
| (7) |
Clearly, for strictly SAD phasing, with ∘ϕA known from the substructure, ∘ϕT has two equally possible solutions, thus posing the phase ambiguity problem. In actual practice, one uses phase probabilities rather than such an algebraic approach. The phase probability distribution, P(∘ϕT), for this situation can be described by the form of
| (8) |
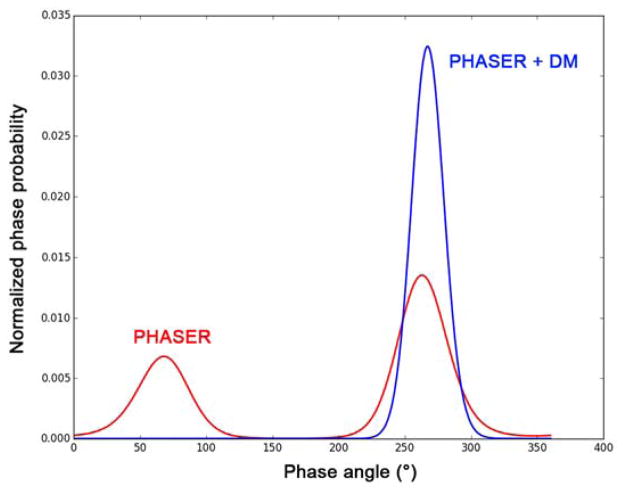
with Hendrickson-Lattman coefficients A, B, C, D as defined for anomalous diffraction based on Eqs. 2 [37] or as deduced from another phase probability analysis. Moreover, the substructure itself provides information for resolving the phase ambiguity intrinsic to SAD, and such partial structure information was used for solving the crambin structure [4]. Substructure refinement by maximum likelihood methods [38] allows for simultaneous substructure completion and phasing in PHASER [39]. After combining phase information from SAD and the partial structure, the phase distribution is skewed toward the true solution (Fig. 6). To use PHASER for substructure completion and phasing, different sigma values for the log-likelihood gradient map may be tried for optimized results.
Fig. 6. Anomalous phasing ambiguity resolved by density modification.
This is the phase probability distribution for a reflection in the DnaK-ATP data. For this reflection, the phase ambiguity was partially resolved (red line) by maximum likelihood refined substructure in PHASER [39] and fully resolved (blue line) after density modification in DM [9].
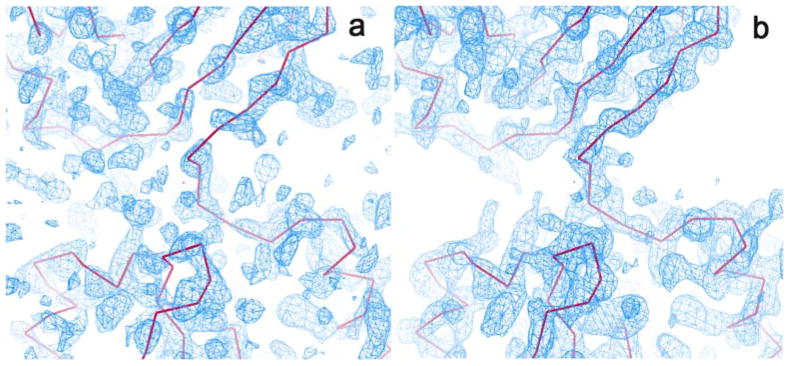
More generally, as discussed above in Section 1, SAD phase ambiguity can be resolved very effectively by density modification [8] as shown by the sharp single-peak phase distribution curve in Fig. 6. With the real space constraints that electron density cannot be negative and that solvent regions have less density variation than the protein, the modified phases are combined with SAD phases by Eq. 8. For the DnaK-ATP structure, the Fourier-synthesized electron density distribution before density modification poorly defines the protein structure (shown as the magenta C7agr; traces); whereas after density modification, the boundary of the protein region is very well defined with β-stand and α-helix features clearly resolved (Fig. 7). Multiple density modification techniques, notably solvent flattening, solvent flipping, histogram matching, and molecular averaging, were developed and implemented in CCP4 programs DM and SOLOMON [40,9].
Fig. 7. Electron density maps of SAD phasing.
(a) Electron density distribution before density modification. (b) Electron density distribution after density modification. The Cα tracings of the built structure are shown as magenta lines. The native-SAD data for DnaK-ATP were used for the figures.
3.6 Model building and refinement
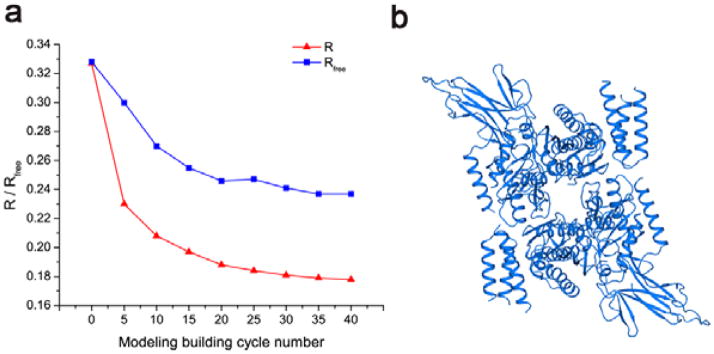
Density-modified electron density maps may be used directly for automated model building when resolution is better than ~3.2 Å. PHENIX, SHELX, ARP/WARP [41], and BUCANNEER [42] may be routinely used for initial model building and refinement. These programs implement an iterative phase combination and improvement procedure through integration with cycles of model building and refinement. Under favorable cases, they may generate a good starting model for further manual model building and adjustments in graphics program COOT [43]. With the cycles of manual or automatic model building and refinement, crystallographic R and Rfree factors should decrease, which is an indication of the quality of the model. Fig. 8a shows progress of the automated model building of DnaK-ATP structure by ARP/WARP at 2.3 Å resolution. At this resolution, pseudoatoms were first used to fill up the experimental electron density map and then subsequently refined, which resulted in initial R and Rfree values of 0.327 and 0.328, respectively. Both R and Rfree dropped persistently during cycles of model building and refinement, and they finally converged to 0.178 and 0.237, respectively, after 40 cycles. We attribute this progression to the high quality of the density-modified experimental phases. With this automated process, ARP/WARP built 1110 ordered residues out of 1200 in the finally refined structure, with an estimated correctness of 97.3%. Fig. 8b shows the DnaK-ATP dimer built automatically by ARP/WARP. Although programs can save a lot of work in model building, it is critical to manually check and build the missing parts to complete the SAD structure determination.
Fig. 8. Automated model building and refinements.
(a) Progression of R and Rfree factors during cycles of model building and refinement of DnaK-ATP in ARP/WARP. (b) A ribbon diagram of the auto-built DnaK structure as a dimer.
4 Optimization of Anomalous Signals for Challenging Applications
SAD phasing has become sufficiently routine that it now dominates de novo crystallographic structure determination [1]. Nevertheless, complications do arise that can stymie routine analysis. These include inadequate anomalous scattering strength, limited diffraction due to poor intrinsic order, small crystals, and radiation damage. Such effects especially afflict state-of-the-art investigations such as on membrane proteins and large macromolecular complexes. Two classes of problems that have remained particularly challenging are low-resolution SAD analyses (dmin ≥ 3.5 Å) and only-light-atom native SAD analyses (anomalous scatterer Z ≤ 20), as is manifest in the under representation of such structures in the Protein Data Bank [44]. When Bijvoet diffraction signals are relatively small (typically <1% for S-SAD at 8 keV and ~4% for SeMet-SAD at the Se K-edge) and noise-causing factors are present, it becomes challenging to achieve adequate signal-to-noise ratio in diffraction measurements (Fig. 4). One can strive to enhance the signal-to-noise ratio by increasing the strength of anomalous scattering or by reducing the level of noise.
4.1 Optimization of anomalous scattering strength
Anomalous scattering strength as measured by the Bijvoet diffraction ratio (Eq. 6) depends on NA, the number of anomalous scatterers, and on f″, the imaginary (absorptive) component of the anomalous scattering factor, all relative to the diffraction of the entire structure. Site occupancies, not considered in Eq. 6, are additional factors of concern, typically so for heavy-atom derivatives and for SeMet proteins from eukaryotic sources. These are helpful considerations in the design of experiments, but for a particular crystal the composition is set. One then only has experimental control over f″ and that control is limited by synchrotron beamline properties. Opportunities for optimization of f″ differ for at-resonance versus off-resonance SAD experiments.
When an appropriate resonance edge is accessible for an anomalous phasing element at issue, then clearly it is best to tune to the resonance peak of f″, which can be ascertained from a fluorescence scan of the sample. The edge features for many resonances of interest are exquisitely sharp (Fig. 1), so this tuning must be done with care. Moreover, because of the sharpness, the peak value can readily be spoiled if the energy resolution of the particular beamline is not adequate. For example, whereas the peak features for Se in SeMet proteins are intrinsically very sharp [12], the focusing optics for divergent beams can blur these features and reduce the maximal achievable value of f″ [1]. Beam-defining slits can adjust beam divergence and thereby improve energy resolution. For the future, beamlines at lower emittance undulator sources, such as NYX at NSLS-II, promise to preserve the inherent fine structure at resonant edges.
The resonant edge for an element of interest may be out of reach at an available beamline; however, one might move to the lowest energy achievable to maximize f″. For example, the K (33.17 keV) and LI (5.19 keV) edges of iodine are both inaccessible at most beamlines, but iodine-SAD experiments are highly practical even with CuKα (8.04 keV) radiation and are made even better at lower energy. Moreover, the resonances of S (2.47 keV) and Ca (4.04 keV), which are important native-SAD elements, are out of reach for most beamlines. Nevertheless, because f″ values steadily increase as the X-ray energy is lowered toward these resonance energies (Fig. 2), highly effective native-SAD experiments can be conducted at 6–7 keV on many beamlines. Practical considerations of diffraction geometry as well as parasitic X-ray absorption and background scattering complicate experiments at lower energy [13], but these are now being explored at Diamond I-23 [45] and Photon Factory beamline 1A [46], and are planned for LAX at NSLS-II.
4.2 Enhancement of signal-to-noise in anomalous diffraction
By arguments from Poisson statistics, if a reflected intensity records N counts, its standard deviation, σ(N) = √N, provides a measure of the noise in this intensity measurement. If the X-ray dose is increased by a factor T, for example by recording T-times longer, the signal-to-noise ratio, I/σ(I), is expected to increase by √T. Similarly, if a given reflection is independently measured M times, the signal-to-noise ratio for these M measurements, <I>/σ(<I>), is expected to be √M times that of an individual measurement. The effectiveness of increasing multiplicity to improve anomalous diffraction analysis has been demonstrated in several studies [47,48]; however, such effectiveness is limited by the radiation sensitivity of the sample [49]. In principle, by using multiple crystals the limitation from radiation damage can be circumvented provided that the crystals are statistically equivalent.
We demonstrated the effectiveness of multi-crystal SAD first by solving a relatively large histidine kinase sensor domain (1456 ordered residues) from eight SeMet crystals [20] and a membrane transporter from three SeMet crystals [50], both at the low resolution of 3.5 Å. The method is of general utility and simplicity and can be used robustly to enhance weak anomalous signals from sulfur for native-SAD phasing [51,13]. Similar procedures have been implemented in CCP4 program BLEND [52] and PHENIX program phenix.scale_and_merge [53] for combing multi-crystal diffraction data.
To make sure that diffraction data from different crystals are indeed equivalent, we devised three statistical metrics for outlier rejection; and their effectiveness in multi-crystal native-SAD phasing has been demonstrated [51,13]. Unit cell variation defines the combined difference of unit cell parameters (both dimensions and angles of the reduced cell). Only crystals with unit cell variation of less than 3σ may be merged together; which may be conveniently calculated by clustering analysis. In addition, the diffraction intensities may be used for precise analysis by diffraction dissimilarity analysis in which the intensities of two crystals are correlated and only compatible data sets (diffraction dissimilarity < 5%) are merged. To quantify anomalous contribution from individual crystals, relative anomalous correlation coefficient (RACC) is used for data correlation analysis. The RACC analysis compares anomalous signals from individual crystals to the merged one; and checks for their relative contribution to the overall anomalous signals. If the contribution from a single crystal is too small or even negative, e.g. reducing the overall ACC, the crystal may be rejected from further use. Through the combination of these three metrics, reliable anomalous signals may be obtained for robust de novo SAD phasing. There are, however, no clear guidelines on exact rejection parameters. For real-life applications, diffraction dissimilarity and RACC are resolution dependent, and it may be worth trying different cutoff combinations. It is also worth noting that improvement from multiple crystals seems to be asymptotic, which is likely crystal and experiment dependent [51].
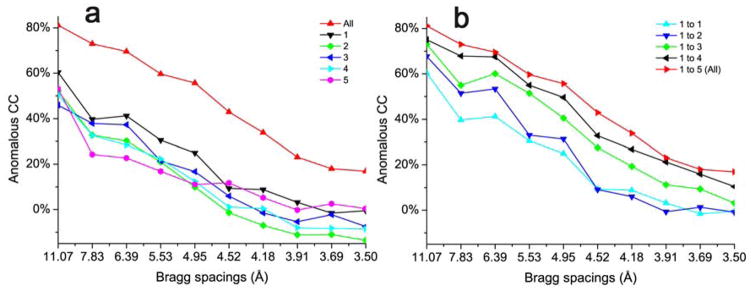
We again illustrate the enhanced anomalous signals with our structure determination of DnaK-ATP by native-SAD phasing [13]. This structure determination was not trivial, which is not surprising because ACC in any single data set is far inferior to the merged one (Fig. 9a). With the progressive inclusion of statistically compatible crystals as judged by the three metrics [13], ACC increased gradually and made the substructure determination and subsequent phasing successful from the merged data (Fig. 9b and Fig. 5).
Fig. 9. Enhanced anomalous signals from using multiple crystals.
(a) Anomalous CC of five DnaK-ATP data sets and the merged (All). (b) Anomalous CC of the progressive accumulation of the five DnaK-ATP data sets, added one by one.
5 Anomalous scattering in chemical and molecular identification
Because anomalous scattering is a resonant phenomenon, dependent on chemical-specific orbitals, the Bijvoet differences and associated Bijvoet-difference Fourier syntheses can provide exquisitely sensitive indicators of chemical species. Such identifications from anomalous scattering can be very helpful in biomolecular structure analysis.
5.1 Element and chemical state identification
The identity and chemical state of metals in metalloproteins can be evident in associated X-ray absorption spectroscopy, and anomalous diffraction analyses can associate these properties with individual sites. Thus, one can readily associate elemental identity with specific sites in metalloproteins by preparing Bijvoet-difference Fourier syntheses at the peak energies of candidate ions. It is also possible to go beyond element identification to site-selective state identification by the procedure of spatially resolved anomalous dispersion refinement [54]. As applied to nitrogenase, where diffraction-derived spectra were obtained from refinements of f″ at 17 energies for 14 Fe sites in the molecule, reduced-state sites were distinguished from oxidized sites [55].
Another common use of anomalous diffraction in element identification concerns biologically relevant low-Z ions, such as Na+, Mg2+, K+, Cl− or Ca2+, which are prevalent constituents in channels, transporters and other biomolecules. Since the resonance edges of these light elements are typically inaccessible, identification are often made indirectly through substitutions such as of Na+ and K+ by Rb+ or Tl+ or of Mg2+ and Ca2+ by Sr2+ or a lanthanide [56]. This, of course, introduces questions of ion compatibilities. We recently introduced the effective alternative of identifying sites in multi-crystal-enhanced Bijvoet-difference syntheses and then performing f″ refinements for each candidate [13]. Using 7 keV X-rays for five native-SAD structures, we succeeded in accurately identifying Mg2+, P, S, Cl−, K+ and Ca2+ atoms (Z=12–20). Other properties such as chelating geometry are also useful in identifying ion sites [57].
5.2 Molecular markers for chain tracing
There can be substantial uncertainty in chain traces made a low resolution (e.g. 3.5 Å or lower), particularly when phasing may be somewhat problematic. An ancillary benefit of SeMet structure determination has been the use of identified Se sites for definitive placement of methionine residues. It has also become rather commonplace to introduce methionine sites by site-directed mutagenesis, which can readily replace leucine and isoleucine residues [58] at strategic positions to obviate uncertainty in tracing. Early examples of using introduced SeMet sites at low to modest resolution include a domain-positioning analysis of a spliceosomal snRNP [59] and disambiguation of chain tracing for a CLC chloride transporter [60] and for P-glycoprotein [61]. Recently, more in the category of hypothesis testing than chain tracing, an introduced SeMet residue was used to identify a putative gating site in a TRPV6 channel structure [62]. Increasingly, as native SAD has taken hold and whenever data are measured at lower energy, the positions of sulfur atoms serve as comprehensive natural markers for methionine and cysteine residues. A procedure has been developed expressly for the purpose of defining such weak anomalous sites [63].
5.3 Localization of ligands
Anomalous scattering can be used to locate ligands that contain identifiable anomalous scatterers, such as Mg-ATP for which the phosphorus and magnesium atoms can be located [13,14]. Another important area of expanding application is in fragment-based drug development. Brominated or iodinated compounds are featured in fragment libraries that are used to identify weakly binding compounds that have substantial potential for chemical expansion into drug-development leads [64,65]. In addition, these halogen atoms can even be used in structure determination by SAD phasing [66].
6 Emerging developments and future perspectives
Recent developments greatly accelerated the SAD phasing which is now dominating de novo structure determination practice. With the fast read-out pixel array detectors such as PILATUS 6M, ADSC HF 4M, and EIGER 16M [67,68], it is now routine to collect complete data sets in a few minutes or less. These detectors enable the use of raster scanning technique for identifying diffraction hot spots without visually seeing crystals as common for frozen crystals embedded in lipid cubic phase. Pixel array detectors are also ideal for collecting fine-slicing data for obtaining improved statistics and data quality [24,69]. If radiation damage is not an issue, multiple data sets and multiple orientations from a single crystal could be used to improve diffraction statistics [48,70]. In addition, the pixel array detectors may permit energy discrimination whereby parasitic fluorescence X-rays can be filtered out.
The integration of substructure determination and phasing are pushing the limit of SAD phasing to allow for use of very weak anomalous signals [71,72]. The iterative model building and refinements procedures as implemented in PHENIX, SHELX, ARP/WARP and BUCANNEER have been greatly useful for automated structure determination. However these programs are most useful at resolutions of about 3.2 Å or higher. At low resolution, due to insufficient number of unique reflections for refinement and less atomic features for chain tracing and side chain docking, new algorithms are needed for automated low-resolution phasing and model building. The incorporation of chemical and bioinformatics knowledge into crystallographic model building cycles may improve geometry and reliability. Better treatment of anisotropy, disorder, and radiation damage at low resolutions are also aspects of consideration for future development.
Contemporary SAD phasing uses crystals with sizes of about 20 microns or larger. For smaller crystals, radiation damage may kill the crystal before useful anomalous signals can be obtained. X-ray free electron lasers have been promising to overcome radiation damage to micron-sized crystals for both Gd-SAD and native-SAD phasing [73–75]. However, X-ray free electron lasers require huge numbers of crystals and are not available for most crystallographers. To make microcrystal SAD routinely accessible, synchrotron beamlines need to be optimized for focused microbeam with high-accuracy goniometers for precise delivery of microcrystals into the beam. New methods for harvesting and cryocooling microcrystals also need to be developed and optimized.
Acknowledgments
This work was supported in part by NIH grants R01GM107462 and P41GM116799 and by Brookhaven National Laboratory LDRD 15-034.
References
- 1.Hendrickson WA. Anomalous diffraction in crystallographic phase evaluation. Q Rev Biophys. 2014;47:49–93. doi: 10.1017/S0033583514000018. [DOI] [PMC free article] [PubMed] [Google Scholar]
- 2.Hendrickson WA. Analysis of protein structure from diffraction measurements at multiple wavelengths. Trans Amer Cryst Assn. 1985;21:11–21. [Google Scholar]
- 3.Hendrickson WA. Determination of Macromolecular Structures from Anomalous Diffraction of Synchrotron Radiation. Science. 1991;254:51–58. doi: 10.1126/science.1925561. [DOI] [PubMed] [Google Scholar]
- 4.Hendrickson WA, Teeter MM. Structure of the hydrophobic protein crambin determined directly from the anomalous scattering of sulfur. Nature. 1981;290:107–113. doi: 10.1038/290107a0. [DOI] [PMC free article] [PubMed] [Google Scholar]
- 5.Hendrickson WA, Ogata CM. Phase determination from multiwavelength anomalous diffraction measurements. Method Enzymol. 1997;276:494–523. doi: 10.1016/S0076-6879(97)76074-9. [DOI] [PubMed] [Google Scholar]
- 6.Walsh MA, Evans G, Sanishvili R, Dementieva I, Joachimiak A. MAD data collection - current trends. Acta Crystallogr. 1999;D55:1726–1732. doi: 10.1107/s0907444999008392. [DOI] [PubMed] [Google Scholar]
- 7.Blow DM. How Bijvoet made the difference: the growing power of anomalous scattering. Methods Enzymol. 2003;374:3–22. doi: 10.1016/S0076-6879(03)74001-4. [DOI] [PubMed] [Google Scholar]
- 8.Wang BC. Resolution of phase ambiguity in macromolecular crystallography. Methods Enzymol. 1985;115:90–112. doi: 10.1016/0076-6879(85)15009-3. [DOI] [PubMed] [Google Scholar]
- 9.Cowtan KD, Zhang KYJ. Density modification for macromolecular phase improvement. Prog Biophys Mol Biol. 1999;72:245–270. doi: 10.1016/s0079-6107(99)00008-5. [DOI] [PubMed] [Google Scholar]
- 10.Pike AC, Garman EF, Krojer T, et al. An overview of heavy-atom derivatization of protein crystals. Acta Crystallogr. 2016;D72:303–318. doi: 10.1107/S2059798316000401. [DOI] [PMC free article] [PubMed] [Google Scholar]
- 11.Boggon TJ, Shapiro L. Screening for phasing atoms in protein crystallography. Struct Fold Des. 2000;8:R143–R149. doi: 10.1016/s0969-2126(00)00168-4. [DOI] [PubMed] [Google Scholar]
- 12.Hendrickson WA, Horton JR, Lemaster DM. Selenomethionyl proteins produced for analysis by multiwavelength anomalous diffraction (MAD) - a vehicle for direct determination of three-dimensional structure. EMBO J. 1990;9:1665–1672. doi: 10.1002/j.1460-2075.1990.tb08287.x. [DOI] [PMC free article] [PubMed] [Google Scholar]
- 13.Liu Q, Liu Q, Hendrickson WA. Robust structural analysis of native biological macromolecules from multi-crystal anomalous diffraction data. Acta Crystallogr. 2013;D69:1314–1332. doi: 10.1107/S0907444913001479. [DOI] [PMC free article] [PubMed] [Google Scholar]
- 14.Qi R, Sarbeng EB, Liu Q, et al. Allosteric opening of the polypeptide-binding site when an Hsp70 binds ATP. Nat Struct Mol Biol. 2013;20:900–907. doi: 10.1038/nsmb.2583. [DOI] [PMC free article] [PubMed] [Google Scholar]
- 15.Pflugrath JW. Practical macromolecular cryocrystallography. Acta Crystallogr. 2015;F71:622–642. doi: 10.1107/S2053230X15008304. [DOI] [PMC free article] [PubMed] [Google Scholar]
- 16.Pellegrini E, Piano D, Bowler MW. Direct cryocooling of naked crystals: are cryoprotection agents always necessary? Acta Crystallogr. 2011;D67:902–906. doi: 10.1107/S0907444911031210. [DOI] [PubMed] [Google Scholar]
- 17.Garman EF, Weik M. Radiation damage to macromolecules: kill or cure? J Synchrotron Rad. 2015;22:195–200. doi: 10.1107/S160057751500380X. [DOI] [PubMed] [Google Scholar]
- 18.Weinert T, Olieric V, Waltersperger S, et al. Fast native-SAD phasing for routine macromolecular structure determination. Nat Methods. 2015;12:131–133. doi: 10.1038/nmeth.3211. [DOI] [PubMed] [Google Scholar]
- 19.Waltersperger S, Olieric V, Pradervand C, et al. PRIGo: a new multi-axis goniometer for macromolecular crystallography. J Synchrotron Rad. 2015;22:895–900. doi: 10.1107/S1600577515005354. [DOI] [PMC free article] [PubMed] [Google Scholar]
- 20.Liu Q, Zhang Z, Hendrickson WA. Multi-crystal anomalous diffraction for low-resolution macromolecular phasing. Acta Crystallogr. 2011;D67:45–59. doi: 10.1107/S0907444910046573. [DOI] [PMC free article] [PubMed] [Google Scholar]
- 21.Olieric V, Weinert T, Finke AD, et al. Data-collection strategy for challenging native SAD phasing. Acta Crystallogr. 2016;D72:421–429. doi: 10.1107/S2059798315024110. [DOI] [PMC free article] [PubMed] [Google Scholar]
- 22.Hendrickson WA, Smith JL, Sheriff S. Direct phase determination based on anomalous scattering. Methods Enzymol. 1985;115:41–55. doi: 10.1016/0076-6879(85)15006-8. [DOI] [PubMed] [Google Scholar]
- 23.Otwinowski Z, Minor W. Processing of X-ray diffraction data collected in oscillation mode. Method Enzymol. 1997;276:307–326. doi: 10.1016/S0076-6879(97)76066-X. [DOI] [PubMed] [Google Scholar]
- 24.Pflugrath JW. The finer things in X-ray diffraction data collection. Acta Crystallogr. 1999;D55:1718–1725. doi: 10.1107/s090744499900935x. [DOI] [PubMed] [Google Scholar]
- 25.Kabsch W. XDS. Acta Crystallogr. 2010;D66:125–132. doi: 10.1107/S0907444909047337. [DOI] [PMC free article] [PubMed] [Google Scholar]
- 26.Leslie AGW. The integration of macromolecular diffraction data. Acta Crystallogr. 2006;D62:48–57. doi: 10.1107/S0907444905039107. [DOI] [PubMed] [Google Scholar]
- 27.Kabsch W. Integration, scaling, space-group assignment and post-refinement. Acta Crystallogr. 2010;D66:133–144. doi: 10.1107/S0907444909047374. [DOI] [PMC free article] [PubMed] [Google Scholar]
- 28.Winn MD, Ballard CC, Cowtan KD, et al. Overview of the CCP4 suite and current developments. Acta Crystallogr. 2011;D67:235–242. doi: 10.1107/S0907444910045749. [DOI] [PMC free article] [PubMed] [Google Scholar]
- 29.Adams PD, Afonine PV, Bunkoczi G, et al. PHENIX: a comprehensive Python-based system for macromolecular structure solution. Acta Crystallogr. 2010;D66:213–221. doi: 10.1107/S0907444909052925. [DOI] [PMC free article] [PubMed] [Google Scholar]
- 30.Evans PR. An introduction to data reduction: space-group determination, scaling and intensity statistics. Acta Crystallogr. 2011;D67:282–292. doi: 10.1107/S090744491003982X. [DOI] [PMC free article] [PubMed] [Google Scholar]
- 31.Evans PR, Murshudov GN. How good are my data and what is the resolution? Acta Crystallogr. 2013;D69:1204–1214. doi: 10.1107/S0907444913000061. [DOI] [PMC free article] [PubMed] [Google Scholar]
- 32.Dauter Z. Estimation of anomalous signal in diffraction data. Acta Crystallogr. 2006;D62:867–876. doi: 10.1107/S0907444906023481. [DOI] [PubMed] [Google Scholar]
- 33.Evans P. Scaling and assessment of data quality. Acta Crystallogr. 2006;D62:72–82. doi: 10.1107/S0907444905036693. [DOI] [PubMed] [Google Scholar]
- 34.Schneider TR, Sheldrick GM. Substructure solution with SHELXD. Acta Crystallogr. 2002;D58:1772–1779. doi: 10.1107/s0907444902011678. [DOI] [PubMed] [Google Scholar]
- 35.Sheldrick GM. Experimental phasing with SHELXC/D/E: combining chain tracing with density modification. Acta Crystallogr. 2010;D66:479–485. doi: 10.1107/S0907444909038360. [DOI] [PMC free article] [PubMed] [Google Scholar]
- 36.Weeks CM, Miller R. The design and implementation of SnB version 2.0. J Appl Crystallogr. 1999;32:120–124. [Google Scholar]
- 37.Pahler A, Smith JL, Hendrickson WA. A probability representation for phase information from multiwavelength anomalous dispersion. Acta Crystallogr. 1990;A46:537–540. doi: 10.1107/s0108767390002379. [DOI] [PubMed] [Google Scholar]
- 38.Fortelle E, Bricogne G. Maximum-likelihood heavy-atom parameter refinement for multiple isomorphous replacement and multiwavelength anomalous diffraction methods. Methods Enzymol. 1997;276:472–494. doi: 10.1016/S0076-6879(97)76073-7. [DOI] [PubMed] [Google Scholar]
- 39.Read RJ, McCoy AJ. Using SAD data in Phaser. Acta Crystallogr. 2011;D67:338–344. doi: 10.1107/S0907444910051371. [DOI] [PMC free article] [PubMed] [Google Scholar]
- 40.Abrahams J, Leslie A. Methods used in the structure determination of bovine mitochondrial F1 ATPase. Acta Crystallogr. 1996;D52:30–42. doi: 10.1107/S0907444995008754. [DOI] [PubMed] [Google Scholar]
- 41.Langer G, Cohen SX, Lamzin VS, et al. Automated macromolecular model building for X-ray crystallography using ARP/wARP version 7. Nat Protoc. 2008;3:1171–1179. doi: 10.1038/nprot.2008.91. [DOI] [PMC free article] [PubMed] [Google Scholar]
- 42.Cowtan K. The Buccaneer software for automated model building. 1. Tracing protein chains. Acta Crystallogr. 2006;D62:1002–1011. doi: 10.1107/S0907444906022116. [DOI] [PubMed] [Google Scholar]
- 43.Emsley P, Lohkamp B, Scott WG, et al. Features and development of Coot. Acta Crystallogr. 2010;D66:486–501. doi: 10.1107/S0907444910007493. [DOI] [PMC free article] [PubMed] [Google Scholar]
- 44.Liu Q, Hendrickson WA. Crystallographic phasing from weak anomalous signals. Curr Opin Struct Biol. 2015;34:99–107. doi: 10.1016/j.sbi.2015.08.003. [DOI] [PMC free article] [PubMed] [Google Scholar]
- 45.Wagner A, Duman R, Henderson K, et al. In-vacuum long-wavelength macromolecular crystallography. Acta Crystallogr. 2016;D72:430–439. doi: 10.1107/S2059798316001078. [DOI] [PMC free article] [PubMed] [Google Scholar]
- 46.Ru H, Zhao L, Ding W, et al. S-SAD phasing study of death receptor 6 and its solution conformation revealed by SAXS. Acta Crystallogr. 2012;D68:521–530. doi: 10.1107/S0907444912004490. [DOI] [PMC free article] [PubMed] [Google Scholar]
- 47.Dauter Z, Adamiak DA. Anomalous signal of phosphorus used for phasing DNA oligomer: importance of data redundancy. Acta Crystallogr. 2001;D57:990–995. doi: 10.1107/s0907444901006382. [DOI] [PubMed] [Google Scholar]
- 48.Liu ZJ, Chen L, Wu D, et al. A multi-dataset data-collection strategy produces better diffraction data. Acta Crystallogr. 2011;A67:544–549. doi: 10.1107/S0108767311037469. [DOI] [PMC free article] [PubMed] [Google Scholar]
- 49.Garman EF. Radiation damage in macromolecular crystallography: what is it and why should we care? Acta Crystallogr. 2010;D66:339–351. doi: 10.1107/S0907444910008656. [DOI] [PMC free article] [PubMed] [Google Scholar]
- 50.Mancusso R, Gregorio GG, Liu Q, Wang DN. Structure and mechanism of a bacterial sodium-dependent dicarboxylate transporter. Nature. 2012;491:622–626. doi: 10.1038/nature11542. [DOI] [PMC free article] [PubMed] [Google Scholar]
- 51.Liu Q, Dahmane T, Zhang Z, et al. Structures from anomalous diffraction of native biological macromolecules. Science. 2012;336:1033–1037. doi: 10.1126/science.1218753. [DOI] [PMC free article] [PubMed] [Google Scholar]
- 52.Foadi J, Aller P, Alguel Y, et al. Clustering procedures for the optimal selection of data sets from multiple crystals in macromolecular crystallography. Acta Crystallogr. 2013;D69:1617–1632. doi: 10.1107/S0907444913012274. [DOI] [PMC free article] [PubMed] [Google Scholar]
- 53.Akey DL, Terwilliger TC, Smith JL. Efficient merging of data from multiple samples for determination of anomalous substructure. Acta Crystallogr. 2016;D72:296–302. doi: 10.1107/S2059798315021920. [DOI] [PMC free article] [PubMed] [Google Scholar]
- 54.Einsle O, Andrade SL, Dobbek H, et al. Assignment of individual metal redox states in a metalloprotein by crystallographic refinement at multiple X-ray wavelengths. J Am Chem Soc. 2007;129:2210–2211. doi: 10.1021/ja067562o. [DOI] [PMC free article] [PubMed] [Google Scholar]
- 55.Spatzal T, Schlesier J, Burger EM, et al. Nitrogenase FeMoco investigated by spatially resolved anomalous dispersion refinement. Nat Commun. 2016;7:10902. doi: 10.1038/ncomms10902. [DOI] [PMC free article] [PubMed] [Google Scholar]
- 56.Zhou Y, MacKinnon R. The occupancy of ions in the K+ selectivity filter: charge balance and coupling of ion binding to a protein conformational change underlie high conduction rates. J Mol Biol. 2003;333:965–975. doi: 10.1016/j.jmb.2003.09.022. [DOI] [PubMed] [Google Scholar]
- 57.Echols N, Morshed N, Afonine PV, et al. Automated identification of elemental ions in macromolecular crystal structures. Acta Crystallogr. 2014;D70:1104–1114. doi: 10.1107/S1399004714001308. [DOI] [PMC free article] [PubMed] [Google Scholar]
- 58.Leahy DJ, Erickson HP, Aukhil I, et al. Crystallization of a fragment of human fibronectin: introduction of methionine by site-directed mutagenesis to allow phasing via selenomethionine. Proteins. 1994;19:48–54. doi: 10.1002/prot.340190107. [DOI] [PubMed] [Google Scholar]
- 59.Oubridge C, Krummel DA, Leung AK, et al. Interpreting a low resolution map of human U1 snRNP using anomalous scatterers. Structure. 2009;17:930–938. doi: 10.1016/j.str.2009.05.009. [DOI] [PMC free article] [PubMed] [Google Scholar]
- 60.Feng L, Campbell EB, Hsiung Y, et al. Structure of a eukaryotic CLC transporter defines an intermediate state in the transport cycle. Science. 2010;330:635–641. doi: 10.1126/science.1195230. [DOI] [PMC free article] [PubMed] [Google Scholar]
- 61.Jin MS, Oldham ML, Zhang Q, et al. Crystal structure of the multidrug transporter P-glycoprotein from Caenorhabditis elegans. Nature. 2012;490:566–569. doi: 10.1038/nature11448. [DOI] [PMC free article] [PubMed] [Google Scholar]
- 62.Saotome K, Singh AK, Yelshanskaya MV, et al. Crystal structure of the epithelial calcium channel TRPV6. Nature. 2016;534:506–511. doi: 10.1038/nature17975. [DOI] [PMC free article] [PubMed] [Google Scholar]
- 63.Thorn A, Sheldrick GM. ANODE: anomalous and heavy-atom density calculation. J Appl Crystallogr. 2011;44:1285–1287. doi: 10.1107/S0021889811041768. [DOI] [PMC free article] [PubMed] [Google Scholar]
- 64.Groftehauge MK, Therkelsen MO, Taaning R, et al. Identifying ligand-binding hot spots in proteins using brominated fragments. Acta Crystallogr. 2013;F69:1060–1065. doi: 10.1107/S1744309113018551. [DOI] [PMC free article] [PubMed] [Google Scholar]
- 65.Tiefenbrunn T, Forli S, Happer M, et al. Crystallographic fragment-based drug discovery: use of a brominated fragment library targeting HIV protease. Chem Biol Drug Des. 2014;83:141–148. doi: 10.1111/cbdd.12227. [DOI] [PMC free article] [PubMed] [Google Scholar]
- 66.Bauman JD, Harrison JJ, Arnold E. Rapid experimental SAD phasing and hot-spot identification with halogenated fragments. IUCrJ. 2016;3:51–60. doi: 10.1107/S2052252515021259. [DOI] [PMC free article] [PubMed] [Google Scholar]
- 67.Loeliger T, Bronnimann C, Donath T, et al. The new PILATUS3 ASIC with instant retrigger capability. IEEE; 2012. pp. 610–615. 10/2012 2012. [DOI] [Google Scholar]
- 68.Tinti G, Bergamaschi A, Cartier S, et al. Performance of the EIGER single photon counting detector. J Instrum. 2015;10:C03011. [Google Scholar]
- 69.Mueller M, Wang M, Schulze-Briese C. Optimal fine phi-slicing for single-photon-counting pixel detectors. Acta Crystallogr. 2012;D68:42–56. doi: 10.1107/S0907444911049833. [DOI] [PMC free article] [PubMed] [Google Scholar]
- 70.Brockhauser S, Ravelli RB, McCarthy AA. The use of a mini-kappa goniometer head in macromolecular crystallography diffraction experiments. Acta Crystallogr. 2013;D69:1241–1251. doi: 10.1107/S0907444913003880. [DOI] [PMC free article] [PubMed] [Google Scholar]
- 71.Skubak P, Pannu NS. Automatic protein structure solution from weak X-ray data. Nat Commun. 2013;4:2777. doi: 10.1038/ncomms3777. [DOI] [PMC free article] [PubMed] [Google Scholar]
- 72.Bunkóczi G, McCoy AJ, Echols N, et al. Macromolecular X-ray structure determination using weak, single-wavelength anomalous data. Nat Methods. 2014;12:127–130. doi: 10.1038/nmeth.3212. [DOI] [PMC free article] [PubMed] [Google Scholar]
- 73.Barends TR, Foucar L, Botha S, et al. De novo protein crystal structure determination from X-ray free-electron laser data. Nature. 2014;505:244–247. doi: 10.1038/nature12773. [DOI] [PubMed] [Google Scholar]
- 74.Nakane T, Song C, Suzuki M, et al. Native sulfur/chlorine SAD phasing for serial femtosecond crystallography. Acta Crystallogr. 2015;D71:2519–2525. doi: 10.1107/S139900471501857X. [DOI] [PMC free article] [PubMed] [Google Scholar]
- 75.Nass K, Meinhart A, Barends TR, et al. Protein structure determination by single-wavelength anomalous diffraction phasing of X-ray free-electron laser data. IUCrJ. 2016;3:180–191. doi: 10.1107/S2052252516002980. [DOI] [PMC free article] [PubMed] [Google Scholar]
- 76.Wu H, Lustbader JW, Liu Y, et al. Structure of human chorionic gonadotropin at 2.6 A resolution from MAD analysis of the selenomethionyl protein. Structure. 1994;2:545–558. doi: 10.1016/s0969-2126(00)00054-x. [DOI] [PubMed] [Google Scholar]
- 77.Liu Y, Ogata CM, Hendrickson WA. Multiwavelength anomalous diffraction analysis at the M absorption edges of uranium. Proc Natl Acad Sci USA. 2001;98:10648–10653. doi: 10.1073/pnas.191003998. [DOI] [PMC free article] [PubMed] [Google Scholar]
- 78.Shapiro L, Fannon AM, Kwong PD, et al. Structural basis of cell-cell adhesion by cadherins. Nature. 1995;374:327–337. doi: 10.1038/374327a0. [DOI] [PubMed] [Google Scholar]
- 79.Cromer DT, Liberman DA. Anomalous dispersion calculations near to and on the long-wavelength side of an absorption edge. Acta Crystallogr. 1981;A37:267–268. [Google Scholar]
- 80.Bovenkamp GL, Zanzen U, Krishna KS, et al. X-ray absorption near-edge structure (XANES) spectroscopy study of the interaction of silver ions with Staphylococcus aureus, Listeria monocytogenes, and Escherichia coli. Appl Environ Microbiol. 2013;79:6385–6390. doi: 10.1128/AEM.01688-13. [DOI] [PMC free article] [PubMed] [Google Scholar]
- 81.Sepulcre F, Proietti MG, Benfatto M, et al. A quantitative XANES analysis of the calcium high-affinity binding site of the purple membrane. Biophys J. 2004;87:513–520. doi: 10.1529/biophysj.103.030080. [DOI] [PMC free article] [PubMed] [Google Scholar]
- 82.Evans G, Pettifer RF. CHOOCH: a program for deriving anomalous-scattering factors from X-ray fluorescence spectra. J Appl Crystallogr. 2001;34:82–86. [Google Scholar]


