

A combination of experiments and ellipsoid packing models elucidate the critical role of cell geometry in the 3D organization of chromosomes and gene expression. The results show that transcription-dependent chromosome positions, their orientations, and their relative intermingling depend on cell mechanical constraints.
Abstract
Extracellular matrix signals from the microenvironment regulate gene expression patterns and cell behavior. Using a combination of experiments and geometric models, we demonstrate correlations between cell geometry, three-dimensional (3D) organization of chromosome territories, and gene expression. Fluorescence in situ hybridization experiments showed that micropatterned fibroblasts cultured on anisotropic versus isotropic substrates resulted in repositioning of specific chromosomes, which contained genes that were differentially regulated by cell geometries. Experiments combined with ellipsoid packing models revealed that the mechanosensitivity of chromosomes was correlated with their orientation in the nucleus. Transcription inhibition experiments suggested that the intermingling degree was more sensitive to global changes in transcription than to chromosome radial positioning and its orientations. These results suggested that cell geometry modulated 3D chromosome arrangement, and their neighborhoods correlated with gene expression patterns in a predictable manner. This is central to understanding geometric control of genetic programs involved in cellular homeostasis and the associated diseases.
INTRODUCTION
Extracellular matrix (ECM) signals regulate cellular homeostatic programs (Folkman and Moscona, 1978; Wang et al., 2009; Humphrey et al., 2014). Such matrix signals, in the form of substrate rigidity or geometric constraints, have been shown to alter transcription programs (Bissell et al., 1982; Jain et al., 2013). The differential expression of genes is essential, for example, in matrix-assisted lineage specification (Engler et al., 2006; Kilian et al., 2010), as well as in embryonic development (Desprat et al., 2008). Furthermore, in tissue microenvironments, matrix constraints can lead to tumor repression or progression (Butcher et al., 2009).
ECM-dependent mechanotransduction occurs through sensing of the major matrix signals at the level of focal adhesions, for example, via integrin signaling (Iskratsch et al., 2014). Activation of such matrix signals results in nuclear mechanotransduction of a variety of transcription factors, such as YAP/TAZ (Dupont et al., 2011), SRF/MRTF-A (Vartiainen et al., 2007), NF-κB (Hayden and Ghosh, 2008), and JMY (Campellone and Welch, 2010). Early steps of matrix sensing modulate the cytoskeleton and actomyosin contractility and lead to altered nuclear morphology, as well as to chromatin organization (Maniotis et al., 2005). In connective tissue cells such as fibroblasts the nucleus is highly flattened, whereas reduction in the matrix attachment increases the nuclear sphericity (Jain et al., 2013; Li et al., 2014).
The role of cytoskeleton as a mediator for mechanosensitive gene regulation has been extensively studied in recent years. Focal adhesion proteins such as talin, paxillin, zyxin, vinculin, and filamin A connect actin filaments and integrin and act as mechanotransducers regulated by actomyosin contractility (Riveline et al., 2001; Chan et al., 2009). For example, depending on actomyosin contractility, paxillin and zyxin shuttle between the cytoplasm and nucleus, where they serve as transcription coactivators to regulate gene expression (Wang and Gilmore, 2003; Sathe et al., 2016). In addition, cytoskeleton regulates Rho GTPase activity through p190RhoGAP, which further mediates cell shape–dependent changes in cell-cycle progression by adjusting the balance between ROCK and mammalian Diaphanous-related formins (Mammoto et al., 2004, 2007). When cells are round, the activity of p190RhoGAP as a GTPase-activating protein (GAP) is inhibited upon binding to filamin A, and Rho is activated as a result. In contrast, when cells are spread, filamin A is cleaved by calpain, releasing p190RhoGAP from filamin A and moving it to the lipid-raft fraction, where it inactivates Rho (Mammoto et al., 2007). RhoA, associated with actin polymerization and depolymerization, regulates the nuclear translocation of MRTF-A, which is a transcription coactivator of cytoskeletal and/ or focal adhesion genes (Morita et al., 2007). A recent study found that applying cyclic stretching force on skin stem cells induced accumulation of emerin at outer nuclear membrane, whereas its localization was decreased at the inner nuclear membrane. The force-induced redistribution of emerin resulted in the detachment of heterochromatin from the nuclear lamina and promoted local actin polymerization, which reduced nuclear actin, leading to transcription attenuation (Le et al., 2016). Despite many experimental observations of ECM-regulated transcription programs and detailed studies about the signaling pathways involved in the cytoskeletal regulation of gene expressions (Olson and Nordheim, 2010), the mechanisms by which such matrix signals are integrated within the three dimensional (3D) nuclear architecture to elicit modular gene expression programs are unclear. In addition, geometric models to quantitatively describe the spatial organization of chromosomes and its link to gene expression are lacking.
In recent years, the packing of DNA into nonrandom 3D chromosome territories (CTs) has been shown to be a critical intermediate in bringing about spatial dimension to genome regulatory processes (Lanctôt et al., 2007). For example, the relative position of chromosomes is transcription correlated and has been suggested to modulate the coclustering of genes for their coexpression (Bickmore and van Steensel, 2013; Cavalli and Misteli, 2013). Techniques such as fluorescence in situ hybridization (FISH) and chromosome conformation capture assays and models have revealed that active genes either in-cis or -trans cluster in specific spatial regions inside the nucleus (Branco and Pombo, 2006; Van Steensel and Dekker, 2010). Some of these include erythroid-specific immunoglobin genes (Osborne et al., 2004), the Hox cluster (Noordermeer et al., 2011b), and the NF-κB regulated cluster (Fanucchi et al., 2013; Jin et al., 2013). Because alterations in cell geometry inherently result in changes in nuclear morphology and chromatin condensation (Versaevel et al., 2012), we hypothesize that matrix signals could induce transcription-dependent 3D CT reorganization, which would serve as a structural intermediate to facilitate ECM constraint–responsive expression programs.
A geometric model of the 3D chromosome arrangement as an ellipsoid packing, in which the interphase chromosomes are approximated by ellipsoids, has been proposed (Uhler and Wright, 2013). Whereas sphere-packing and sphere-covering problems have been a popular area of study in discrete mathematics over many years (Rogers, 1964; Conway and Sloan, 1998), ellipsoid packing problems have only recently become popular due in part to colorful experiments involving the packing of M&Ms (Donev et al., 2004). Typically, packing problems are concerned with how uniform objects can be packed without overlap into a larger container or into a space of infinite extent with maximum density. However, chromosomes are of different sizes, and a certain amount of overlap, that is, intermingling of the chromosomes, is possible and biologically important. This problem was addressed by developing an algorithm for finding minimal overlap configurations of nonuniform ellipsoids (Uhler and Wright, 2013).
In this study, we combined experiments and ellipsoid packing models to elucidate the correlations between cell geometry on 3D organization of CTs and gene expression. First, we used microfabricated-patterned substrates together with chromosome FISH experiments to probe the role of cell geometry on the spatial organization of CTs in NIH 3T3 fibroblasts. Then we performed a microarray analysis to correlate CT organization with gene expression. This combined analysis revealed that cell geometry alters the transcription-correlated radial position of specific CTs, as well as the intermingling degree between specific CT pairs. In addition, we found that increase in the intermingling degree requires the presence of Pol II S5P. To further probe the role of cell geometry on the spatial organization of CTs, we modeled chromosome arrangements as minimal overlap configurations of ellipsoids (the CTs) inside an ellipsoidal container (the cell nucleus) and analyzed the consequences of altering cell geometry on CT packing. Chromosome orientation analysis in experiments and models uncovered that CT pairs tend to align with the stretching axis of the ECM. In addition, these aligned CT pairs exhibit a higher intermingling degree and are more sensitive to changes in cell geometry. Taken together, our experimental observations and modeling efforts reveal a previously unrecognized correlation between cell geometry–dependent CT repositioning and cellular genomic programs.
RESULTS
Cell geometry influences the normalized volume and the normalized radial distance of chromosomes
NIH 3T3 cells were cultured on glass slides with fibronectin micropatterns. Micropatterns were either anisotropic (AP) rectangular (aspect ratio 1:5, area 1800 μm2) or isotropic (IP) circular (area 500 μm2) substrates (Supplemental Figure S1A). The size of AP patterns is similar to the physiological spreading area of NIH 3T3 cells on fibronectin (1300 ± 30 μm2; Jain et al., 2013), whereas IP patterns were used to relax the prestress experienced by cells in AP patterns. Cells on AP substrates have long actin stress fibers and more-flattened, elongated nuclei, whereas cells on IP substrates have short actin filaments and more-spherical nuclei (Figure 1A and Supplemental Figure S1, B and C). Concomitant with reduction in nuclear volume, chromatin is more condensed in IP substrates as analyzed by Hoechst staining (Supplemental Figure S1D). The reasons for more-condensed chromatin in IP cells were primarily that 1) the cells attached to a smaller contact area in IP substrates, 2) there was reduced actomyosin contractility, and 3) there was histone deacetylase 3 (HDAC3)–dependent condensation of chromatin, leading to the decrease in nuclear volume (Jain et al., 2013). We assessed the consequences of cell geometry changes on the spatial organization of chromosomes using FISH by painting 12 representative CTs covering a wide range of chromosome lengths and gene densities. Images of CTs were subsequently segmented, and the 3D volume was measured for all painted CTs (Supplemental Figure S1E; see Materials and Methods). Because most CTs are smaller in IP substrates due to the smaller nuclear volume (Supplemental Figure S1C), we computed the normalized CT volume with respect to nuclear volume: chromosomes (Chrs) 2, 4, and 15 showed an increased normalized volume, whereas Chrs 3, 5, and 9 showed a decreased normalized volume in IP substrates, compared with those in AP substrates (Figure 1, B and C). However, the normalized chromosome volume is not necessarily related to chromosome size. It also depends on the compaction states of chromosomes and their posttranslational modifications of histones.
FIGURE 1:

Cell geometry influences the normalized volume and the normalized radial distance of chromosomes. (A) Imaris-generated surface plot for confocal images of the nucleus, with 3D representative Chr 2. Scale bar, 5 μm. (B) Representative images showing radial distance of specific CTs with different normalized chromosome volumes. (C) Quantification of chromosome volume normalized to nuclear volume for 12 CTs. Data are presented as mean ± SE with 50 < n < 80. ***p < 0.001, **p < 0.01, *p < 0.05. Mann–Whitney U test. (D) Schematic description of radial distance measurement, where d refers to the distance between two points. (E) Bar graph showing the radial distance of the painted CTs. Data are presented as mean ± SE with 50 < n < 80. **p < 0.01, * p < 0.05. Mann–Whitney U test. Experiments were performed in triplicate.
In addition, we computed the normalized radial distance of each CT centroid to the nucleus centroid as depicted in Figure 1D and explained in Materials and Methods. We found that Chrs 1, 2, and 11 significantly decreased radial distances, and Chr 3 increased radial distance, in IP substrates compared with those in AP substrates, whereas all other chromosomes did not alter their radial positions between the two substrates (Figure 1E and Supplemental Figure S2). Furthermore, a combined analysis of Figure 1, C and E, shows that most CTs with larger normalized volume in IP substrates have smaller radial distance (i.e., are positioned toward the nucleus centroid) and vice versa (Figure 1, B–E, and Supplemental Figure S13A). These results suggested that cell geometry induced specific changes in the radial position of CTs and their volume. Therefore we next analyzed its consequences for transcription activity.
Changes in radial positions are accompanied by differential transcriptional activity
Biochemical analyses and superresolution imaging have shown that transcriptionally active chromatin is less compacted (Nelson et al., 2006; Berger, 2007; van de Corput et al., 2012; Wang et al., 2014). To assess further the level of chromatin compaction, we measured the chromosome decompaction factor, defined as the normalized volume of 1 mega–base pair (Mbp) of DNA sequence (Figure 2A; see Materials and Methods). As expected, the chromosome decompaction factor was found to be negatively correlated with radial distance (Figure 2B and Supplemental Figure S13, C and D). To investigate the coupling between decompaction and transcription activity, we carried out immunofluorescence analysis of an active transcription marker, S5 phosphorylated RNA pol2 (Pol II S5P), together with chromosome FISH for Chrs 1–3 and 11 (Figure 2C and Supplemental Figure S3A). Note that the immunofluorescence images of Pol II S5P presented here were after thresholding, in order to clearly indicate the spatial localization of Pol II S5P. The percentage (10–20%) represents the fraction of Pol II S5P on each chromosome with respect to the total Pol II S5P throughout the nucleus. The distribution of Pol II S5P inside the nucleus without chromosome FISH is shown in Supplemental Figure S3B. The level of Pol II S5P on each CT was positively correlated with decompaction factor (Figure 2D), suggesting that less-compacted chromosomes tend to be more transcriptionally active. Consistent with this, interior chromosomes tend to have a higher level of Pol II S5P (Figure 2E). Supporting this, Chrs 1–3 and 11, which showed an altered radial distance by cell geometry change, exhibited the corresponding transcription activity changes (Figure 2C). Whereas recent studies have highlighted the importance of physical contacts between CTs for gene coregulation (Fullwood et al., 2009; Schoenfelder et al., 2010; Noordermeer et al., 2011a; Fanucchi et al., 2013), our careful analysis of Pol II S5P levels together with chromosome staining revealed clusters of Pol II S5P located at the surface of CTs (Figure 2C and Supplemental Figure S4). These pol2 clusters may be involved in the coregulation of genes residing in the intermingling regions between different chromosomes.
FIGURE 2:

Changes in radial position were accompanied by differential transcription activity. (A) Schematic description of chromosome decompaction factor measurement, where Norm_VCT refers to the normalized chromosome volume, and LCT refers to chromosome length. (B) Scatter plot between radial distance and decompaction pooled from CTs. Data are presented as mean ± SE with 50 < n < 80. (C) Representative images showing the level of Pol II S5P at the surface of Chrs 1–3, 11, and 5. Dot plot quantifying the level of Pol II S5P on Chrs 1–3, 11, and 5. Data are presented as mean ± SD with 50 < n < 80. ***p < 0.001, **p < 0.01. Mann–Whitney U test. (D) Scatter plot between the fraction of Pol II S5P and decompaction of CTs. Data are presented as mean ± SE with 50 < n < 80. (E) Scatter plot between radial distance and the level of Pol II S5P, pooled from CTs. Data are presented as mean ± SE with 50 < n < 80. Experiments were performed in triplicate.
Cell geometry induces differential intermingling degrees between specific chromosomes
To analyze the intermingling degrees between chromosomes, we painted 10 CT pairs that were selected for their potential for coregulation of genes based on previous microarray data for these two cell geometries (Jain et al., 2013; Supplemental Figure S5A). In these images, we quantified the intermingling degree between pairs of CTs by the intermingling volume normalized by the CT volume as explained in Figure 3A and Materials and Methods. Of interest, we found that chromosomes that intermingled more tend to locate at the interior of the nucleus and were less compacted (Figure 3, D and E, and Supplemental Figure S13B). To test the role of cell geometry on chromosome intermingling, Supplemental Figure S5C shows global differences in intermingling in response to changes in cell geometry. In particular, the pairs Chrs 2/6, 2/10, and 11/15 show a significantly increased intermingling degree, whereas the pair Chrs 5/9 shows a significantly decreased intermingling degree in IP substrates compared with those in AP substrates (Figure 3, B and C, and Supplemental Figures S5B and S6A). We further show that enhanced polymerization of actin by jasplakinolide in IP substrates did not alter the nuclear morphology or the degree of intermingling between Chrs 5 and 9 (Supplemental Figure S6, B and C). These results show that cell geometry affects intermingling degrees between specific chromosomes. We next investigate the geometric factors determining the specificity in chromosome intermingling.
FIGURE 3:

Cell geometry induces differential intermingling degrees between specific chromosomes. (A) Schematic description of intermingling degree measurement, where V refers to the volume of one homologous or heterologous chromosome or the intermingling regions between two heterologous chromosomes. (B) Scatter plot of intermingling degree between AP and IP substrates. The labeled pairs showed significant difference in intermingling degree between the two geometric constraints. Data are presented as mean ± SE with 20 < n < 30. ***p < 0.001, **p < 0.01, *p < 0.05. Mann–Whitney U test. (C) Representative images showing the intermingling degree of CT pairs (Chrs 2/6, 5/9, 11/15, and 2/10) with averaged radial distance. (D) Imaris-generated surface plot for confocal images of nucleus, with 3D representative Chr 2 (green) and Chr 6 (purple). Scale bar, 5 μm. (E) Scatter plot between averaged radial distance and intermingling degree of CT pairs. Data are presented as mean ± SE with 20 < n < 30. Inset, bar graph quantifying Pearson correlation coefficient (PCC) between averaged radial distance and intermingling degree. p = 0.08. N.S, not significant. Experiments were performed in triplicate.
Chromosome orientations correlate with the changes in specific intermingling regions
First, we analyzed the effect of nuclear sphericity on CT orientation by measuring the angles between the long axis of each CT and the elongated mechanical axis of the nucleus as explained in Figure 4, A–C, and Materials and Methods. Of interest, we found that in both cell geometries, the CTs were preferentially oriented along the elongated mechanical axis of the nucleus in their xy- and xz-projections (Supplemental Figure S9, A–D). The black peak at small γxz in AP substrates may be due to low z resolution (Supplemental Figure S9D). More precisely, in flattened and elongated AP nuclei, the CTs preferably oriented along the major x-axis of the nucleus (Figure 4, A and D), whereas in spherical IP nuclei, the CTs preferentially oriented along the z-axis of the nucleus (Figure 4, B and E).
FIGURE 4:

Chromosome orientation correlates with the specificity in intermingling changes. (A, B) Imaris-generated 3D surface plots of nucleus and chromosomes in AP and IP substrates. White double-headed arrows indicate mechanical axis of the nucleus. (C) Schematic description of γx and γz measurement. (D) Distribution of γx for all the painted chromosomes. Inset, bar graph quantifying γx. Data are presented as mean ± SD with 1000 < n < 1500. ***p < 0.001. Mann–Whitney U test. (E) Distribution of γz for all of the painted chromosomes. Inset, bar graph quantifying γz. Data are presented as mean ± SD with 1000 < n < 1500. ***p < 0.001. Mann–Whitney U test. (F, G) Imaris-generated 3D surface plot of nucleus and chromosomes. (H) Scatter plot between intermingling degree and the average γx of the two chromosomes in a pair in AP substrates. Each data point reflects the mean value of multiple analyzed cells. (I) Scatter plot between intermingling degree and the average γz of the two chromosomes in a pair in IP substrates. Each data point reflects the mean value of multiple analyzed cells. (J) Scatter plot between the intermingling change and the average γz of the two chromosomes in a pair in IP substrates. Each data point reflects the mean value of multiple analyzed cells. (K) Scatter plot between the intermingling change and the average γx of the two chromosomes in a pair in AP substrates. Each data point reflects the mean value of multiple analyzed cells. Experiments were performed in triplicate.
Whereas mapping of CTs revealed different trends in CT orientations in the two geometries, analysis of individual CTs showed preferential orientations for different CTs in a given geometry (Figure 4, F and G, and Supplemental Figure S9E). Next we tested the relationship between chromosome orientation and intermingling. In AP substrates, there was a negative correlation between γx and intermingling degrees (Figure 4, F and H), suggesting that chromosomes that were preferentially oriented along the mechanical axis of the nucleus intermingled more. This was further confirmed in IP substrates with a new mechanical axis, which revealed a negative correlation between γz and intermingling degrees (Figure 4, G and I). We then compared the effect of cell geometry changes on intermingling degrees with respect to CT orientation. Remarkably, we found that intermingling changes are related to CT orientation in the two cell geometries (Figure 4, J and K). More precisely, the CT pairs Chrs 2/6, 2/10, and 11/15 that are most aligned along the z-axis in IP substrates show the largest intermingling decrease in AP substrates (Figure 4J). This suggests that chromosomes that align with the mechanical axis are sensitive to cell geometry change. This was confirmed by comparing intermingling change with respect to the angular CT orientations γx in AP substrates (Figure 4K).
Coupling between chromosome reorganization and transcriptome change
To interrogate systematically the coupling between chromosome reorganization and transcriptome change, we performed new microarray experiments (similar to the method described in Jain et al., 2013) by isolating RNA from NIH 3T3 cells cultured on anisotropic and isotropic substrates for 3 h. Raw microarray data were background corrected, normalized, and summarized using the robust multiarray average (RMA) method implemented in the oligo package in R. The chromosome information of each gene was obtained from the National Center for Biotechnology Information (NCBI) database (www.ncbi.nlm.nih.gov/gene/). After this, we calculated the transcriptional activity of each chromosome by calculating the z-score of each gene across two conditions in triplicate and then summing the z-scores of genes located on one chromosome, defined as
 |
where genek denotes the kth gene on chromosome (i). The summarized z-score of genes on each chromosome reflects the transcription activity level of this chromosome and eliminates the bias from genes with high expression level. We plot an activity heat map of 19 chromosomes in both geometries, where in each geometry the activity values of 19 chromosomes is centered to have mean 0 and scaled to have SD 1 (Supplemental Figure S10). This step normalizes the transcription activity of each chromosome to the averaged activity of all 19 chromosomes, which corresponds to the normalization of chromosome radial distance. In this way, we found that chromosomes located relatively more toward the nuclear periphery in IP substrates had lower transcription activity and vice versa (Supplemental Figure S 11, A and B). Such correlative changes were lost in a randomized chromosome activity heat map, which was obtained from iterative swapping of chromosomes by shuffling the rows of the chromosome activity heat map for 200 iterations, suggesting that the correlation between chromosome activity and 3D position is nonrandom (Supplemental Figure S 11, C and D).
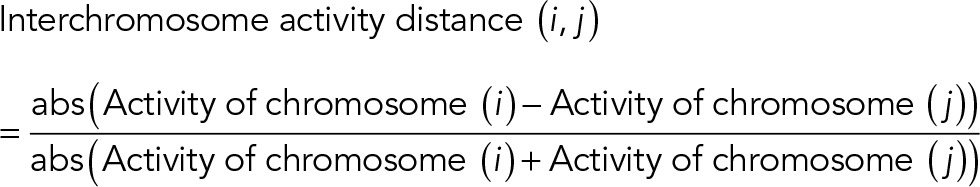
To investigate further whether the geometry-dependent intermingling change was also coupled with transcription activity change, we defined interchromosome activity distance as
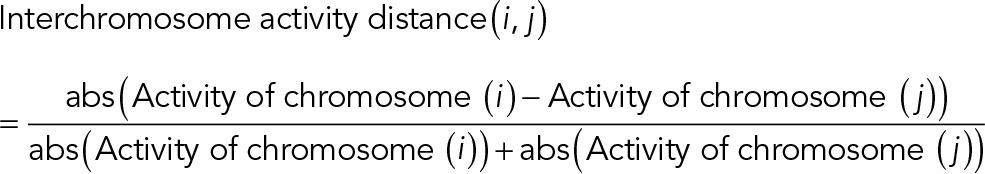 |
A smaller interchromosome activity distance reflects larger similarity of transcription activity between two chromosomes, implying more coregulated genes (Iyer et al., 2012). The heat map of interchromosome activity distance reveals a global alteration of transcription configurations between AP and IP substrates (Supplemental Figure S 11E). Of interest, a change of activity similarity induced by cell geometry change negatively correlates with the change of intermingling (Supplemental Figure S 11F). Such correlation was lost between randomized interchromosome activity distance and intermingling change (Supplemental Figure S 11, G and H). In particular, Chrs 5/9, which significantly decreased intermingling in IP substrates, showed increased activity distance, whereas Chrs 2/6 and 2/10, which significantly increased intermingling in IP substrates, showed decreased activity distance (Supplemental Figure S11F), suggesting more coregulated genes.
In addition, microarray data also revealed that, compared with polarized cells in AP substrates, rounded cells in IP substrates exhibited higher expression of NF-κB–regulated genes and lower expression of SRF/MRTF-A–regulated genes (Supplemental Figure S12, A and C). In particular, on Chrs 2/6, NF-κB target genes such as II1a, Tgm2, Olr1, and Mmp9 were up-regulated. On Chrs 2/10, Tnfaip3, II1a, Tgm2, Mmp9, Bcl2l1, and Ptgds were up-regulated. On Chrs 11/15, Myc, Pdgfb, Stat5a, Ccl4, Rel, and Csf3 were up-regulated. On Chrs 5/9, SRF/MRTF-A target genes such as Serpine1, Tagln, Steap1, and Bmp2k were down-regulated (Supplemental Figure S12, B and D).
Changes in intermingling degree correlate with level of active transcription markers
We next labeled Pol II S5P together with CT pairs and computed the mean value of Pol II S5P in the intermingling regions as well as in the complete CT regions. We found that chromosome intermingling regions were enriched with Pol II S5P (Figure 5, A and B). Of interest, the level of Pol II S5P 2 correlated with differential degrees of intermingling imposed by cell geometry (Figure 5C). To further confirm this, we treated cells with α-amanitin, a transcription inhibitor, and analyzed the intermingling between a pair of chromosomes (Chrs 11/15) both in AP and IP substrates. Consistent with a previous study (Branco and Pombo, 2006), Chrs 11/15, which had larger intermingling volume in IP substrates, decreased its intermingling degree upon transcription inhibition. However, AP substrates, where Chrs 11/15 had smaller intermingling volume, did not show a significant difference after transcription inhibition (Supplemental Figure S7, A and B). Both studies confirmed that for chromosomes that had largely intermingled before α-amanitin treatment, inhibition of transcription could decrease intermingling degree, suggesting that transcription is necessary for extensive intermingling between chromosomes.
FIGURE 5:
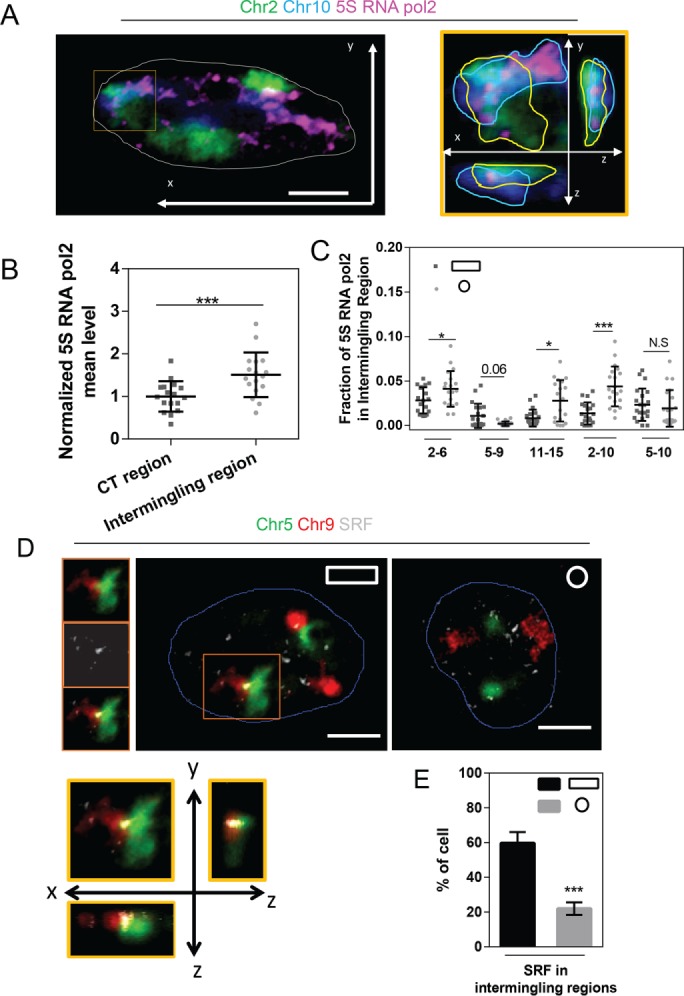
Intermingling change is correlated with gene coregulation. (A) Chromosome paint combined with immunofluorescence staining of Chr 2 (green), Chr 10 (blue), and Pol II S5P (pink) with the nuclear outline (white) in the xy-plane. Scale bar, 5 μm. Right, orthogonal view of the cropped region outlined by the orange box. Dotted outlines depict the edges of each chromosome. (B) Dot plot showing the mean intensity of Pol II S5P in CT regions and intermingling regions. Data are presented as mean ± SD with 15 < n < 20. ***p < 0.001. Two-sample Student’s t test. (C) Dot plot showing the different fraction of Pol II S5P in the intermingling regions between Chrs 2/6, 5/9, 11/15, 2/10, and 5/10. Data are presented as mean ± SD with 20 < n < 30. ***p < 0.001, *p < 0.05. N.S, not significant. Mann–Whitney U test. (D) Chromosome paint combined with immunofluorescence staining of Chr 5 (green), Chr 9 (red), and SRF (gray) with the nuclear outline (blue) in the xy-plane. Scale bar, 5 mm. Left, Chr 5 (green), Chr 9 (red), and SRF (gray) from the cropped region with an orange box. Right, orthogonal view of the cropped region outlined by the orange box. (E) Bar graph showing the percentage of cells with SRF signals presenting in the intermingling regions. Data are presented as mean ± SE with n = 3. ***p < 0.001. Two-sample Student’s t test. Experiments were performed in triplicate.
Whereas microarray data showed lower expression of SRF/ MRTF-A target genes in IP substrates, IP substrates show reduced nuclear localization of serum-responsive transcription cofactor MRTF-A and increased nuclear localization of p65 (Supplemental Figure S8). We analyzed a specific chromosome pair, namely Chrs 5/9, which harbors serum-responsive genes and has lower activity and less intermingling in IP substrates. Immunostaining of serum-responsive factor (SRF) together with Chrs 5/9 revealed that ∼60% of nuclei were enriched with SRF clusters in the intermingling regions in AP substrates, whereas only ∼20% were enriched in IP substrates (Figure 5, D and E). Our recent study also showed that the intermingling regions contained SRF target gene Zyxin and that the SRF clusters within these intermingling regions colocalized with Pol II S5P (Maharana et al., 2016). These results reveal that alterations in intermingling degrees by cell geometry are tightly coupled with differential expression of specific genes.
Collectively our experiments show a strong correlation between cell geometry, chromosome reorganization in radial positions and orientations, intermingling degrees, and global changes in transcription. In the next section, we develop a geometric model, based on ellipsoid packing, to analyze the coupling between cell geometry and chromosome reorganization and its dependence on transcription.
Ellipsoid packing models predict cell geometry–specific CT orientations and their neighborhoods
To describe quantitatively experimental realizations of chromosome arrangements and predict their repositioning under nuclear shape alterations, we developed a geometric model of chromosome organization and gene expression. We model the spatial organization of chromosomes in the cell nucleus as a minimal overlap arrangement of ellipsoids of a given size and shape (the chromosomes) into an enclosing container (the cell nucleus) under spatial constraints given by the gene expression pattern. This allows us to predict the 3D organization of chromosomes when altering the cell geometry by solving a constrained optimization problem.
Given a configuration of ellipsoids, we compute a vector consisting of all weighted (by expression similarity) pairwise overlaps of the 60 ellipsoids, the total number of chromosomes in a triploid NIH 3T3 cell. We score the configuration by the maximum entry of this vector, that is, the maximum weighted pairwise overlap between any two chromosomes. Starting in a random configuration of ellipsoids, our algorithm iteratively produces new ellipsoid configurations whose scores are reduced at each step and converge to a weighted minimal overlap configuration that represents the preferential chromosome neighborhoods (see Materials and Methods). Such a weighted minimal overlap packing is shown in Figure 6A. The algorithm then deforms the nucleus stepwise into the shape taken in IP substrates and computes the respective minimal overlap configurations (Figure 6B). Supplemental Movie S1 shows the various steps of the algorithm when performed in two dimensions with 10 enclosed ellipses.
FIGURE 6:
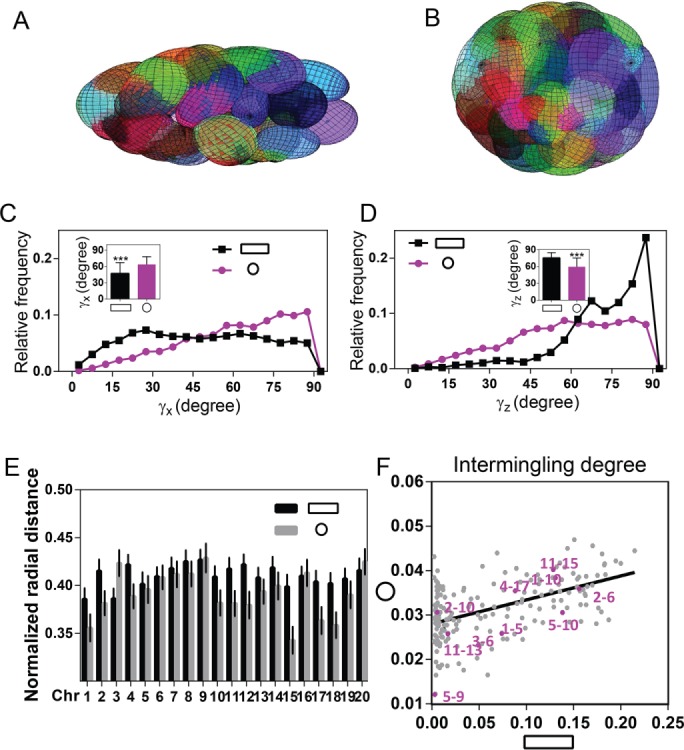
Ellipsoid packing models predict cell geometry–specific CT orientations and new neighborhoods. (A, B) Examples of optimal configurations of chromosomes modeled as ellipsoids packed into the ellipsoidal nucleus in AP and IP geometries, respectively. (C, D) Distribution of γx and γz, respectively, in the simulations for AP and IP geometries (*** p < 0.001, Mann–Whitney U test). (E) Radial distance distributions obtained from the simulations in AP and IP geometries. (F) Scatter plot of intermingling degree between AP and IP geometries in simulations; the purple pairs represent the experimentally measured chromosome pairs. Simulations were performed in triplicate.
Because the experiments established the importance of angular orientation of the chromosomes for intermingling and gene expression, we analyzed the angular distribution in the simulations. Figure 6, C and D, shows the distributions in γx and γz, respectively, obtained from the simulations. These distributions are qualitatively in agreement with the experimental trends (Figure 4, D and E), demonstrating that nucleus shape combined with chromosome activity is able to predict the angular distributions of the chromosomes.
Next we analyzed radial distance in ellipsoidal and spherical nuclei (Figure 6E). Compared to the experimental results in Figure 1E, the average radial distance values show less variability overall. Of interest, however, on altering cell shape from ellipsoidal to spherical cell nucleus, the radial distance values exhibit the same behavior as in the experiments. For example, Chrs 1, 2, 11, and 17 are found more toward the center of the nucleus in spherical cell nuclei, that is, IP substrates, compared with AP substrates, whereas Chr 3 exhibits the opposite behavior. In addition, in concordance with the experimental observations, Chrs 5, 6, 9, and 13 do not change radial distance when cell shape is altered. Finally, the remaining Chrs 4, 10, and 15 show the same trend as in experiments but give more pronounced results in the simulations.
To analyze the predictive power of this geometric model of chromosome organization, we further analyzed the changes in intermingling degrees when altering cell shape (Figure 6F). Here the simulations do not include any chromosome activity similarity weighting for the spherical cell nuclei. As a consequence, the values of intermingling degree for different chromosome pairs in spherical nuclei are similar in size and cover only a small range. Remarkably, the geometric model is able to predict the new neighborhoods and interactions between chromosomes. In agreement with the experimental results, the pair Chrs 5/9 shows minimal intermingling in ellipsoidal as well as in spherical cell nuclei, the pair Chrs 11/15 shows a significantly increased overlap in spherical cell nuclei compared with ellipsoidal cell nuclei, the pair Chrs 2/10 does not show overlap in ellipsoidal nuclei but does overlap in spherical nuclei, and the pair Chrs 2/6 shows a high intermingling degree in ellipsoidal as well as in spherical cell nuclei. These results suggest that with optimized chromosome arrangements, changes in nuclear shape can predict new chromosome orientations, radial position, and their neighborhoods.
DISCUSSION
The role of extracellular matrix on gene expression was proposed more than three decades ago (Bissell et al., 1982), and various studies to understand the underlying mechanisms have been performed. For example, in mouse mammary epithelial cells expressing high level of β-casein, a 160–base pair transcriptional enhancer (BCE1) within the 5′ flanking region of the β-casein gene was identified to be responsive to ECM-dependent regulation (Schmidhauser et al., 1992; Myers et al., 1998). At the level of chromatin organization, culturing cells on ECM with different components resulted in changes in exposure and sequestration of AluI-sensitive sites. In addition, direct disruption of the cytoskeleton induced the exposure of AluI-sensitive sites on chromatin, suggesting the role of ECM and cytoskeleton on chromatin organization (Maniotis et al., 2005). Further, the global level of histone acetylation was regulated by cell shape in human mammary epithelial cells and mouse fibroblasts (Le Beyec et al., 2007; Jain et al., 2013). Various transcription regulators were also identified to be responsive to ECM or cytoskeleton. For instance, in mammary cells, detachment of cells from their matrix led to the activation of STAT5, a signal transducer and activator of transcription protein 5, for β-casein transcription (Xu et al., 2009). Other transcription regulators include YAP/TAZ (Dupont et al., 2011), MRTF-A (Vartiainen et al., 2007), and NF-κB (Hayden and Ghosh, 2008; Fazal et al., 2009) regulated by RhoGTPase activity and tension of actomyosin contractility. Extracellular remodeling leads to differential ratios of F/G-actin. Nuclear actin in the form of either G- or F-actin has been shown to be involved in transcription regulation (Gieni and Hendzel, 2009; Zheng et al., 2009), as nuclear actin is a component of three types of RNA polymerases, and it also contributes to ATP-dependent chromatin remodeling. In addition, work from our lab has shown that cytoskeletal reorganization, induced by either small interfering RNA knockdown of cytoskeleton components or cell geometric constraints, leads to differential gene expression patterns. During this process, core histone protein mobility, nuclear localization of HDAC3, and specific transcription factors/cofactors were significantly affected (Jain et al., 2013; Ramdas and Shivashankar, 2015). Transcription-dependent chromosome intermingling was recently proposed as a mechanism to achieve nonrandom chromosome positioning in terminally differentiated cells (Maharana et al., 2016).
Although previous studies identified various mechanical transducers for transcription regulation using bottom-up approaches, we proposed the role of 3D chromosome position as a critical intermediate in altering gene expression by cell geometry. The experimental and modeling results suggest that changes in cell geometry drive chromosome reorientation and 3D radial repositioning, thus creating new neighborhoods and RNA Pol II–assisted chromosomal contacts. Nuclear shape changes result in chromosome reorientation and repositioning due to mechanical constraints as well as by differential lamin A/C levels regulated by cell geometry (Makhija et al., 2016). Because cell geometry was also shown to compartmentalize specific transcription factors (Supplemental Figure S8), we speculate that this could coordinate with chromosome repositioning as a combined mechanochemical control of cell shape–specific gene expression programs.
In this study, we uncovered a previously unrecognized role of cell geometry in repositioning and reorienting chromosome territories, particularly those aligning with the mechanical axes, to effect intermingling between specific chromosomes and their functional coupling with their transcription activity. Our results show that cell geometry induces cytoskeleton reorganization, leading to nuclear morphology remodeling (Figure 7A), which affects the orientation, 3D radial position, compaction, and intermingling of CTs (Figure 7B). These spatial repositionings of the CTs were accompanied by alterations in their transcriptional activity (Figure 7C). More precisely, intermingling increase is associated with recruitment of Pol II S5P, which is located in pockets within the intermingling regions, and such recruitment is necessary for intermingling. Although it has been shown that chromosomal contact facilitates coexpression of a group of genes (Fanucchi et al., 2013), our study highlights the importance of geometric constraints to alter the positioning of CTs and formation of new chromosomal contacts and their functional coupling with the modulation of genomic programs. Previous studies showed that restricting cells within a small adhesive island reduces the frequency of DNA replication (Chen et al., 1997), which further affects transcription and chromosome landscape (Chakalova et al., 2005). However, in our study, cells were geometrically confined for 3 h before observation, and hence the contribution from DNA replication was negligible in the geometry-dependent differential gene expression.
FIGURE 7:

Model for 3D chromosome reorganization in facilitating geometry-dependent genome regulation. (A) Cell geometry–induced cytoskeleton reorganization, nuclear morphology remodeling, and alteration of global chromatin compaction. (B) Remodeling of nuclear morphology resulted in the reorientation of individual chromosomes and their radial positions. The orientation of chromosomes correlates with their sensitivity to cell geometry in creating specific new neighborhoods. (C) The new neighborhoods result in the formation of geometry-dependent new chromosomal contacts with the help of Pol II S5P for differential gene expressions.
Of importance, our results reveal that CTs are sensitive to the mechanical axis of the cell: when changing from IP to AP substrates, CT pairs that orient along the z-axis in IP substrates (e.g., Chrs 2/10, 2/6, and 11/15) are repositioned toward the nuclear periphery and more compacted, intermingle less with other CTs, and recruit less Pol II S5P in the intermingling regions. However, CT pairs that deviate most from the z-axis in IP substrates (Chrs 5/9) relocate toward the interior of the nucleus, are less compacted, intermingle more with each other, and recruit more Pol II S5P.
Although chromosome conformation capture models have been successful in describing the configurations in chromatin-folding and activity-dependent genome-wide contacts, our geometric model can be used to analyze the coupling between chromosome packing, orientation of the CTs, intermingling, and gene expression. When weighting the overlap by chromosome activity similarity, the resulting simulated CT arrangements showed a correlation of 0.99 between intermingling degree and chromosome activity similarity in ellipsoidal nuclei. This correlation reduces to 0.44 in spherical cell nuclei arising due to formation of new CT angular orientations and intermingling degree, suggesting that cell shape alterations lead to drastic changes in CT neighborhoods. Most importantly, without any information about chromosome activity similarity in spherical cell nuclei, our model is able to predict the qualitative changes in radial distance, angular distributions, and intermingling degree when going from AP to IP substrates in experiments.
Under normal ECM conditions, cells maintain a nuclear mechanical homeostasis and fix a particular CT orientations and organization that is optimized for the specific gene expression program. Alterations in matrix signals can lead to a number of diseases, including fibrosis and tumor initiation and progression (Butcher et al., 2009). Such ECM modulations can also result in induction of mesenchymal-to-epithelial transition or formation of cancer-associated fibroblasts (Augsten, 2014). These transdifferentiation programs involve the remodeling of cytoskeletal organization and thus nuclear morphology. These changes lead to the reorientation and repositioning of CTs and their intermingling, facilitating differential regulation of gene expression. Understanding CT arrangements and the precise link to gene expression patterns across various cell types (Parada et al., 2004) could serve as a “zip code” for controlling gene expression, leading to interesting applications for cell reprogramming using geometric constraints.
MATERIALS AND METHODS
Cell culture and micropatterning
NIH 3T3 fibroblast cells were cultured in low-glucose DMEM (Gibco, Grand Island, NY) supplemented with 10% fetal bovine serum (FBS; Life Technologies) and 1% (vol/vol) penicillin–streptavidin (Gibco) at 37°C in 5% CO2. We seeded 65,000 cells for 10–15 min on fibronectin-coated microfabricated patterns, the preparation of which was described in previous work from our lab (Jain et al., 2013). Nonadhered cells were removed, and the remaining cells were washed once with DMEM and incubated for 3 h at 37°C in 5% CO2. To quantify the copy number variations in our experiments, we performed metaphase spreads as shown in Supplemental Figure S14. We established that, on average, each cell contains ∼64 (SD = 5) chromosomes. In addition, with similar copy number variation, we analyzed two geometric states of the cells to deduce our major conclusions. Therefore the variability in chromosome copy number and/or length in these experiments had minimal influence on the overall statistics of the measurements. To make sure that cells were not in different cell cycle stages, we obtained wide-field images of many DNA-stained cells imaged at the same time in the two geometries. The variation of the intensity histograms is similar in cells grown on both patterns. These results suggest marginal changes in nuclear intensity between cells plated on rectangular and circular patterns (Supplemental Figure S15).
Chromosome FISH and immunostaining on fibronectin-coated patterns
NIH3T3 cells were cultured for 3 h on fibronectin-coated microfabricated patterns that were printed on cleaned glass slides previously spin-coated with polydimethylsiloxane. For the transcription inhibition experiment, 40 μg/ml α-amanitin (Sigma-Aldrich) was added to patterned cells, which were treated at 37°C in 5% CO2 for 3 h. For the jasplakinolide treatment experiment, 500 nM jasplakinolide (Sigma-Aldrich) was added to patterned cells for 30 min. Cells were then washed with 1× phosphate-buffered saline (PBS) to remove cell culture medium, followed by incubation on ice for 5–8 min with 0.25% Triton in CSK buffer (100 mM NaCl, 300 mM sucrose, 3 mM MgCl2, 10 mM 1,4-piperazinediethanesulfonic acid, pH 6.8). Cells were then fixed with 4% paraformaldehyde (PFA) for 10 min and briefly rinsed with 0.1 M Tris-HCl, followed by 1× PBS wash. This was followed by permeabilization with 0.5% Triton for 10–15 min. Overnight incubation in 20% glycerol at 4°C and then five or six freeze–thaw cycles in liquid nitrogen followed. After this, cells were washed with 1× PBS a few times before and after treatment with 0.01% HCl for 5–10 min, followed by digestion with 0.002% porcine pepsin (Sigma-Aldrich) in 0.01 N HCl at 37°C for 4 min. Cells were then fixed with 1% PFA for 4 min and briefly rinsed in 1× PBS before being treated with RNase (Promega; 200 μg/ml made in 2× saline-sodium citrate [SSC]–0.3 M sodium chloride and 30 mM trisodium citrate) at 37°C for 15–20 min. The cells were then washed with 2× SSC and equilibrated in 50% formamide/2× SSC (pH 7.4) overnight at 4°C. Hybridization was set up the next day. Chromosome paints (Chrombios, Germany) tagged with different fluorophores were thawed to room temperature and mixed with hybridization buffer provided by the supplier. Cells were denatured in 50% formamide/2× SSC at 85°C for 2–3 min and then incubated with the fluorescently labeled mouse chromosome FISH probe mix; the slides were then sealed with a Sigmacote (Sigma-Aldrich)-coated hydrophobic coverslip and rubber cement for incubation overnight in a moist chamber at 37°C with shaking. Chromosomes were pairwise painted, and 10 representative pairs were selected for analysis: Chrs 1/10, 5/10, 17/4, 11/13, 2/6, 2/10, 1/5, 11/15, 5/9, and 3/6. At the end of the incubation period, slides were washed thrice each in 50% formamide/2× SSC at 45°C and 0.1× SSC at 60°C. After the last stringent wash with the 50% formamide made in 0.1× SSC at 45°C, the nuclei were blocked in 5% BSA solution made in 2× SSC and then subjected to primary and the secondary antibody diluted in 5% BSA solution made in 2× SSC. If indirect labels such as chromosome probes conjugated with biotin or digoxigenin [DIG] were used during hybridization, the detection step also involved the use of fluorophore-labeled streptavidin/avidin anti-DIG. The primary antibodies used were RNA Polymerase II CTD repeat YSPTSPS (phospho S5; 1:500; ab5131; Abcam), SRF (sc-335; 1:100; Santa Cruz Biotechnology), and mouse monoclonal [21H8] to DIG (1:500; ab420; Abcam). Finally, cells were counterstained with Hoechst 33342 (Sigma-Aldrich) for 10 min and then mounted with Prolong Gold antifade mounting medium (Life Technologies), sealed with a coverslip, and imaged.
Effect of fixation on 3D chromatin organization
NIH 3T3 fibroblasts stably expressing H2B-EGFP were grown in DMEM (Life Technologies) supplemented with 10% (vol/vol) FBS (Life Technologies) and 1% penicillin–streptomycin (Life Technologies) and maintained at 37°C in a humidified atmosphere with 5% CO2. Trypsinized cells were seeded on uncoated dishes (Ibidi) at a concentration of ∼15,000 cells/ml and grown in complete cultured medium overnight. Multiple H2B–enhanced green fluorescent protein (EGFP)–positive nuclei were set as multipoint on a live-imaging microscope stage, and images prefixing and postfixing were acquired using an Nikon A1R using a 100×, 1.4 numerical aperture (NA) oil objective. Before fixing, cells were immersed in 500 μl of culture medium followed by cell fixing, adding an equal volume of 8% PFA (final PFA concentration 4%) for 15 min. The fixation step involved in the FISH preparation did not dramatically affect the 3D chromatin organization (Supplemental Figure S16).
Confocal laser scanning microscope imaging for chromosome FISH samples
Slides for chromosome FISH were scanned using a Nikon A1 confocal microscope with a 100×, 1.4 NA oil objective. For each optical section, images were collected sequentially to minimize cross-talk between different fluorochromes. The pinhole size was set as 1 Airy unit. Stacks of 16-bit grayscale two-dimensional images were obtained with a pixel size of 80 nm in the xy-direction and used for quantitative evaluation. Even though the lower z resolution of the A1R confocal microscope distorts the chromosome morphology from its actual shape, the average radius of a chromosome territory is ∼1.5 μm, much larger than the xy resolution of 200 nm and z resolution of ∼400 nm; hence such resolution limit does not affect the results obtained from these images.
Image analysis
A semiautomated algorithm written in MATLAB (MathWorks) was used to analyze 3D chromosome FISH images, for which both nuclei and chromosomes were manually selected according to the signal distribution on the Z-maximum projected images. Maximum projected masks for nuclei and chromosomes were then generated. This was used to multiply the entire Z-stack of the nucleus and chromosome to remove the background noise, which would undermine the segmentation accuracy. For 3D segmentation, the mean and SD of intensity was computed throughout the entire Z-stack. The criterion for setting a pixel as 1 or 0 was based on the mean ± (SD × a), where a is a value to adjust the criterion. Pixels greater than mean ± (SD × a) were set as 1, and those less were set as 0. The segmentation procedure was monitored by merging the outline of the segmented object with the original object. This resulted in best 3D masking for both nucleus and chromosomes, which is critical for the quantification of the following parameters.
1. Chromosome volume
The absolute chromosome volume was computed by summing the number of pixels within the 3D segmented image of the chromosome. The normalized chromosome volume was computed by dividing the absolute chromosome volume by the absolute nuclear volume.
2. Normalized radial distance
To estimate normalized radial distance of each chromosome, the coordinates for nuclear centroids (O) and chromosome centroids (C1), as well as the nuclear surface, were obtained from 3D segmented images. The distance between chromosome and nuclear centroids was first computed (dOC1). Coordinates for the line passing through the chromosome and nuclear centroids were used to find the intersection point (B1) between the line and the nuclear surface. The distance between nuclear centroids and intersection point was then computed (dOB1). Normalized radial distance was defined as
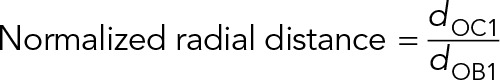 |
3. Chromosome decompaction factor
To estimate the chromosome decompaction factor, the sequence length for all the painted chromosomes was obtained from the NCBI database (ncbi.nlm.nih.gov/genome/guide/mouse/; August 2013). The chromosome decompaction factor was defined as
 |
where Norm_VCT is the normalized chromosome volume and LCT is chromosome length in Mbp.
4. Intermingling degree
To compute the intermingling degree, the intermingling volume (V1&2) between two chromosomes was first estimated. To estimate the intermingling volume, the segmented images of the two chromosomes were multiplied, and only the overlapping region resulted in pixels with value of 1. The number of pixels with value 1 represents intermingling volume. The intermingling degree was then defined as the intermingling volume normalized to the volume of the two chromosomes and their homologues 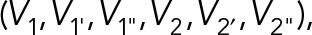 ,
,
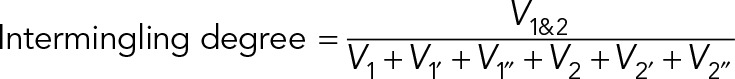 |
5. 3D chromosome orientation mapping
To map all the chromosome 3D orientations in AP and IP substrates, 3D images were projected in the xy- and xz-planes. In the xy-plane, masks for z-maximum projected images of the nucleus were used to find the coordinates for centroid, edges, and the furthermost point on the edge to the centroid. The vector determined by the centroid and the furthermost point on the edge was defined as the long axis of the nucleus. The long axis of the chromosome was defined in the same manner. The xy orientation of a chromosome was defined by the angle between the long axis of the nucleus and the chromosome (γxy). In the xz-plane, masks for y-maximum projected images of nucleus and chromosomes were used in the same manner to compute the xz orientation of chromosomes (γxz). To compute the angle γx or γz, coordinates for the 3D CT surface were obtained, followed by searching on the surface for the point that had the largest distance to the CT centroid. The centroid and the furthermost point on the CT surface determined the vector  . Another vector
  was defined by the nuclear centroid and any point on the line passing through the nuclear centroid and a line parallel to the x- or x-axis. The γx or γz was defined as
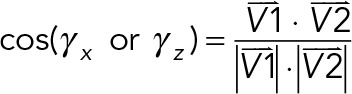 |
6. Pol II S5P distribution on a chromosome
To analyze the spatial distribution of Pol II S5P on a chromosome, images of Pol II S5P were preprocessed by applying a Fourier high-pass filter to remove background noise and highlight the bright features. Subsequently 3D erosion was applied on each chromosome, which divided one chromosome into three shells with the same thickness. The fraction of the bright features for Pol II S5P in each shell was then quantified.
Microarray sample preparation and analysis
To perform whole-genome transcriptome analysis, 65,000 NIH 3T3 cells were seeded on fibronectin-coated substrates for 3 h. Then cells were collected, and RNA was isolated using an RNeasy kit (Qiagen). RNA concentration and purity were determined using an ND-1000 spectrophotometer (NanoDrop, Wilmington, DE), and the integrity of the RNA was verified. Microarray was performed using the Affymetrix chip by ScienceWerke (Singapore). To reduce the noise in gene expression, microarrays were performed in triplicates. Raw microarray data were background corrected, normalized, and summarized using the RMA method implemented in the oligo package in R. The chromosome information of each gene was obtained from the NCBI database (www.ncbi.nlm.nih.gov/gene/). Then the transcriptional activity of each chromosome was calculated by calculating z-score of each gene across two conditions in triplicate and then summing the z-scores of genes located on one chromosome, defined as
 |
where genek denotes the kth gene on chromosome (i). The summarized z-score of genes on each chromosome reflects the transcription activity level of this chromosome and eliminates bias from genes with high expression level.
The interchromosome activity distance was defined as
 |
Statistical analysis
Statistical significance between AP and IP groups was tested using a two-sided Student’s t test when the data followed a normal distribution. Otherwise, the Mann–Whitney test was applied. We repeated experiments for a minimum of three times with large enough sample size n for each repeat to be confident that the reported results are representative.
Modeling
We model the chromosomes by ellipsoids εi, i = 1,…, n, where the half-axis lengths were sampled from a normal distribution centered around the proportions 1:1.54:1.88 as obtained from the experiments with SD equal to 1/10 the mean. The nucleus, that is, the enclosing container, is denoted by Ω and modeled as an ellipsoid whose size is obtained from experiment (2.62 μm × 5.23 μm × 9.09 μm in AP substrate and 3.13 μm × 5.06 μm × 5.96 μm in IP substrate). We approximated the intermingling of chromosome pairs by the largest ellipsoid that can be inscribed into the overlap of the respective ellipsoids and found configurations of ellipsoids that minimize this overlap measure.
To find configurations that reflect a cell type–specific gene expression pattern, we differentially penalized the pairwise overlap, ηij, between the inscribed ellipsoids by their activity distance, Aij. This activity distance can be computed from the activity of each chromosome, denoted by bi, which equals the sum of the expression levels of all genes on that chromosome. Then the activity distance Aij between two chromosomes is defined as a normalized activity distance linking the transcription factor binding and their expression level, namely,
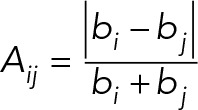 |
Finding configurations that reflect a cell type–specific gene expression pattern requires solving the optimization problem
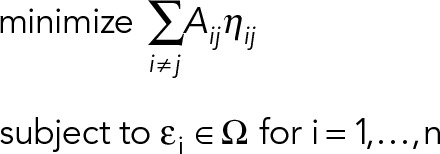 |
The solutions to this optimization problem are configurations that link the nuclear geometry with gene expression.
Once we find these optimal configurations for AP nuclei, we deform the cell nuclei into IP nuclei and update the packing of the inscribed chromosome ellipsoids by minimizing their overlap. In these updating steps, the overlap, ηij, is unweighted, that is, Aij = 1 for all pairs. Supplemental Movie S1 shows the various steps of the algorithm when performed in two dimensions with 10 enclosed ellipses.
The algorithm used here for predicting the chromosome arrangements provably outputs locally optimal minimal overlap configurations of ellipsoids (Uhler and Wright, 2013). It seems more reasonable to believe that the experimentally observed chromosome configurations strive toward a locally optimal configuration that depends on the starting configuration. These locally optimal configurations depend on the choice of the parameters used in the optimization problem. In particular, the parameters used for the predictions here (i.e., volume and shape of chromosomes, volume and shape of nucleus, and cell type–specific transcriptional activity of each chromosome) were estimated from experimental data. Given these experimental data on particular diploid cells, one can obtain in a similar way predictions of the intermingling levels for these cells. In earlier work, we tested our models on diploid cells, mapping in particular the radial positions of chromosomes in different nucleus shapes (Uhler and Wright, 2013).
Supplementary Material
Acknowledgments
We thank Bibhas Roy and Saradha Venkatachalapathy for help with some of the supplementary experiments and analysis. We also thank Andrew Wong and Chun Xi from the Science Communications Core, Mechanobiology Institute, for manuscript editing and scientific illustration, respectively. We thank the Mechanobiology Institute and the Singapore Ministry of Education Academic Research Fund Tier3 (MOE2012-T3-1-001) for funding. C.U. thanks the Austrian Science Fund (FWF) Y 903-N35.
Abbreviations used:
- AP
anisotropic
- BCE1
base pair transcriptional enhancer 1
- Chrs
chromosomes
- CT
chromosome territory
- ECM
extracellular matrix
- FISH
fluorescence in situ hybridization
- GAP
GTPase-accelerating protein
- HDAC3
histone deacetylase 3
- IP
isotropic
- JMY
junction mediating and regulatory protein
- MRTF-A
myocardin-related transcription factor A
- NF-kB
nuclear factor kappa B
- Pol II S5P
S5 phosphorylated RNA pol2
- RMA
robust multiarray average
- SRF
serum response factor
- TAZ
transcriptional coactivator with PDZ-binding motif
- YAP
Yes-associated protein.
Footnotes
This article was published online ahead of print in MBoC in Press (http://www.molbiolcell.org/cgi/doi/10.1091/mbc.E16-12-0825) on June 14, 2017.
REFERENCES
- Augsten M. Cancer-associated fibroblasts as another polarized cell type of the tumor microenvironment. Front Oncol. 2014;4, 62 doi: 10.3389/fonc.2014.00062. [DOI] [PMC free article] [PubMed] [Google Scholar]
- Berger SL. The complex language of chromatin regulation during transcription. Nature. 2007;447:407–412. doi: 10.1038/nature05915. [DOI] [PubMed] [Google Scholar]
- Bickmore WA, van Steensel B. Genome architecture: domain organization of interphase chromosomes. Cell. 2013;152:1270–1284. doi: 10.1016/j.cell.2013.02.001. [DOI] [PubMed] [Google Scholar]
- Bissell MJ, Hall HG, Parry G. How does the extracellular matrix direct gene expression. J Theor Biol. 1982;99:31–68. doi: 10.1016/0022-5193(82)90388-5. [DOI] [PubMed] [Google Scholar]
- Branco MR, Pombo A. Intermingling of chromosome territories in interphase suggests role in translocations and transcription-dependent associations. PLoS Biol. 2006;4:780. doi: 10.1371/journal.pbio.0040138. [DOI] [PMC free article] [PubMed] [Google Scholar]
- Butcher DT, Alliston T, Weaver VM. A tense situation: forcing tumour progression. Nat Rev Cancer. 2009;9:108–122. doi: 10.1038/nrc2544. [DOI] [PMC free article] [PubMed] [Google Scholar]
- Campellone KG, Welch MD. A nucleator arms race: cellular control of actin assembly. Nat Rev Mol Cell Biol. 2010;11:237–251. doi: 10.1038/nrm2867. [DOI] [PMC free article] [PubMed] [Google Scholar]
- Cavalli G, Misteli T. Functional implications of genome topology. Nat Struct Mol Biol. 2013;20:290–299. doi: 10.1038/nsmb.2474. [DOI] [PMC free article] [PubMed] [Google Scholar]
- Chakalova L, Debrand E, Mitchell JA, Osborne CS, Fraser P. Replication and transcription: shaping the landscape of the genome. Nat Rev Genet. 2005;6:669–677. doi: 10.1038/nrg1673. [DOI] [PubMed] [Google Scholar]
- Chan MW, Arora PD, Bozavikov P, McCulloch CA. FAK, PIP5KIγ and gelsolin cooperatively mediate force-induced expression of α-smooth muscle actin. J Cell Sci. 2009;122:2769–2781. doi: 10.1242/jcs.044008. [DOI] [PubMed] [Google Scholar]
- Chen CS, Mrksich M, Huang S, Whitesides GM, Ingber DE. Geometric control of cell life and death. Science. 1997;276:1425–1428. doi: 10.1126/science.276.5317.1425. [DOI] [PubMed] [Google Scholar]
- Conway J, Sloane NJA. Sphere Packings, Lattices and Groups. New York: Springer; 1998. [Google Scholar]
- Desprat N, Supatto W, Pouille P-A, Beaurepaire E, Farge E. Tissue deformation modulates twist expression to determine anterior midgut differentiation in Drosophila embryos. Dev Cell. 2008;15:470–477. doi: 10.1016/j.devcel.2008.07.009. [DOI] [PubMed] [Google Scholar]
- Donev A, Cisse I, Sachs D, Variano EA, Stillinger FH, Connelly R, Torquato S, Chaikin PM. Improving the density of jammed disordered packings using ellipsoids. Science. 2004;303:990–993. doi: 10.1126/science.1093010. [DOI] [PubMed] [Google Scholar]
- Dupont S, Morsut L, Aragona M, Enzo E, Giulitti S, Cordenonsi M, Zanconato F, Le Digabel J, Forcato M, Bicciato S. Role of YAP/TAZ in mechanotransduction. Nature. 2011;474:179–183. doi: 10.1038/nature10137. [DOI] [PubMed] [Google Scholar]
- Engler AJ, Sen S, Sweeney HL, Discher DE. Matrix elasticity directs stem cell lineage specification. Cell. 2006;126:677–689. doi: 10.1016/j.cell.2006.06.044. [DOI] [PubMed] [Google Scholar]
- Fanucchi S, Shibayama Y, Burd S, Weinberg MS, Mhlanga MM. Chromosomal contact permits transcription between coregulated genes. Cell. 2013;155:606–620. doi: 10.1016/j.cell.2013.09.051. [DOI] [PubMed] [Google Scholar]
- Fazal F, Bijli KM, Minhajuddin M, Rein T, Finkelstein JN, Rahman A. Essential role of cofilin-1 in regulating thrombin-induced RelA/p65 nuclear translocation and intercellular adhesion molecule 1 (ICAM-1) expression in endothelial cells. J Biol Chem. 2009;284:21047–21056. doi: 10.1074/jbc.M109.016444. [DOI] [PMC free article] [PubMed] [Google Scholar]
- Folkman J, Moscona A. Role of cell shape in growth control. Nature. 1978;273:345–349. doi: 10.1038/273345a0. [DOI] [PubMed] [Google Scholar]
- Fullwood MJ, Liu MH, Pan YF, Liu J, Xu H, Mohamed YB, Orlov YL, Velkov S, Ho A, Mei PH. An oestrogen-receptor. alpha-bound human chromatin interactome. Nature. 2009;462:58–64. doi: 10.1038/nature08497. [DOI] [PMC free article] [PubMed] [Google Scholar]
- Gieni RS, Hendzel MJ. Actin dynamics and functions in the interphase nucleus: moving toward an understanding of nuclear polymeric actin. Biochem Cell Biol. 2009;87:283–306. doi: 10.1139/O08-133. [DOI] [PubMed] [Google Scholar]
- Hayden MS, Ghosh S. Shared principles in NF-κB signaling. Cell. 2008;132:344–362. doi: 10.1016/j.cell.2008.01.020. [DOI] [PubMed] [Google Scholar]
- Humphrey JD, Dufresne ER, Schwartz MA. Mechanotransduction and extracellular matrix homeostasis. Nat Rev Mol Cell Biol. 2014;15:802–812. doi: 10.1038/nrm3896. [DOI] [PMC free article] [PubMed] [Google Scholar]
- Iskratsch T, Wolfenson H, Sheetz MP. Appreciating force and shape —the rise of mechanotransduction in cell biology. Nat Rev Mol Cell Biol. 2014;15:825–833. doi: 10.1038/nrm3903. [DOI] [PMC free article] [PubMed] [Google Scholar]
- Iyer KV, Maharana S, Gupta S, Libchaber A, Tlusty T, Shivashankar G. Modeling and experimental methods to probe the link between global transcription and spatial organization of chromosomes. PLoS One. 2012;7:e46628. doi: 10.1371/journal.pone.0046628. [DOI] [PMC free article] [PubMed] [Google Scholar]
- Jain N, Iyer KV, Kumar A, Shivashankar G. Cell geometric constraints induce modular gene-expression patterns via redistribution of HDAC3 regulated by actomyosin contractility. Proc Natl Acad Sci USA. 2013;110:11349–11354. doi: 10.1073/pnas.1300801110. [DOI] [PMC free article] [PubMed] [Google Scholar]
- Jin F, Li Y, Dixon JR, Selvaraj S, Ye Z, Lee AY, Yen C-A, Schmitt AD, Espinoza CA, Ren B. A high-resolution map of the three-dimensional chromatin interactome in human cells. Nature. 2013;503:290–294. doi: 10.1038/nature12644. [DOI] [PMC free article] [PubMed] [Google Scholar]
- Kilian KA, Bugarija B, Lahn BT, Mrksich M. Geometric cues for directing the differentiation of mesenchymal stem cells. Proc Natl Acad Sci USA. 2010;107:4872–4877. doi: 10.1073/pnas.0903269107. [DOI] [PMC free article] [PubMed] [Google Scholar]
- Lanctôt C, Cheutin T, Cremer M, Cavalli G, Cremer T. Dynamic genome architecture in the nuclear space: regulation of gene expression in three dimensions. Nat Rev Genet. 2007;8:104–115. doi: 10.1038/nrg2041. [DOI] [PubMed] [Google Scholar]
- Le HQ, Ghatak S, Yeung C-YC, Tellkamp F, Günschmann C, Dieterich C, Yeroslaviz A, Habermann B, Pombo A, Niessen CM. Mechanical regulation of transcription controls Polycomb-mediated gene silencing during lineage commitment. Nat Cell Biol. 2016;18:864–875. doi: 10.1038/ncb3387. [DOI] [PubMed] [Google Scholar]
- Le Beyec J, Xu R, Lee S-Y, Nelson CM, Rizki A, Alcaraz J, Bissell MJ. Cell shape regulates global histone acetylation in human mammary epithelial cells. Exp Cell Res. 2007;313:3066–3075. doi: 10.1016/j.yexcr.2007.04.022. [DOI] [PMC free article] [PubMed] [Google Scholar]
- Li Q, Kumar A, Makhija E, Shivashankar G. The regulation of dynamic mechanical coupling between actin cytoskeleton and nucleus by matrix geometry. Biomaterials. 2014;35:961–969. doi: 10.1016/j.biomaterials.2013.10.037. [DOI] [PubMed] [Google Scholar]
- Maharana S, Iyer KV, Jain N, Nagarajan M, Wang Y, Shivashankar G. Chromosome intermingling—the physical basis of chromosome organization in differentiated cells. Nucleic Acids Res. 2016;44:5148–5160. doi: 10.1093/nar/gkw131. [DOI] [PMC free article] [PubMed] [Google Scholar]
- Makhija E, Jokhun D, Shivashankar G. Nuclear deformability and telomere dynamics are regulated by cell geometric constraints. Proc Natl Acad Sci USA. 2016;113:E32–E40. doi: 10.1073/pnas.1513189113. [DOI] [PMC free article] [PubMed] [Google Scholar]
- Mammoto A, Huang S, Ingber DE. Filamin links cell shape and cytoskeletal structure to Rho regulation by controlling accumulation of p190RhoGAP in lipid rafts. J Cell Sci. 2007;120:456–467. doi: 10.1242/jcs.03353. [DOI] [PubMed] [Google Scholar]
- Mammoto A, Huang S, Moore K, Oh P, Ingber DE. Role of RhoA, mDia, and ROCK in cell shape-dependent control of the Skp2-p27kip1 pathway and the G1/S transition. J Biol Chem. 2004;279:26323–26330. doi: 10.1074/jbc.M402725200. [DOI] [PubMed] [Google Scholar]
- Maniotis AJ, Valyi-Nagy K, Karavitis J, Moses J, Boddipali V, Wang Y, Nuñez R, Setty S, Arbieva Z, Bissell MJ. Chromatin organization measured by AluI restriction enzyme changes with malignancy and is regulated by the extracellular matrix and the cytoskeleton. Am J Pathol. 2005;166:1187–1203. doi: 10.1016/S0002-9440(10)62338-3. [DOI] [PMC free article] [PubMed] [Google Scholar]
- Morita T, Mayanagi T, Sobue K. Reorganization of the actin cytoskeleton via transcriptional regulation of cytoskeletal/focal adhesion genes by myocardin-related transcription factors (MRTFs/MAL/MKLs) Exp Cell Res. 2007;313:3432–3445. doi: 10.1016/j.yexcr.2007.07.008. [DOI] [PubMed] [Google Scholar]
- Myers CA, Schmidhauser C, Mellentin-Michelotti J, Fragoso G, Roskelley CD, Casperson G, Mossi R, Pujuguet P, Hager G, Bissell MJ. Characterization of BCE-1, a transcriptional enhancer regulated by prolactin and extracellular matrix and modulated by the state of histone acetylation. Mol Cell Biol. 1998;18:2184–2195. doi: 10.1128/mcb.18.4.2184. [DOI] [PMC free article] [PubMed] [Google Scholar]
- Nelson CJ, Santos-Rosa H, Kouzarides T. Proline isomerization of histone H3 regulates lysine methylation and gene expression. Cell. 2006;126:905–916. doi: 10.1016/j.cell.2006.07.026. [DOI] [PubMed] [Google Scholar]
- Noordermeer D, de Wit E, Klous P, van de Werken H, Simonis M, Lopez-Jones M, Eussen B, de Klein A, Singer RH, de Laat W. Variegated gene expression caused by cell-specific long-range DNA interactions. Nat Cell Biol. 2011a;13:944–951. doi: 10.1038/ncb2278. [DOI] [PMC free article] [PubMed] [Google Scholar]
- Noordermeer D, Leleu M, Splinter E, Rougemont J, De Laat W, Duboule D. The dynamic architecture of Hox gene clusters. Science. 2011b;334:222–225. doi: 10.1126/science.1207194. [DOI] [PubMed] [Google Scholar]
- Olson EN, Nordheim A. Linking actin dynamics and gene transcription to drive cellular motile functions. Nat Rev Mol Cell Biol. 2010;11:353–365. doi: 10.1038/nrm2890. [DOI] [PMC free article] [PubMed] [Google Scholar]
- Osborne CS, Chakalova L, Brown KE, Carter D, Horton A, Debrand E, Goyenechea B, Mitchell JA, Lopes S, Reik W. Active genes dynamically colocalize to shared sites of ongoing transcription. Nat Genet. 2004;36:1065–1071. doi: 10.1038/ng1423. [DOI] [PubMed] [Google Scholar]
- Parada LA, McQueen PG, Misteli T. Tissue-specific spatial organization of genomes. Genome Biol. 2004;5:R44. doi: 10.1186/gb-2004-5-7-r44. [DOI] [PMC free article] [PubMed] [Google Scholar]
- Ramdas NM, Shivashankar G. Cytoskeletal control of nuclear morphology and chromatin organization. J Mol Biol. 2015;427:695–706. doi: 10.1016/j.jmb.2014.09.008. [DOI] [PubMed] [Google Scholar]
- Riveline D, Zamir E, Balaban NQ, Schwarz US, Ishizaki T, Narumiya S, Kam Z, Geiger B, Bershadsky AD. Focal contacts as mechanosensors externally applied local mechanical force induces growth of focal contacts by an mdia1-dependent and rock-independent mechanism. J Cell Biol. 2001;153:1175–1186. doi: 10.1083/jcb.153.6.1175. [DOI] [PMC free article] [PubMed] [Google Scholar]
- Rogers CA. Packing and Covering, Cambridge, UK: Cambridge University Press. 1964.
- Sathe AR, Shivashankar G, Sheetz MP. Nuclear transport of paxillin depends on focal adhesion dynamics and FAT domains. J Cell Sci. 2016;129:1981–1988. doi: 10.1242/jcs.172643. [DOI] [PMC free article] [PubMed] [Google Scholar]
- Schmidhauser C, Casperson GF, Myers C, Sanzo K, Bolten S, Bissell M. A novel transcriptional enhancer is involved in the prolactin-and extracellular matrix-dependent regulation of beta-casein gene expression. Mol Biol Cell. 1992;3:699–709. doi: 10.1091/mbc.3.6.699. [DOI] [PMC free article] [PubMed] [Google Scholar]
- Schoenfelder S, Sexton T, Chakalova L, Cope NF, Horton A, Andrews S, Kurukuti S, Mitchell JA, Umlauf D, Dimitrova DS. Preferential associations between co-regulated genes reveal a transcriptional interactome in erythroid cells. Nat Genet. 2010;42:53–61. doi: 10.1038/ng.496. [DOI] [PMC free article] [PubMed] [Google Scholar]
- Uhler C, Wright SJ. Packing ellipsoids with overlap. SIAM Rev. 2013;55:671–706. [Google Scholar]
- van de Corput MP, de Boer E, Knoch TA, van Cappellen WA, Quintanilla A, Ferrand L, Grosveld FG. Super-resolution imaging reveals three-dimensional folding dynamics of the β-globin locus upon gene activation. J Cell Sci. 2012;125:4630–4639. doi: 10.1242/jcs.108522. [DOI] [PubMed] [Google Scholar]
- Van Steensel B, Dekker J. Genomics tools for unraveling chromosome architecture. Nat Biotechnol. 2010;28:1089–1095. doi: 10.1038/nbt.1680. [DOI] [PMC free article] [PubMed] [Google Scholar]
- Vartiainen MK, Guettler S, Larijani B, Treisman R. Nuclear actin regulates dynamic subcellular localization and activity of the SRF cofactor MAL. Science. 2007;316:1749–1752. doi: 10.1126/science.1141084. [DOI] [PubMed] [Google Scholar]
- Versaevel M, Grevesse T, Gabriele S. Spatial coordination between cell and nuclear shape within micropatterned endothelial cells. Nat Commun. 2012;3:671. doi: 10.1038/ncomms1668. [DOI] [PubMed] [Google Scholar]
- Wang N, Tytell JD, Ingber DE. Mechanotransduction at a distance: mechanically coupling the extracellular matrix with the nucleus. Nat Rev Mol Cell Biol. 2009;10:75–82. doi: 10.1038/nrm2594. [DOI] [PubMed] [Google Scholar]
- Wang Y, Gilmore TD. Zyxin and paxillin proteins: focal adhesion plaque LIM domain proteins go nuclear. Biochim Biophys Acta. 2003;1593:115–120. doi: 10.1016/s0167-4889(02)00349-x. [DOI] [PubMed] [Google Scholar]
- Wang Y, Maharana S, Wang MD, Shivashankar G. Super-resolution microscopy reveals decondensed chromatin structure at transcription sites. Sci Rep. 2014;4:4477. doi: 10.1038/srep04477. [DOI] [PMC free article] [PubMed] [Google Scholar]
- Xu R, Nelson CM, Muschler JL, Veiseh M, Vonderhaar BK, Bissell MJ. Sustained activation of STAT5 is essential for chromatin remodeling and maintenance of mammary-specific function. J Cell Biol. 2009;184:57–66. doi: 10.1083/jcb.200807021. [DOI] [PMC free article] [PubMed] [Google Scholar]
- Zheng B, Han M, Bernier M, Wen JK. Nuclear actin and actin-binding proteins in the regulation of transcription and gene expression. FEBS J. 2009;276:2669–2685. doi: 10.1111/j.1742-4658.2009.06986.x. [DOI] [PMC free article] [PubMed] [Google Scholar]
Associated Data
This section collects any data citations, data availability statements, or supplementary materials included in this article.