Sickle cell disease (SCD) is an inherited blood disorder resulting from an A to T mutation in codon 6 of the β-globin gene leading to hemoglobin S synthesis which undergoes polymerization under low oxygen conditions. Among different treatment strategies investigated in the field, reactivation of γ-globin gene transcription and fetal hemoglobin (HbF) synthesis remains the most effective strategy to ameliorate the clinical symptoms of SCD. These observations provide the impetus for extensive investigations to define mechanisms of γ-globin regulation.1 Previously, the transcription factor NRF2 associated with erythroid differentiation was shown to bind the locus control region (LCR) DNase I hypersensitive site 2 (HS2) of the human β-globin locus (HBB).2 Drugs such as tert-butylhydroquione3 and dimethyl fumarate (DMF)4 have the ability to activate NRF2 and HbF expression in human primary erythroid progenitors. However, the molecular mechanisms of γ-globin activation by NRF2 remain unknown. Here we present data to show NRF2 can form heterodimers with small MAF proteins and mediate chromatin looping between the LCR and γ-globin promoters to activate transcription.
To define molecular mechanisms involved in γ-globin regulation by NRF2, we performed studies using erythroid progenitors generated from human CD34+ stem cells in a liquid culture system (Online Supplementary Methods and Online Supplementary Figure S1A-C). Cell morphology examination by Giemsa staining confirmed erythroid lineage commitment by day 6 followed by the appearance of mature red blood cells by day 14. In our system, the synthesis of HbF was gradually increased, although at a lower rate than adult hemoglobin A during late erythropoiesis. Based on the pattern of globin gene expression, erythroid progenitors were treated with DMF on day 8 to activate NRF2 expression. It was seen that DMF treatment decreased erythroid progenitor viability and growth (Online Supplementary Figure S1D), similar to other reports.5 However, additional studies to determine the effects of DMF on progenitor maturation were conducted. We observed a 40–50% reduction in mRNA levels of the erythroid differentiation genes CD71 and CD235a; however, flow cytometry showed 93.8% of erythroid progenitors remained CD71 and CD235a positive compared to 96% for untreated cells (Online Supplementary Figure S1E and F). Although prolonged treatment with DMF could alter erythroid differentiation,6 we restricted our culture period to 48 hours to achieve NRF2 activation without significantly changing erythroid marker protein expression.
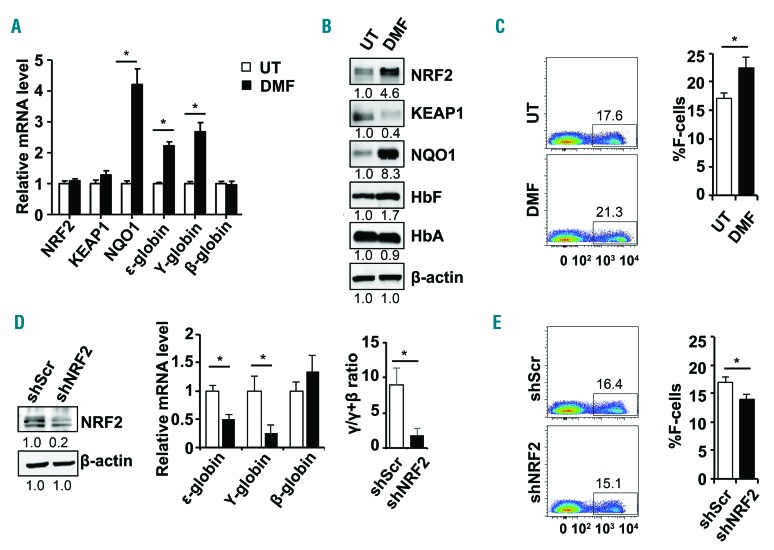
After establishing our primary culture system, we next confirmed the ability of DMF to increase NRF2 levels and activate its downstream target gene NQO1. Reverse transcription-quantitative PCR (RT-qPCR) data were generated with gene specific primers (summarized in the Online Supplementary Table S1). Treatment with DMF produced no significant change in mRNA levels of NRF2 (Figure 1A) or its known cytoplasmic binding partner, Kelch-like ECH-associated protein 1 (KEAP1). However, NQO1 transcription increased dramatically (P<0.05), suggesting NRF2 activation at the protein level. To support this interpretation, we observed a 4.6-fold increase in NRF2 and a simultaneous decrease in KEAP1 protein by western blot analysis (Figure 1B). Of note, parallel with NRF2 accumulation, ε-globin and γ-globin mRNA levels increased 2.2-fold and 2.7-fold, respectively, without a significant change in β-globin transcription (Figure 1A). Furthermore, enhanced γ-globin transcription was associated with an increase in HbF protein (Figure 1B) and the percentage of HbF positive cells (%F-cells) increased from 17.1% to 22.5% (P<0.05) by flow cytometry analysis (Figure 1C).
Figure 1.
DMF and shNRF2 modulates γ-globin gene expression in human normal erythroid progenitors. (A) Erythroid progenitors generated in liquid culture system from CD34+ stem cells were treated at day 8 with 200 μM dimethyl fumarate (DMF) for 48 hours. Reverse transcription-quantitative PCR (RT-qPCR) was conducted for untreated erythroid progenitors (white bars) or cells treated with DMF (black bars) to determine the mRNA levels for the genes shown. The expression of gene in untreated erythroid progenitors was set to one after being normalized to the internal control glyceraldehyde phosphate dehydrogenase (GAPDH) mRNA levels. The quantitative data are shown as the mean ± standard error of the mean (SEM) of 3–5 independent experiments; *P<0.05. (B) Western blot analysis was conducted for the protein shown with total protein isolated from UT- and DMF-treated erythroid progenitors. The relative protein expression was quantified by densitometry with β-actin as the loading control. (C) Flow cytometry analysis was conducted to determine the %HbF positive cells (%F-cells) for UT-and DMF-treated erythroid progenitors stained with fluorescein isothiocyanate (FITC) labeled anti-HbF antibody. Representative dot plots for F-cell distribution are shown on the left and quantitative data in the graph on the right. (D) To test the effects of gene silencing, erythroid progenitors were treated on day 4 with scramble (shScr) or shNRF2 lentiviral particles; after 48 hours cells were selected with puromycin (0.8 μg/mL) until analysis on day 10. Western blot analysis for NRF2 was conducted; the lower band represents non-specific antibody binding. Shown in the middle is RT-qPCR data for the shNRF2 stable lines; the relative mRNA levels expressed as the γ/γ+β ratio is shown in the graph on the right. (E) Flow cytometry analysis was conducted to determine the %F-cells in erythroid progenitors after stable shNRF2 expression using methods described in (C). Representative dot plots for F-cell distribution are shown on the left and quantitative data in the graph on the right.
To investigate whether NRF2 is directly involved in γ-globin transcription, we performed studies with shNRF2 lentiviral particles which produced an 80% knockdown of NRF2 gene expression in erythroid progenitors (Figure 1D). Analysis of ε-globin and γ-globin transcription showed a 50% and 75% decrease in mRNA, respectively, without any significant change in β-globin. Moreover, we observed a decrease in the γ/γ+β ratio from 8.9% to 1.8%. Silencing NRF2 significantly decreased the %F-cells from 16.9% to 13.9% (Figure 1E), suggesting NRF2 plays a direct role in γ-globin gene transcription in erythroid progenitors.
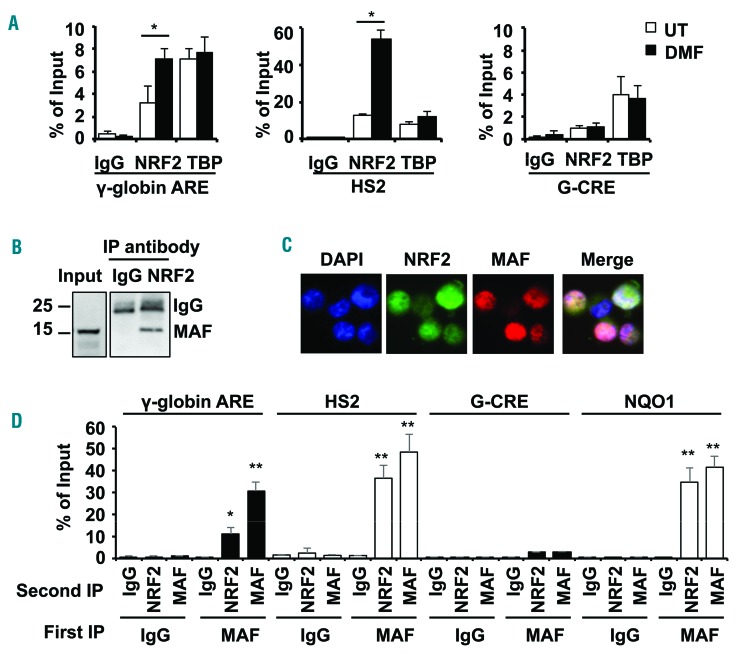
Under normal oxidative stress conditions NRF2 is sequestered in the cytoplasm by KEAP1; by contrast, when reactive oxygen species levels increase, KEAP1 is inactivated allowing NRF2 accumulation and nuclear translocation to activate cytoprotective genes such as, among others, NQO1 and HMOX1.7 To define molecular mechanisms of γ-globin regulation, we performed chromatin immunoprecipitation (ChIP) assay to quantify in vivo NRF2 binding to the antioxidant response element (ARE) consensus sequence (5′-TGACnnnGC-3′) located 100bp upstream of the γ-globin transcription start site and the HS2 ARE motif predicted by in silico JASPAR analysis (Online Supplementary Table S2). Using day 10 erythroid progenitors, we detected significant NRF2 binding to the γ-globin and HS2 ARE motifs compared to IgG control reactions. After DMF treatment, NRF2 binding increased 2.2-fold and 4.1-fold in the γ-globin and HS2 ARE, respectively (Figure 2A), whereas NRF2 did not bind the Gγ-globin cAMP response element known to regulate γ-globin expression but that does not, however, contain an ARE.8
Figure 2.
NRF2/MAF heterodimers mediate γ-globin gene regulation. (A) ChIP assay was conducted with NRF2 and TATA binding protein (TBP) antibodies to determine in vivo binding in the γ-globin and HS2 ARE for untreated (white bars) and DMF treated (black bars) primary erythroid cells. The Gγ-globin cAMP response element (G-CRE) devoid of an ARE motif was used as a control region. The data are shown as the mean ± SEM of 3 independent experiments; *P<0.05. (B) Co-immunoprecipitation studies were completed to determine the interactions between NRF2 and MAF in whole cell protein lysates from KU812 leukemia cells treated with DMF (200 μM) for 48 hours. Immunoprecipitation (IP) with anti-NRF2 or IgG antibody was followed by western blot with anti-MAF antibody. (C) Cellular localization of NRF2 and MAF proteins was determined by immunofluorescence staining with rabbit anti-NRF2 and mouse anti-MAF antibodies followed by anti-rabbit secondary FITC antibody (green) and anti-mouse secondary phycoerythrine (PE) antibody (red) (Online Supplementary Methods). Localization of NRF2 and MAF in the nucleus was identified in the merged images; color code: MAF>NRF2, pink; NRF2>MAF, purple and NRF2=MAF, white. (D) Sequential-ChIP was conducted (Online Supplementary Methods) to determine if NRF2 and MAF co-localize at the regions shown in KU812 cells treated with DMF to stimulate NRF2 translocation to the nucleus. The G-CRE was used as a control region. Sequential immunoprecipitations with the first antibody (First IP) and second antibody (Second IP) were conducted; **P<0.01.
It is known that NRF2 requires heterodimerization with small MAF proteins to bind the ARE motif and regulate gene expression.9 To determine if this mechanism is involved in γ-globin regulation, we analyzed genome-wide ChIP-seq data generated by the ENCODE project where MAF was shown to bind across the HBB locus in K562 cells but not in HepG2 liver cancer cells (Online Supplementary Figure S2). Interestingly, MAF binding surrounding the ε-globin and γ-globin genes was associated with the active histone marks H3K4Me3 and H3K27Ac and low repressive marks H3K9Me3 and H3K27Me3. Therefore, we next investigated whether protein-protein interactions occur between NRF2 and MAF in KU812 leukemia cells in which the γ-globin and β-globin genes are actively transcribed.10 Co-immunoprecipitation experiments demonstrated NRF2/MAF interactions (Figure 2B) and NRF2 translocation into the nucleus by immunofluorescence staining after DMF treatment (Figure 2C). To determine whether NRF2 and MAF co-localize at the γ-globin ARE, we conducted sequential-ChIP assay with anti-MAF antibody followed by a second immunoprecipitation with anti-NRF2 antibody. We observed 11–36.6% chromatin enrichment supporting NRF2/MAF co-localization in the γ-globin, HS2 and NQO1 ARE motifs (Figure 2D).
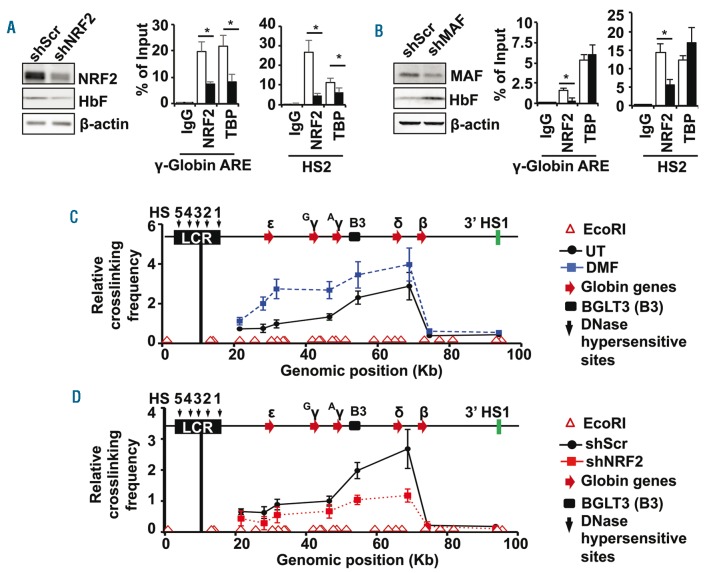
To provide additional evidence for a functional role of NRF2/MAF interactions in the mechanism of γ-globin regulation, we established KU812 stable lines using shNRF2 and shMAF lentiviral particles under puromycin selection. Stable expression of shNRF2 silenced target gene expression by 80% with a concomitant decrease in HbF levels (Figure 3A). In addition, ChIP assay demonstrated a decline in NRF2 and TATA binding protein (TBP) binding to the γ-globin and HS2 ARE motifs. For the shMAF KU812 stable line, we observed a 70% decrease in MAF protein accompanied by an 80% and 60% decrease in NRF2 binding to the γ-globin and HS2 AREs, respectively (Figure 3B). In contrast to findings in the shNRF2 stable line, in vivo TBP binding was not affected by shMAF stable expression and HbF levels were increased (Figure 3B). A possible explanation for HbF induction is supported by observations in mouse fetal liver erythroid cells where MAFG up-regulated KLF1 and BCL11A expression,11 two major negative regulators of γ-globin gene expression.12,13 The ability of small MAF homodimers to silence antioxidant genes has also been previously reported.9 Together these data suggest a dual role of MAF as an NRF2 binding partner and possible repressor of γ-globin.
Figure 3.
NRF2 facilitates chromatin looping in the HBB locus of primary erythroid progenitors. (A) KU812 stable cell lines were produced with shScr and shNRF2 lentiviral particles to determine the effects on HbF and NRF2 protein levels by western blot analysis (left graph); β-actin was used as loading control. ChIP assay (right graph) was completed to quantify NRF2 and TBP binding to the regions shown with IgG as an antibody control. (B) A third KU812 cell line was produced with shMAF lentiviral particles; western blot analysis (left) and ChIP assay (right) were conducted as described in (A). (C) Chromatin looping in the HBB locus was analyzed by the chromosome conformation capture (3C) assay for UT and DMF treatment primary erythroid cells (Online Supplementary Methods). The positions of the EcoRI restriction sites are shown by the open red triangles above the x-axis and the relative position of the five HBB locus globin genes by the red arrows. The position of the β-globin locus transcript 3 (BGLT3, B3), long non-coding RNA is indicated by the black box; HS5-1, DNase I hypersensitive sites. The relative distance of individual globin genes to the anchor encompassing HS4, HS3 and HS2 (black line) is indicated in kb. The relative crosslinking frequency between the anchor and other EcoRI fragments was determined by qPCR analysis. The data are shown as the mean ± standard error of the mean of 3 independent experiments. (D) The 3C assay was conducted for the shScr (●) and shNRF2 (■) lentiviral particle transduced erythroid progenitors. The relative crosslinking frequency of the anchor with the downstream sites is shown.
Finally, we examined the ability of NRF2 to mediate chromatin structure changes as part of its mechanism of γ-globin regulation. It is known that an active chromatin hub is formed through sequential long-range interactions between the LCR and individual globin gene promoters to accomplish developmentally-regulated gene expression.14 Since we demonstrated NRF2 binding to the HS2 and γ-globin gene AREs (Figure 2A), we investigated whether NRF2 mediates chromatin looping using chromosome conformation capture (3C) assay (Online Supplementary Methods). Using day 10 human primary erythroid progenitors, we detected interactions between the anchor fragment (encompassing HS2, HS3 and HS4) and ε-globin, γ-globin, δ-globin and β-globin intergenic region, and BGLT3 (β-globin locus transcript 3) sequence (Figure 3C), containing predicted ARE motifs (Online Supplementary Table S2). Subsequent 3C assay completed after DMF treatment to induce NRF2 nuclear translocation showed increased chromatin looping, except in the β-globin promoter where no ARE exists. As further evidence of NRF2 involvement in HBB locus chromatin structure, we performed 3C assay after shNRF2-mediated gene silencing. We observed a decrease in chromatin looping between the anchor and ε-, γ- and δ-globin genes and BGLT3 sequence, without observing any effect on β-globin interactions (Figure 3D). Interestingly, the BGLT3 region has been associated with γ-globin gene silencing through the recruitment of repressors and co-repressors by LDB1/NL115 and BCL11A.16 Therefore, the ability of NRF2 to activate γ-globin transcription may occur through modulation of repressor complexes; however, additional experimental data are required to demonstrate this mechanism. Nevertheless, our data support in vivo NRF2 binding to the γ-globin ARE to promote long-range chromatin looping.
In summary, DMF-mediated NRF2 activation and nuclear translocation produced γ-globin gene activation and HbF induction. Here, we present evidence for a direct role of NRF2 in globin gene regulation including in vivo binding to the ARE motifs in the γ-globin promoter and HS2. Moreover, heterodimerization between NRF2 and MAF facilitated chromatin looping in the HBB locus to preferentially activate γ-globin expression. Pharmacological NRF2 activators represent a class of promising agents as HbF inducers for the treatment of SCD, and this approach should be the object of future development.
Supplementary Material
Acknowledgments
We thank Drs. Bobby Thomas, Dorothy Tuan, Hongyan Xu, and Huidong Shi for their insights and helpful discussions of data interpretation.
Footnotes
Funding: this work was supported by funding from the National Heart, Lung, and Blood Institute to XZ (HL117684) and BSP (HL069234).
Information on authorship, contributions, and financial & other disclosures was provided by the authors and is available with the online version of this article at www.haematologica.org.
References
- 1.Sankaran VG. Targeted therapeutic strategies for fetal hemoglobin induction. Hematology Am Soc Hematol Educ Program. 2011; 2011:459–465. [DOI] [PubMed] [Google Scholar]
- 2.Moi P, Chan K, Asunis I, Cao A, Kan YW. Isolation of NF-E2-related factor 2 (NRF2), a NF-E2-like basic leucine zipper transcriptional activator that binds to the tandem NF-E2/AP1 repeat of the beta-globin locus control region. Proc Natl Acad Sci USA. 1994;91(21):9926–9930. [DOI] [PMC free article] [PubMed] [Google Scholar]
- 3.Macari ER, Lowrey CH. Induction of human fetal hemoglobin via the NRF2 antioxidant response signaling pathway. Blood. 2011; 117(22):5987–5997. [DOI] [PMC free article] [PubMed] [Google Scholar]
- 4.Promsote W, Makala L, Li B, et al. Monomethylfumarate induces gamma-globin expression and fetal hemoglobin production in cultured human retinal pigment epithelial (RPE) and erythroid cells, and in intact retina. Invest Ophthalmol Vis Sci. 2014;55(8):5382–5393. [DOI] [PMC free article] [PubMed] [Google Scholar]
- 5.Loewe R, Valero T, Kremling S, et al. Dimethylfumarate impairs melanoma growth and metastasis. Cancer Res. 2006;66(24):11888–11896. [DOI] [PubMed] [Google Scholar]
- 6.Stamatoyannopoulos G. Control of globin gene expression during development and erythroid differentiation. Exp Hematol. 2005; 33(3):259–271. [DOI] [PMC free article] [PubMed] [Google Scholar]
- 7.Itoh K, Wakabayashi N, Katoh Y, et al. Keap1 represses nuclear activation of antioxidant responsive elements by Nrf2 through binding to the amino-terminal Neh2 domain. Genes Dev. 1999;13(1):76–86. [DOI] [PMC free article] [PubMed] [Google Scholar]
- 8.Sangerman J, Lee MS, Yao X, et al. Mechanism for fetal hemoglobin induction by histone deacetylase inhibitors involves gamma-globin activation by CREB1 and ATF-2. Blood. 2006;108(10):3590–3599. [DOI] [PMC free article] [PubMed] [Google Scholar]
- 9.Dhakshinamoorthy S, Jaiswal AK. Small maf (MafG and MafK) proteins negatively regulate antioxidant response element-mediated expression and antioxidant induction of the NAD(P)H:Quinone oxidoreductase1 gene. J Biol Chem. 2000;275(51):40134–40141. [DOI] [PubMed] [Google Scholar]
- 10.Zein S, Li W, Ramakrishnan V, et al. Identification of fetal hemoglobin-inducing agents using the human leukemia KU812 cell line. Exp Biol Med (Maywood). 2010;235(11):1385–1394. [DOI] [PubMed] [Google Scholar]
- 11.Yamazaki H, Katsuoka F, Motohashi H, Engel JD, Yamamoto M. Embryonic lethality and fetal liver apoptosis in mice lacking all three small Maf proteins. Mol Cell Biol. 2012;32(4):808–816. [DOI] [PMC free article] [PubMed] [Google Scholar]
- 12.Zhou D, Liu K, Sun CW, Pawlik KM, Townes TM. KLF1 regulates BCL11A expression and gamma- to beta-globin gene switching. Nat Genet. 2010;42(9):742–744. [DOI] [PubMed] [Google Scholar]
- 13.Sankaran VG, Menne TF, Xu J, et al. Human fetal hemoglobin expression is regulated by the developmental stage-specific repressor BCL11A. Science. 2008;322(5909):1839–1842. [DOI] [PubMed] [Google Scholar]
- 14.Tolhuis B, Palstra RJ, Splinter E, Grosveld F, de Laat W. Looping and interaction between hypersensitive sites in the active beta-globin locus. Mol Cell. 2002;10(6):1453–1465. [DOI] [PubMed] [Google Scholar]
- 15.Kiefer CM, Lee J, Hou C, et al. Distinct Ldb1/NLI complexes orchestrate γ-globin repression and reactivation through ETO2 in human adult erythroid cells. Blood. 2011;118(23):6200–6208. [DOI] [PMC free article] [PubMed] [Google Scholar]
- 16.Xu J, Bauer DE, Kerenyi MA, et al. Corepressordependent silencing of fetal hemoglobin expression by BCL11A. Proc Natl Acad Sci USA. 2013;110(16):6518–6523. [DOI] [PMC free article] [PubMed] [Google Scholar]
Associated Data
This section collects any data citations, data availability statements, or supplementary materials included in this article.


