

Abstract
Motivation
LD score regression is a reliable and efficient method of using genome-wide association study (GWAS) summary-level results data to estimate the SNP heritability of complex traits and diseases, partition this heritability into functional categories, and estimate the genetic correlation between different phenotypes. Because the method relies on summary level results data, LD score regression is computationally tractable even for very large sample sizes. However, publicly available GWAS summary-level data are typically stored in different databases and have different formats, making it difficult to apply LD score regression to estimate genetic correlations across many different traits simultaneously.
Results
In this manuscript, we describe LD Hub - a centralized database of summary-level GWAS results for 173 diseases/traits from different publicly available resources/consortia and a web interface that automates the LD score regression analysis pipeline. To demonstrate functionality and validate our software, we replicated previously reported LD score regression analyses of 49 traits/diseases using LD Hub; and estimated SNP heritability and the genetic correlation across the different phenotypes. We also present new results obtained by uploading a recent atopic dermatitis GWAS meta-analysis to examine the genetic correlation between the condition and other potentially related traits. In response to the growing availability of publicly accessible GWAS summary-level results data, our database and the accompanying web interface will ensure maximal uptake of the LD score regression methodology, provide a useful database for the public dissemination of GWAS results, and provide a method for easily screening hundreds of traits for overlapping genetic aetiologies.
Availability and Implementation
The web interface and instructions for using LD Hub are available at http://ldsc.broadinstitute.org/
Supplementary information
Supplementary data are available at Bioinformatics online.
1 Introduction
There is now substantial empirical evidence demonstrating that the majority of complex traits and diseases in humans are influenced by hundreds if not thousands of genetic loci of small effect scattered across the genome as was first predicted a century ago (East, 1916; Fisher, 1918). The advent of high throughput micro-array genotyping and now next generation sequencing technologies has meant that genome-wide data can be leveraged to ask fundamental questions concerning the underlying genetic architecture of common complex traits and diseases including the degree to which genetic variation affecting complex phenotypes is tagged by SNPs on genome-wide arrays (Lee et al., 2011; Yang et al., 2010, 2011), the degree to which this variation represents different functional categories and/or biological pathways (Finucane et al., 2015; Gusev et al., 2014), and the extent to which genetic aetiologies are shared across different phenotypes (Bulik-Sullivan et al., 2015b; Lee et al., 2012). To date most of these types of analyses have been performed using genetic restricted maximum likelihood analysis (GREML) as implemented in software packages such as GCTA and LDAK (Lee et al., 2011; Speed et al., 2012; Yang et al., 2010, 2011). However, these methods require individual-level genotype data, which is often not available as most of the largest GWAS analyses are conducted through meta-analyses, and so typically only report summary results statistics (Zheng et al., 2013). Additionally GREML can be computationally prohibitive when analyzing raw genome-wide SNP data from hundreds of thousands of individuals. Consequently, most GREML analyses reported in the literature to date have been hypothesis driven studies that have involved only a small number of related traits (Table 1).
Table 1.
Comparison between GREML and LD Score Regression via LD Hub
| GREML | LD Score regression via LD Hub |
|---|---|
| Requires individual-level data | Requires GWAS summary-level data |
| One dataset at a time | Integrates multiple GWAS results datasets |
| Run time depends on number of individuals and traits | Run time depends on number of traits only |
| Manual implementation | Automated |
| Usually one or a few traits at a time | Many traits simultaneously |
| Typically hypothesis driven Computationally prohibitive for large numbers of individuals | Hypothesis driven or hypothesis-free Handles large numbers of individuals easily |
In order to address these limitations, Bulik-Sullivan et al previously proposed a different method, LD score regression (Bulik-Sullivan et al., 2015a). Essentially the method involves regressing summary results statistics from millions of genetic variants across the genome on a measure of each variant’s ability to tag other variants locally (i.e. its ‘LD score’). The intuition behind the approach is that if a trait is genetically influenced, then variants that tag more of the genome (i.e. have high LD scores) should have a greater opportunity to tag causal variants and therefore have higher test statistics on average than variants that have low LD scores. In this way genome-wide inflation of test statistics due to genuine polygenicity can be distinguished from biases such as population stratification and cryptic relatedness. The basic method is very flexible and can be adapted to estimate SNP heritability, calculate a more accurate and efficient genome-wide inflation correction factor than genomic control (Bulik-Sullivan et al., 2015a), partition the SNP heritability by functional category (Finucane et al., 2015), and estimate the genetic correlation between different complex traits and diseases (Bulik-Sullivan et al., 2015b), all using GWAS summary-level results data (Table 1).
The chief limitation of using LD score regression to estimate genetic correlations to date has been a practical one. Publicly available GWAS meta-analysis results are available from a number of different repositories on the Internet. It is time consuming to locate and download all of these resources for use, particularly as these databases become more numerous. What’s more, each summary results file typically involves different file formats and conventions making data preparation a time consuming exercise. In addition, many GWAS meta-analyses are not made publicly available, requiring the user to proactively invite the relevant investigators to share their results, which also takes a significant amount of time.
Here we describe a centralized database and web interface, LD Hub, which automates the LD score regression analysis pipeline using publically available GWAS summary-level data of individuals with European ancestry. Users of our web-based tool only need to upload summary results for their trait(s) of interest; and the web server will automatically test their results against GWAS results from (currently) 173 other traits/diseases. The proposed database and web interface calculates the SNP heritability for the uploaded phenotype(s), and a genetic correlation matrix across traits. LD Hub allows the user to conduct the analysis on specific phenotypes only or perform a hypothesis free screen across all traits in the database (Table 1). Users have the option of uploading their own results files and the option of adding their GWAS results to the database for inclusion in future releases. The resource is continuously updated and curated every month to include new results from users and publicly available sources alike. The pre-computed genetic correlation matrix will be provided on LD-Hub for all traits included in the database.
2 Methods
As summarized in Figure 1, LD Hub includes: (1) Lookup Center: a facility to perform lookups of existing LD score regression results; (2) Database: a GWAS summary-level statistics database, (3) Test Center: a web interface that automates the LD score regression analysis pipeline including the calculation of SNP heritability and genetic correlations and (4) GWAShare Center: a user contribution and data sharing platform
Fig. 1.
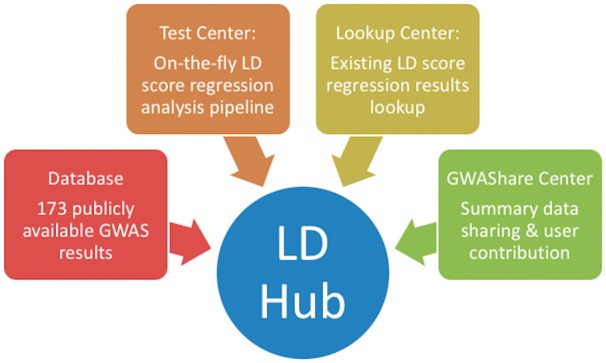
Scope and features of LD Hub. The LD Hub server provides three features: (i) Test Centre, which is an automatic LD score regression platform, (ii) Lookup Center, which allows users to lookup LD score regression results for their trait(s) of interest and (iii) GWAShare Center, which allows users to share their GWAS summary results and contribute to the field
2.1 LD Hub database
2.1.1. GWAS summary-level data
We cleaned and harmonized 963 publicly available GWAS summary-level datasets from 36 consortia, which included 82 diseases, 154 complex traits, 576 metabolites and 151 immune markers (Hemani et al, in preparation).
From this database pool, we chose datasets that fit the following selection criteria:
Non-sex-stratified
Meta-analyses of predominantly European populations. We include a few GWAS meta-analyses that contain a small proportion of non-European individuals in them in the LD Hub database. Whilst we believe the effect of these small numbers of non-European individuals on the LD Score regression analyses will be relatively minor, users should be aware that results from these meta-analyses may be less robust because of inconsistent patterns of linkage disequilibrium between individuals of different ancestry. In order to flag these studies to the user, we have included an additional field in the Test Center and the GWAShare Center (last column) that indicates the population ancestry of individuals in the corresponding meta-analysis, as well as a similar field in the LD Score regression results file (see also Table S1).
Meta-analyses using a GWAS backbone chip only (i.e. exclude meta-analyses involving immuno | metabo | psych | exome chip or GWAS + custom chip)
Number of SNPs is large (N > 450 000)
Number of individuals is large (N > 5000)
Mean Chi-square of the test statistics is larger than 1
As shown in Figure 2, after filtering on the selection criteria, genome-wide results for 173 traits were included in LD Hub, of which 18 are GWAS of diseases (Boraska et al., 2014; Cross-Disorder Group of the Psychiatric Genomics Consortium, 2013; Lambert et al., 2013; Liu et al 2015; Moffatt et al., 2007; Morris et al., 2012; Neale et al., 2010; Nikpay et al., 2015; Okada et al., 2013; Paternoster et al., 2015; Ripke et al., 2012; Ripke et al., 2014; Simon-Sanchez et al., 2009; Sklar et al., 2011), 48 are medically relevant risk factors/complex traits (Benyamin et al., 2013; Berndt et al., 2013; Bradfield et al., 2012; Dastani et al., 2012; de Moor et al., 2010; Dupuis et al., 2010; Estrada et al., 2012; Furberg et al., 2010; Horikoshi et al., 2012; Huffman et al., 2015; Lango Allen et al., 2010; Manning et al. 2012; Moffatt et al., 2007; Pattaro et al., 2016; Perry et al., 2014; Rietveld et al., 2014; Rietveld et al., 2013; Saxena et al., 2010; Shungin et al., 2015; Soranzo et al., 2010; Speliotes et al., 2010; Taal et al., 2012; Teslovich et al., 2010; Teumer et al., 2016; van den Berg et al., 2014; van der Valk et al., 2014) and 107 are metabolites (Kettunen et al., 2016). Table S1, displays descriptive information for each of the GWAS in LD Hub, including, trait name, consortium name, ethnicity, gender, sample size, PubMed ID, year of publication and other relevant information.
Fig. 2.

Contents of LD Hub. In total, data for 173 traits are included in LD Hub, which consist of 18 diseases, 48 complex traits and 107 metabolites
2.1.2. LD score information
We pre-calculated LD scores for each SNP using individuals of European ancestry from the 1000 Genomes project (1000 Genomes Project Consortium, 2012). These LD scores are suitable for standard LD score analyses in European populations (i.e. the LD score regression intercept, heritability, genetic correlation, cross-sex genetic correlation).
2.2 LD Hub web interface
The LD Hub web interface framework was developed using Python Django v1.8 as the LD score regression program is written using Python.
2.2.1. Test center
The LD Hub web interface provides an automatic LD score regression analysis pipeline for users. As shown in Figure 3, the LD Hub analysis pipeline consists of 5 major steps:
Fig. 3.
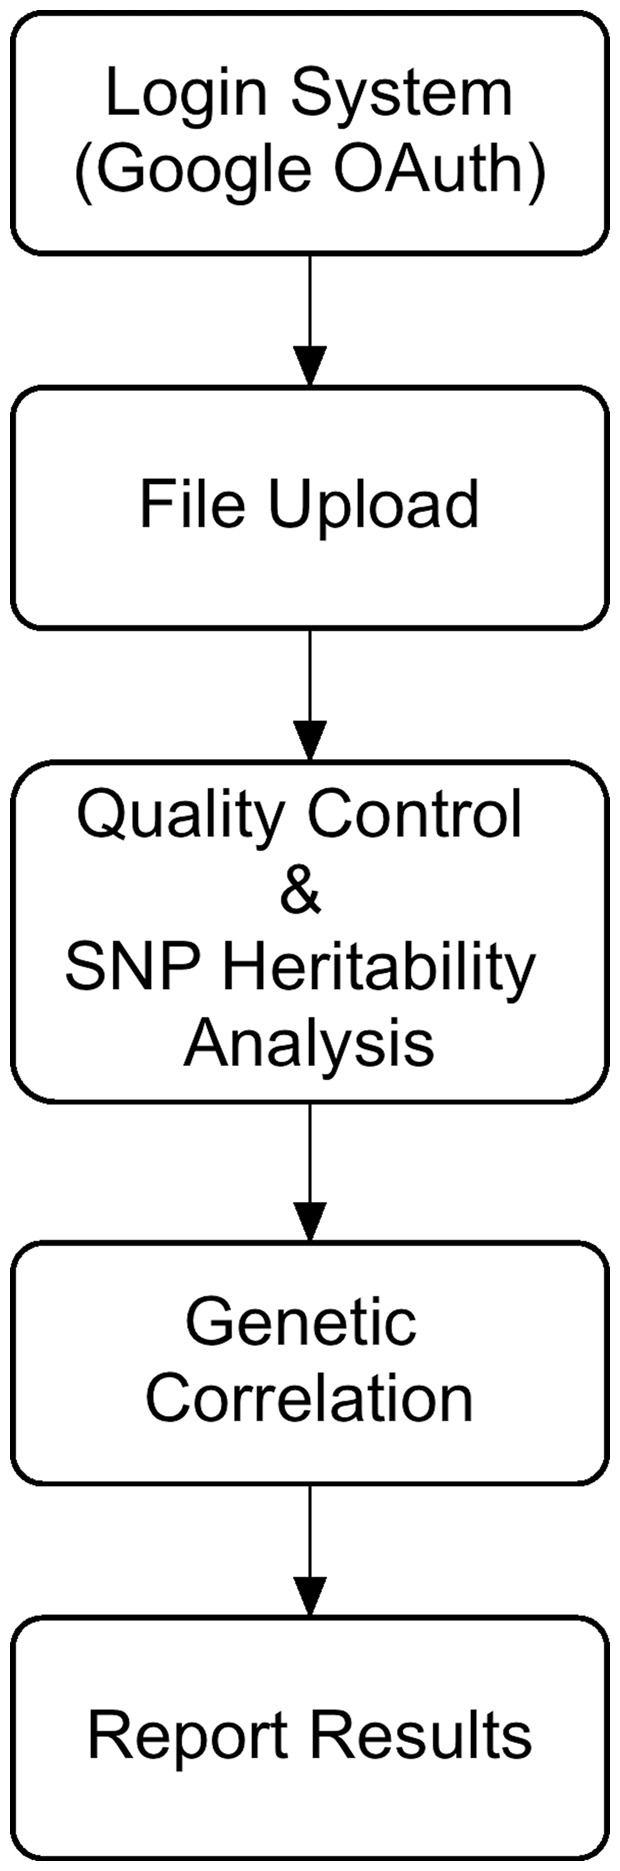
Schematic of LD Hub workflow. To start using LD Hub, users are required to login using a GMail (compatible) account. Once logged in, the users can then navigate their way around, selecting the features and databases they are interested in
User login system: using a Google OAuth system (login by using a Google account)
-
File upload system: To run the LD score analysis pipeline, LD Hub requires upload of a file containing summary results data. In the web interface, we provide an example GWAS results file to illustrate the file format required for successful upload and analysis by LD Hub. To save uploading time, each results file should be a white space delimited zipped text file (LD Hub accepts both tab and/or space delimited zipped text files) in which each row contains the results from a single SNP whilst the columns comprise the following fields:
SNP ID (rs number)
Effect allele of the SNP
Alternate allele of the SNP
Sample size of each SNP (can use an overall sample size if sample size for some SNPs is missing)
A signed summary statistic where the sign refers to the addition of the effect allele (i.e. any statistic that can be converted into a Z-score)
P value of the SNP
Minor allele frequency of each SNP (optional)
SNP Imputation quality (optional)
-
Quality control and heritability analysis: To standardize the input file, quality control is automatically performed on the uploaded file.
For studies that provide sample MAF, a filter to include SNPs with MAF above 1%.
In order to restrict the analysis to well-imputed SNPs, we filter the uploaded SNPs to HapMap3 SNPs (International HapMap 3 Consortium et al., 2010) with 1000 Genomes EUR MAF above 5%, which tend to be well-imputed in most studies. In the future, as the ability to impute lower frequency SNPs improves we will investigate the possibility of including other SNPs in the analysis using resources like the Haplotype Resource Consortium (HRC).
If sample size varies from SNP to SNP, remove SNPs with an effective sample size less than 0.67 times the 90th percentile of sample size.
Remove insertions and deletions (INDELs) and structural variants.
Remove strand-ambiguous SNPs.
Remove SNPs whose alleles do not match those in the 1000 Genomes data.
Remove SNPs within the major histocompatibility complex (MHC) region (i.e. SNPs between 26Mb and 34Mb on chromosome six) since these often display extreme LD and/or effect sizes. Inclusion of these outlying SNPs would have the potential to bias results of SNP heritability and genetic correlation analyses similar to the inclusion of outliers in traditional regression analyses and would therefore be inappropriate.
Because outliers can unduly influence the regression, we also removed SNPs with extremely large effect sizes (X12 > 80). The second part of this step is the SNP heritability analysis. The results of this analysis provide a useful indication of whether genetic correlation analysis is likely to be informative (Bulik-Sullivan et al., 2015b). We recommend that users restrict subsequent genetic correlation analyses to GWAS that achieve a Z score of at least four in SNP heritability analyses on the grounds of interpretability and power. Genetic correlations that are derived from GWAS with Z scores < 4 are flagged with a note (Table S1).
Genetic correlation analysis. The LD Hub pipeline will perform genetic correlation analysis on the uploaded GWAS results after the SNP heritability analysis. Users have the option of selecting which traits they want to include in the analysis. Occasionally LD Hub will produce estimates of the genetic correlation that exceed positive or minus one. Often these estimates will involve GWAS that are small in size, exhibit low SNP heritability Z scores (we recommend Z scores > 4 to be interpretable), and large standard errors around the genetic correlation estimate. We advise the user to treat these estimates as unreliable and discard them. In contrast, it is also possible for genetic correlation estimates to exceed one if the analysis involves two very similar traits from large GWAS that exhibit good power (e.g. GWAS of body mass index and obesity). In this case, the true genetic correlation is probably one and the user is advised to interpret the results accordingly.
Reporting of results. LD Hub returns three output (results) files to the users: (i) A log file with quality control information with regards to the uploaded GWAS summary data; (ii) A ‘h2.log’ file with the SNP heritability information about the uploaded GWAS data and (iii) A ‘rg.results.csv’ file with pair-wise genetic correlations between the uploaded GWAS results and the selected GWASs in LD Hub.
2.2.2. Lookup center
Another feature of the LD Hub web interface is the heritability and genetic correlation ‘lookup’ function for GWAS results which currently exist in the LD Hub database. In the current version (v1.0), we provide (i) SNP heritability and (ii) genetic correlation results. Both, tables and downloadable links can be found on the Lookup Center webpage.
2.2.3. GWAShare center
We aim to promote sharing of summary GWAS results data and to this extent we have included web links to all the publicly available summary GWAS results data that we have incorporated into LD Hub (users will find this link in the GWAShare Center along with a PubMed identifier detailing which study the data came from). In the case of summary results GWAS data that are not publicly available outside LD Hub, users will need to get in touch with the authors of the study themselves to request the data. Users may find this feature useful in conducting other types of SNP comparative study outside the scope of LD Hub as well as following up interesting genetic correlations. We encourage users of LD Hub to upload their GWAS results for curation into the database. We will update the database regularly and allow other users to use the shared data for LD score regression analyses, which will then benefit the whole human genetics community.
2.3 LD Hub applied example: atopic dermatitis
In order to illustrate the utility of LD Hub, we conduct an analysis using summary results data from a large GWAS of atopic dermatitis (AD) for 40 835 (10 788 cases and 30 047 controls, sample prevalence: 0.264) individuals of European ancestry (i.e. the whole discovery set except 23andMe results) (Paternoster et al., 2015). In total, 11 059 640 SNPs were included in this meta-analysis. Since AD is influenced by a gene of major effect, i.e. filaggrin—variants in this region have allelic odds ratios > 7 (Sandilands et al., 2007), which could bias estimates from LD Hub, we excluded this region from the uploaded results file. For traits/diseases that have a single locus of disproportionately large effect (i.e. χ2 > 80) compared to the rest of the genome, we recommend the exclusion of SNPs in these regions as good practice when using LD Hub (and LD score regression in general), since the inclusion of these SNPs could unduly leverage the regressions and consequently the estimates of genetic correlations and SNP heritability. However, with the exception of autoimmune diseases (SNPs in the MHC can have large effects on certain autoimmune diseases), it is unusual for common traits/diseases to exhibit a single locus of large effect, and thus this potential source of bias should not be an issue for a majority of diseases/traits. For traits that exhibit a single locus of disproportionately large effect (χ2 > 80), we recommend fine-mapping and direct evaluation of overlap in the particular region to assess whether genetic effects are shared, and LD score regression of the rest of the genome with this particular region excluded from analyses. After the abovementioned quality control steps, 1 215 002 SNPs were selected for upload.
3 Results
3.1 Validation of LD Hub analysis results
We tested the validity and functionality of LD Hub by replicating previously reported results from the original LD Score regression suite of papers (Bulik-Sullivan et al., 2015a, b).
We compared SNP heritability results between LD Hub and previously reported LD score regression results (Bulik-Sullivan et al., 2015a). As shown in Table S2, the Mean χ2, λGC and Intercept results are almost the same. The minor discrepancies observed are a consequence of using slightly different quality control processes for LD Hub compared to what was used in the original LD Score regression paper. Results for the SNP heritability of 173 traits are shown in Table S1.
We also compared the genetic correlation analysis results between LD Hub and previously reported results (Bulik-Sullivan et al., 2015b). As shown in Figure 4, the genetic correlation and standard error of genetic correlation estimates are consistent with previously reported LD score regression genetic correlation results. A comparison of the genetic correlation results of 49 (previously reported) traits is shown in Table S3.
Fig 4.

Comparison of genetic correlation results between LD Hub and previously reported LD score regression results. Double blue lines represent genetic correlation results from LD Hub, and the black single lines represent genetic correlation results from previously reported LD score regression results. The discrepancies can be attributed to the minor changes in the quality control processes and the replacement of some GWAS results with more recent versions
3.2 Case study: atopic dermatitis
Table 2 shows SNP heritability estimates for AD computed with and without SNPs from the filaggrin region. The figure of 7.8% (9.7%) is low particularly compared to the heritability estimates from twin studies of eczema where figures exceeding 80% are not uncommon (Bataille et al., 2012). This could be for a number of reasons including the fact that genomic control correction in the individual meta-analysis studies causes downward bias, and the fact that LD score regression provides an estimate of the overall proportion of additive genetic variance tagged by SNPs in the GWAS panel (i.e. SNP heritability), rather than total heritability per se. However the greatest contributing factor is likely to be the case definition of AD used in the EAGLE consortium paper (http://www.wikigenes.org/e/art/e/348.html) which is extremely heterogeneous, relying often on self-reported data or retrospective recall which will introduce substantial measurement error into the analysis (and hence decrease heritability estimates). Our results strongly suggest that reanalysis using a more precise definition of eczema would result in a cleaner phenotype and consequently increase the number of genome-wide significant loci detected.
Table 2.
SNP heritability for atopic dermatitis
| Type of Heritability Scale | H2 | SE_H2 | λGC | Mean χ2 | Intercept |
|---|---|---|---|---|---|
| Observed Scale (no filaggrin) | 0.071 | 0.016 | 1.053 | 1.080 | 1.034 |
| Liability Scale (no filaggrin) | 0.078 | 0.018 | 1.053 | 1.080 | 1.034 |
| Observed Scale (with filaggrin) | 0.073 | 0.018 | 1.054 | 1.083 | 1.034 |
| Liability Scale (with filaggrin) | 0.097 | 0.020 | 1.054 | 1.083 | 1.034 |
H2 and SE_H2 refer to the SNP heritability and standard error of the SNP heritability.
Table 3 displays estimated genetic correlations between AD and several immune mediated diseases recorded in LD Hub. As expected, the estimated genetic correlation (rG) between AD and asthma was strongly significant and positive. We also note that the rG between AD and Crohn’s disease was moderate, significant and positive, perhaps reflecting substantial overlap between currently known loci for both conditions (Paternoster et al., 2015). rG did not differ significantly from zero for the other traits, although the point estimates for several were moderate indicating that follow up when larger samples become available may be justified.
Table 3.
Genetic correlation between atopic dermatitis and other immune mediated diseases
| Traits | rG | SE_rG | P_rG |
|---|---|---|---|
| Crohn's disease | 0.18 | 0.09 | 0.03 |
| Ulcerative colitis | 0.10 | 0.10 | 0.31 |
| Asthma | 0.55 | 0.15 | 0.0002 |
| Rheumatoid Arthritis | −0.07 | 0.08 | 0.40 |
rG refers to the genetic correlation between two traits, SE_rG is the standard error of the genetic correlation, P_rG is the p value of the genetic correlation.
4 Discussion
In this paper, we describe LD Hub (accessible at http://ldsc.broadinstitute.org/), a web-based utility that centralizes and harmonizes summary-level GWAS results data, and automates LD Score regression analysis (Bulik-Sullivan et al., 2015a, b).
GWAS meta-analysis summary statistics are increasingly being made publicly available. Our database (currently) utilizes results from 173 different GWAS, which includes the majority of publicly available GWAS summary results suitable for LD Score regression (Bulik Sullivan et al., 2015a). However, this represents a small proportion of the traits represented in the GWAS Catalog (https://www.ebi.ac.uk/gwas/) (Hindorff et al., 2009; Welter et al., 2014). There is thus an urgent need for increased sharing of GWAS meta-analysis results in order to realize the full potential of techniques that utilize summary results data such as LD score regression. LD Hub provides a natural platform for the distribution of summary results data that can be utilized by the whole genetics community.
There are four major advantages of using our database and web interface:
Users of LD Score regression currently spend most of their time reformatting, harmonizing and managing summary results data rather than running the ‘actual’ analyses. LD Hub minimizes the proportion of time spent on the former so that users can focus their attention on interpreting interesting genetic correlations and SNP heritability estimates.
Users who do not have a computational background will find the interface easier to use
The software is computationally very fast. The current version (v1.0) can return the systematic analysis results to the user within a few hours. A queuing system has been introduced to prevent the server from crashing.
As users upload and share their own summary GWAS results, the resource becomes increasingly useful.
We envisage LD Hub as a useful hypothesis generating tool, providing an easy method of screening hundreds/thousands of traits for interesting genetic correlations that could subsequently be followed up in further detail by other approaches such as pathway analysis (Segrè et al., 2010) or Mendelian randomization (Davey-Smith and Ebrahim, 2003). For example, under most models, a causal relationship between two heritable traits should induce a genetic correlation between the two phenotypes (assuming individual differences in the causal trait are influenced by genetic variation). LD Hub could be used to screen a large number of putatively causally related phenotypes quickly and easily for evidence of genetic correlation, and the most promising candidate pairs could then be followed up by selecting appropriate genetic instruments and performing formal instrumental variables analysis (Evans Davey-Smith, 2015) which can be implemented via the online platform MR-Base (www.mrbase.org/beta). This framework could be particularly useful in the dissection of high dimensional molecular networks where the number of possible pair-wise relationships may be extremely large.
For LD Hub, we list a few suggestions/limitations here:
-
In order for estimates of the genetic correlation to be reliable we suggest that traits uploaded meet the following criteria
Heritability (H2) Z score is at least > 1.5 (optimal > 4)
Mean Chi square of the test statistics > 1.02
The intercept estimated from the SNP heritability analysis is between 0.9 and 1.1
As we aim to provide an analysis pipeline that is as systematic as possible, we used a very inclusive strategy for data selection, where we expect a small proportion of the analyses (especially for the traits with notes in Table S1) to return null results.
LD Hub is currently designed for GWAS studies involving European populations exclusively. As the number of publicly available GWAS involving other ethnicities increases we will extend LD Hub to include these.
In summary, due to the growing availability of summary-level data, our database together with the web interface will maximize the potential of GWAS summary-level data for heritability and genetic correlation analyses.
Funding
This work was supported by the Medical Research Council (MC_UU_12013/4 and MC_UU_12013/8). This work was also supported by the following grants: 1R01MH101244-02 (Statistical methods for studies of rare variants) and 1R01MH107649-01 (Methods for linking GWAS peaks to function in psychiatric disease) D.M.E. is supported by an Australian Research Council Future Fellowship (FT130101709). This work was in part supported by Cancer Research UK programme grant number C18281/A19169 (the Integrative Cancer Epidemiology Programme). P.H. is a Cancer Research UK Population Research Fellow (grant number C52724/A20138).
Conflict of Interest: none declared.
Supplementary Material
Acknowledgements
We would like to thank Kaitlin Wade, Vanessa Tan, Ryan Langdon and James Yarmolinsky for helping curate the GWAS data information. We also thank Gabriel Cuellar Partida for suggestions on the web interface; and Penelope Lind for testing the website and providing valuable feedback.
References
- 1000 Genomes Project Consortium. (2012) An integrated map of genetic variation from 1,092 human genomes. Nature, 491, 56–65. [TQ1] [DOI] [PMC free article] [PubMed] [Google Scholar]
- Bataille V. et al. (2012) The use of the twin model to investigate the genetics and epigenetics of skin diseases with genomic, transcriptomic and methylation data. J. Eur. Acad. Dermatol. Venereol., 26, 1067–1073. [DOI] [PubMed] [Google Scholar]
- Benyamin B. et al. (2013) Childhood intelligence is heritable, highly polygenic and associated with FNBP1L. Mol. Psychiatry, 19, 253–258. [DOI] [PMC free article] [PubMed] [Google Scholar]
- Berndt S. et al. (2013) Genome-wide meta-analysis identifies 11 new loci for anthropometric traits and provides insights into genetic architecture. Nat. Genet., 45, 501–512. [DOI] [PMC free article] [PubMed] [Google Scholar]
- Boraska V. et al. (2014) A genome-wide association study of anorexia nervosa. Mol. Psychiatry, 19, 1085–1094. [DOI] [PMC free article] [PubMed] [Google Scholar]
- Bradfield J. et al. (2012) A genome-wide association meta-analysis identifies new childhood obesity loci. Nat. Genet., 44, 526–531. [DOI] [PMC free article] [PubMed] [Google Scholar]
- Bulik-Sullivan et al. (2015a) LD score regression distinguishes confounding from polygenicity in genome-wide association studies. Nat. Genet., 47, 291–295. [DOI] [PMC free article] [PubMed] [Google Scholar]
- Bulik-Sullivan et al. (2015b) An atlas of genetic correlations across human diseases and traits. Nat. Genet., 47, 1236–1241. [DOI] [PMC free article] [PubMed] [Google Scholar]
- Cross-Disorder Group of the Psychiatric Genomics Consortium. (2013) Identification of risk loci with shared effects on five major psychiatric disorders: a genome-wide analysis. Lancet, 381, 1371–1379. [DOI] [PMC free article] [PubMed] [Google Scholar]
- Dastani Z. et al. (2012) Novel loci for adiponectin levels and their influence on type 2 diabetes and metabolic traits: a multi-ethnic meta-analysis of 45,891 individuals. PLoS Genet., 8, e1002607.. [DOI] [PMC free article] [PubMed] [Google Scholar]
- Davey Smith G., Ebrahim S. (2003) Mendelian randomization: can genetic epidemiology contribute to understanding environmental determinants of disease? Int. J. Epidemiol., 32, 1–22. [DOI] [PubMed] [Google Scholar]
- de Moor M. et al. (2010) Meta-analysis of genome-wide association studies for personality. Mol. Psychiatry, 17, 337–349. [DOI] [PMC free article] [PubMed] [Google Scholar]
- Dupuis J. et al. (2010) New genetic loci implicated in fasting glucose homeostasis and their impact on type 2 diabetes risk. Nat. Genet., 42, 105–116. [DOI] [PMC free article] [PubMed] [Google Scholar]
- East E.M. (1916) Studies on size inheritance in Nicotiana. Genetics, 1, 164–176. [DOI] [PMC free article] [PubMed] [Google Scholar]
- Estrada K. et al. (2012) Genome-wide meta-analysis identifies 56 bone mineral density loci and reveals 14 loci associated with risk of fracture. Nat. Genet., 44, 491–501. [DOI] [PMC free article] [PubMed] [Google Scholar]
- Evans D.M., Davey Smith G. (2015) Mendelian randomization: new applications in the coming age of hypothesis-free causality. Annu. Rev. Genomics Hum. Genet., 16, 327–350. [DOI] [PubMed] [Google Scholar]
- Finucane H.K. et al. (2015) Partitioning heritability by functional category using GWAS summary statistics. Nat. Genet., 47, 1228–1235. [DOI] [PMC free article] [PubMed] [Google Scholar]
- Fisher R.A. (1918) The correlation between relatives on the supposition of Mendelian inheritance. Philos. Transac. R. Soc. Edinburgh, 52, 399–433. [Google Scholar]
- Furberg H. et al. (2010) Genome-wide meta-analyses identify multiple loci associated with smoking behavior. Nat. Genet., 42, 441–447. [DOI] [PMC free article] [PubMed] [Google Scholar]
- Gusev A. et al. (2014) Partitioning heritability of regulatory and cell-type-specific variants across 11 common diseases. Am. J. Hum. Genet., 95, 535–552. [DOI] [PMC free article] [PubMed] [Google Scholar]
- Hindorff L.A. et al. (2009) Potential etiologic and functional implications of genome-wide association loci for human diseases and traits. Proc. Natl Acad. Sci. USA., 106, 9362–9367. [DOI] [PMC free article] [PubMed] [Google Scholar]
- Horikoshi M. et al. (2012) New loci associated with birth weight identify genetic links between intrauterine growth and adult height and metabolism. Nat. Genet., 45, 76–82. [DOI] [PMC free article] [PubMed] [Google Scholar]
- Huffman J. et al. (2015) Modulation of genetic associations with serum urate levels by body-mass-index in humans. PLos One, 10, e0119752.. [DOI] [PMC free article] [PubMed] [Google Scholar]
- International HapMap 3 Consortium. (2010) Integrating common and rare genetic variation in diverse human populations. Nature, 467, 52–58. [DOI] [PMC free article] [PubMed] [Google Scholar]
- Kettunen J. et al. (2016) Genome-wide study for circulating metabolites identifies 62 loci and reveals novel systemic effects of LPA. Nat. Commun., 23, 11122.. [DOI] [PMC free article] [PubMed] [Google Scholar]
- Lambert J. et al. (2013) Meta-analysis of 74,046 individuals identifies 11 new susceptibility loci for Alzheimer's disease. Nat. Genet., 45, 1452–1458. [DOI] [PMC free article] [PubMed] [Google Scholar]
- Lango Allen H. et al. (2010) Hundreds of variants clustered in genomic loci and biological pathways affect human height. Nature, 467, 832–838. [DOI] [PMC free article] [PubMed] [Google Scholar]
- Lee H. et al. (2011) Estimating missing heritability for disease from genome-wide association studies. Am. J. Hum. Genet., 88, 294–305. [DOI] [PMC free article] [PubMed] [Google Scholar]
- Lee H. et al. (2012) Estimation of pleiotropy between complex diseases using SNP-derived genomic relationships and restricted maximum likelihood. Bioinformatics, 28, 2540–2542. [DOI] [PMC free article] [PubMed] [Google Scholar]
- Liu J.Z. et al. (2015) Association analyses identify 38 susceptibility loci for inflammatory bowel disease and highlight shared genetic risk across populations. Nat. Genet., 47, 979–986. [DOI] [PMC free article] [PubMed] [Google Scholar]
- Manning A. et al. (2012) A genome-wide approach accounting for body mass index identifies genetic variants influencing fasting glycemic traits and insulin resistance. Nat. Genet., 44, 659–669. [DOI] [PMC free article] [PubMed] [Google Scholar]
- Moffatt M.F. et al. (2007) Genetic variants regulating ORMDL3 expression contribute to the risk of childhood asthma. Nature, 448, 470–473. [DOI] [PubMed] [Google Scholar]
- Morris A. et al. (2012) Large-scale association analysis provides insights into the genetic architecture and pathophysiology of type 2 diabetes. Nat. Genet., 44, 981–990. [DOI] [PMC free article] [PubMed] [Google Scholar]
- Neale B. et al. (2010) Meta-analysis of genome-wide association studies of attention-deficit/hyperactivity disorder. J. Am. Acad. Child Adolesc. Psychiatry, 49, 884–897. [DOI] [PMC free article] [PubMed] [Google Scholar]
- Nikpay M. et al. (2015) A comprehensive 1,000 Genomes-based genome-wide association meta-analysis of coronary artery disease. Nat. Genet., 47, 1121–1130. [DOI] [PMC free article] [PubMed] [Google Scholar]
- Okada Y. et al. (2013) Genetics of rheumatoid arthritis contributes to biology and drug discovery. Nature, 506, 376–381. [DOI] [PMC free article] [PubMed] [Google Scholar]
- Paternoster L. et al. (2015) Multi-ancestry genome-wide association study of 21,000 cases and 95,000 controls identifies new risk loci for atopic dermatitis. Nat. Genet., 47, 1449–1456. [DOI] [PMC free article] [PubMed] [Google Scholar]
- Pattaro C. et al. (2016) Genetic associations at 53 loci highlight cell types and biological pathways relevant for kidney function. Nat. Commun., 21, 10023.. [DOI] [PMC free article] [PubMed] [Google Scholar]
- Perry J. et al. (2014) Parent-of-origin-specific allelic associations among 106 genomic loci for age at menarche. Nature, 514, 92–97. [DOI] [PMC free article] [PubMed] [Google Scholar]
- Rietveld C. et al. (2013) GWAS of 126,559 individuals identifies genetic variants associated with educational attainment. Science, 340, 1467–1471. [DOI] [PMC free article] [PubMed] [Google Scholar]
- Rietveld C. et al. (2014) Common genetic variants associated with cognitive performance identified using the proxy-phenotype method. Proc. Natl. Acad. Sci., 111, 13790–13794. [DOI] [PMC free article] [PubMed] [Google Scholar]
- Ripke S. et al. (2012) A mega-analysis of genome-wide association studies for major depressive disorder. Mol. Psychiatry, 18, 497–511. [DOI] [PMC free article] [PubMed] [Google Scholar]
- Ripke S. et al. (2014) Biological insights from 108 schizophrenia-associated genetic loci. Nature, 511, 421–427. [DOI] [PMC free article] [PubMed] [Google Scholar]
- Sandilands A. et al. (2007) Comprehensive analysis of the gene encoding filaggrin uncovers prevalent and rare mutations in ichthyosis vulgaris and atopic eczema. Nat. Genet., 39, 650–654. [DOI] [PubMed] [Google Scholar]
- Saxena R. et al. (2010) Genetic variation in GIPR influences the glucose and insulin responses to an oral glucose challenge. Nat. Genet., 42, 142–148. [DOI] [PMC free article] [PubMed] [Google Scholar]
- Segrè A.V. et al. (2010) Common inherited variation in mitochondrial genes is not enriched for associations with type 2 diabetes or related glycemic traits. PLoS Genet., 6, e1001058.. [DOI] [PMC free article] [PubMed] [Google Scholar]
- Shungin D. et al. (2015) New genetic loci link adipose and insulin biology to body fat distribution. Nature, 518, 187–196. [DOI] [PMC free article] [PubMed] [Google Scholar]
- Simon-Sanchez J. et al. (2009) Genome-wide association study reveals genetic risk underlying Parkinson's disease. Nat. Genet., 41, 1308–1312. [DOI] [PMC free article] [PubMed] [Google Scholar]
- Sklar P. et al. (2011) Large-scale genome-wide association analysis of bipolar disorder identifies a new susceptibility locus near ODZ4. Nat. Genet., 43, 977–983. [DOI] [PMC free article] [PubMed] [Google Scholar]
- Soranzo N. et al. (2010) Common variants at 10 genomic loci influence hemoglobin A1C levels via glycemic and nonglycemic pathways. Diabetes, 59, 3229–3239. [DOI] [PMC free article] [PubMed] [Google Scholar]
- Speed D. et al. (2012) Improved heritability estimation from genome-wide SNPs. Am J Hum Genet, 91, 1011–1021. [DOI] [PMC free article] [PubMed] [Google Scholar]
- Speliotes E. et al. (2010) Association analyses of 249,796 individuals reveal 18 new loci associated with body mass index. Nat. Genet., 42, 937–948. [DOI] [PMC free article] [PubMed] [Google Scholar]
- Taal H. et al. (2012) Common variants at 12q15 and 12q24 are associated with infant head circumference. Nat. Genet., 44, 532–538. [DOI] [PMC free article] [PubMed] [Google Scholar]
- Teslovich T. et al. (2010) Biological, clinical and population relevance of 95 loci for blood lipids. Nature, 466, 707–713. [DOI] [PMC free article] [PubMed] [Google Scholar]
- Teumer A. et al. (2016) Genome-wide association studies identify genetic loci associated with albuminuria in diabetes. Diabetes, 65, 803–817. [DOI] [PMC free article] [PubMed] [Google Scholar]
- van den Berg S. et al. (2014) Harmonization of neuroticism and extraversion phenotypes across inventories and cohorts in the genetics of personality consortium: an application of item response theory. Behav. Genet., 44, 295–313. [DOI] [PMC free article] [PubMed] [Google Scholar]
- van der Valk R. et al. (2014) A novel common variant in DCST2 is associated with length in early life and height in adulthood. Hum. Mol. Genet., 24, 1155–1168. [DOI] [PMC free article] [PubMed] [Google Scholar]
- Welter D. et al. (2014) The NHGRI GWAS Catalog, a curated resource of SNP-trait associations. Nucleic Acids Res., 42, D1001–D1006. [DOI] [PMC free article] [PubMed] [Google Scholar]
- Yang J. et al. (2010) Common SNPS explain a large proportion of the heritability for human height. Nat. Genet., 42, 565–569. [DOI] [PMC free article] [PubMed] [Google Scholar]
- Yang J. et al. (2011) GCTA: a tool for genome-wide complex trait analysis. Am. J. Hum. Genet., 88, 76–82. [DOI] [PMC free article] [PubMed] [Google Scholar]
- Zheng J. et al. (2013) Sequential sentinel SNP Regional Association Plots (SSS-RAP): an approach for testing independence of SNP association signals using meta-analysis data. Ann. Hum. Genet., 77, 67–79. [DOI] [PubMed] [Google Scholar]
Associated Data
This section collects any data citations, data availability statements, or supplementary materials included in this article.