

Abstract
In recent years the development of Single-Photon Avalanche Diodes (SPADs) had a big impact on single-photon counting applications requiring high-performance detectors in terms of Dark Count Rate (DCR), Photon Detection Efficiency (PDE), afterpulsing probability, etc. Among these, it is possible to find applications in single-molecule fluorescence spectroscopy that suffer from long-time measurements. In these cases SPAD arrays can be a solution in order to shorten the measurement time, thanks to the high grade of parallelism they can provide. Moreover, applications in other fields (e.g. astronomy) demand for large-area single-photon detectors, able also to handle very high count rates.
For these reasons we developed a new single-photon detection module, featuring an 8 × 8 SPAD array. Thanks to a dedicated silicon technology, the performance of the detector have been finely optimized, reaching a 49% detection efficiency at 550 nm, as well as low dark counts (2 kcount/s maximum all over the array). This module can be used in two different modes: the first is a multi-spot configuration, allowing the acquisition of 64 optical signals at the same time and considerably reducing the time needed for a measurement. The second operation mode instead exploits all the pixels in a combined mode, allowing the detection of a 64-times higher maximum photon rate (up to 2 Gcount/s). In addition, this configuration provides also an extended dynamic range and allows to attain photon number resolving capabilities.
Dark counts, detection efficiency, linearity, afterpulsing and crosstalk probability have been characterized at different operating conditions.
Keywords: Array detectors, Single-Photon Avalanche Diodes (SPADs), photon counting, photon number resolving, gigacount rate
1. INTRODUCTION
For many years the interest in Single-Photon Avalanche Diodes (SPADs) has been growing and nowadays they are considered a valid solution in many single-photon counting and timing applications, overcoming the main limitations of PhotoMultiplier Tubes (PMTs), namely low quantum efficiency, sensitivity to magnetic fields and bulkiness.1 As an example, Single-Molecule Fluorescence Spectroscopy (SMFS)2 is today acknowledged by many researchers as a powerful technique in many fields related to biology, biochemistry and biophysics. In case of molecules freely diffusing in a liquid, the basic idea behind this technique is to excite with light a very small volume, with a low concentration of the analyte, collecting rare bursts of photons corresponding to the transit of a single molecule. However, burst detection is a challenging task, due to the small number of photons in each burst; high sensitivity is therefore a mandatory requirement for the single-photon detector. In addition, many bursts (corresponding to many different molecules) need to be measured and accumulated to reach a proper statistics, resulting in long measurement time. Multi-spot excitation and detection is a promising way to address the throughput limitations of single-molecule analysis:3 this requires the use of suitable arrays of single-photon detectors. Silicon SPADs, fabricated using custom planar technologies, are ideal candidates for this kind of application, thanks to their high Photon Detection Efficiency (PDE), low noise, large active area and compatibility to be fabricated in arrays.
At the same time, different fields are starting to push also for detectors able to stand free running operation at very high count rates, often in the order of Gcount/s. Some examples can be found in quantum astronomy4 or Quantum Key Distribution (QKD).5 Going in this direction, different solutions are already present in literature: on one hand Superconducting Nanowire Single-Photon Detectors (SNSPDs)6 offer good performance, although their operating temperature usually limits the development of a compact solution. On the other hand, Silicon PhotoMultipliers (SiPMs)7 have been investigated also for high count rate applications, but paying the price of a degraded photon number resolving capability. In the end also solutions based on a multiplexed pool of single detectors8 have been theorized: however this design would be expensive and bulky and would require a low-loss switch.
In this paper we review the development of a complete detection module9 and we report also an extended experimental characterization recently performed. The module is based on a 64-pixel SPAD array, arranged in a 8×8 configuration, and it has been developed aiming at the aforementioned applications. Indeed, thanks to a fully parallel architecture, the module can be used in two different operating modes: exploiting a suitable optics, the module can be used in a multi-spot measurement in which each detector collects photons from a different source. But in addition the module can be also used in a combined-pixels configuration, in which the photons coming from a single source are widespread all over the array. In this case, each impinging photon can be detected by a random pixel, with multiple advantages: first the availability of 64 independent detectors allows to resolve the number of photons impinging at the same time on the array. Second, the maximum detectable number of photons in the unit of time is increased by a factor 64. Of course also the Dark Count Rate (DCR) in this configuration is increased, but in the end the dynamic range of the measurement is extended and this represents the highest dynamic range for a photon counting device, as reported in literature so far.
2. ARCHITECTURE OF THE DETECTION MODULE
2.1 The 8×8 SPAD array
The core of the photon detection module is a custom-technology square array of SPADs, with the pixels arranged in a 8×8 configuration, as depicted in Fig. 1. The single SPAD is a detector with a circular active area and a diameter of 50 μm, separated from the others by a pitch of 250 μm. The pixels are connected in a common cathode configuration, i.e. with a common voltage for all the cathodes and with an independent anode for each pixel, that can be connected to an independent Active Quenching Circuit (AQC). The average breakdown voltage is equal to 34.1 V at 25 °C, with a variability all over the array lower than 100 mV. The choice of a custom technology allows a fine tuning of the doping profile and, in turn, of the electric field inside the detector, that determines all the device performance. Nevertheless, with a custom technology it is not easy to integrate the quenching electronics in the detectors chip. Therefore the AQCs were fabricated with a 0.18-μm High-Voltage CMOS technology, in two separate chips of 32 fully independent channels.
Figure 1.
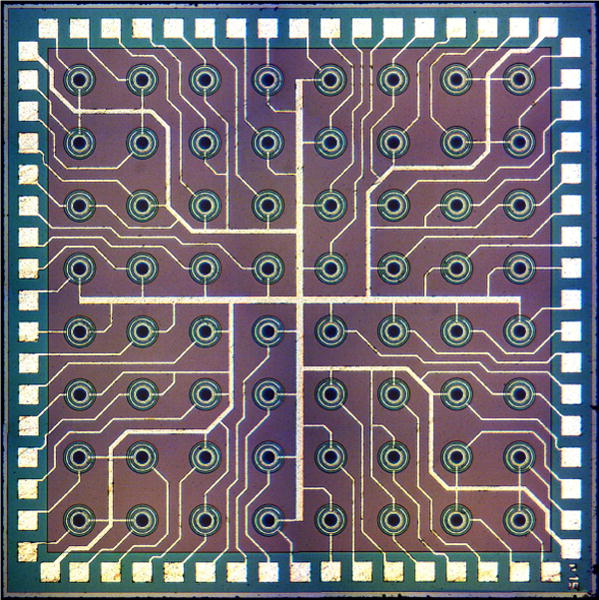
Microphotograph of the SPAD array, with the 8×8 configuration of the pixels. Size of the chip is 2.4×2.4 mm.
2.2 The system architecture
The SPAD array and the quenching electronics have been placed in a compact and complete detection module, conceived to be easily used in real applications. The module is showed in Fig. 2. In order to exploit the noise performance of the custom-technology SPADs at low temperature, the detector and the AQC have been assembled on a ThermoElectric Cooler (TEC). However, to prevent issues due to the formation of moisture on the array, the module is provided with a sealed chamber that is possible to fill with dry nitrogen by means of two valves. Surrounding the sealed chamber, two different boards have been stacked one on top of the other. The one on the bottom contains all the power circuits to generate and provide the voltage to all the module. In this board it is also present a Proportional-Integral-Derivative (PID) controller that, exploiting the TEC and a Negative Temperature Coefficient (NTC) thermistor in thermal contact with the detector, guarantees a stable temperature on the SPAD array. Indeed, it is possible to program this board to set different operating conditions, in terms of bias voltage (up to 8 V of excess bias) and temperature (down to −15 °C). The board on the top instead contains all the connections and the signal processing circuits needed to route the counting data to external systems. All the 64 AQCs are mounted on this board and in each of them there is an output that provides a pulse synchronous with each avalanche of the corresponding pixel. All the information are then sent to an FPGA that can in turn deliver the data to the external world in two different modes. In the first one the data are simply routed to an output VHDCI connector, providing the user with 64 outputs each one delivering pulses synchronous with the detection of a photon in the corresponding pixel. Instead in the second mode the FPGA accumulates the counts in time windows, whose duration is programmable by the user down to 1 ms. After that, the accumulated values are sent to an external PC through an USB interface and they can be easily recorded and displayed using a specific software developed for this task.
Figure 2.
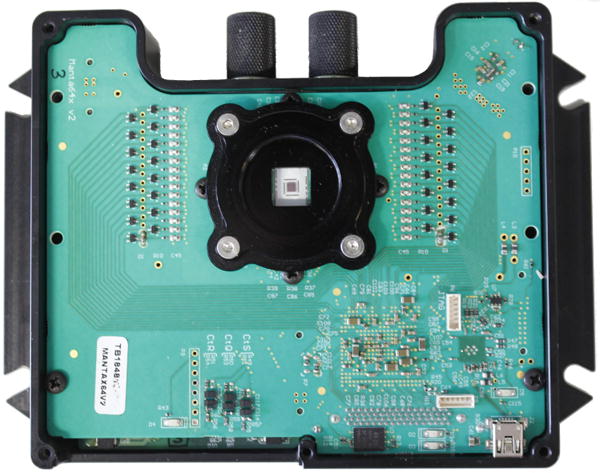
Front view of the detection module, where it is possible to notice the sealed chamber and the entrance window for the light.
3. EXPERIMENTAL CHARACTERIZATION
A full experimental characterization of the module has been performed. Dark counts, detection efficiency, afterpulsing and crosstalk probability have been measured for different operating temperatures and bias voltages, thanks to the fully programmable architecture already discussed. In addition also the linearity curve is presented to prove that the module works up to very high count rates.
3.1 Dark count rate
The DCR is defined as the average number of avalanches in the unit of time, when the detector has no photons impinging on it. This is the main source of noise in SPAD arrays. Although the actual source of the noise is the fluctuation of this value, the poissonian origin of the dark counts allows us to evaluate it simply looking at the mean value, averaged on a specific time interval for accuracy. Therefore, DCR measurements have been performed keeping the module in a dark environment, with no photons impinging on the array, and collecting the dark events through the USB interface in fixed time windows of 100 ms, for a total time of 25 s. Then the values have been normalized to 1 s and the measurement has been repeated as a function of the excess bias and the working temperature. Results of the measurement are presented in Fig. 3a, for T = −15 °C and different overvoltages, and in Fig. 3b, for Vov = 6 V and different temperatures. The data are showed using the so-called inverse cumulative distribution function, where for a given DCR on the y-axis it is possible to evaluate on the x-axis the percentage of pixels having a DCR less or equal to the chosen value. In order to build this graph, pixels have been sorted in increasing order of DCR and the x-axis has been rescaled between 0% and 100%. DCR distribution and dependencies are comparable to the ones already reported in literature1 for devices fabricated using the same technology.
Figure 3.
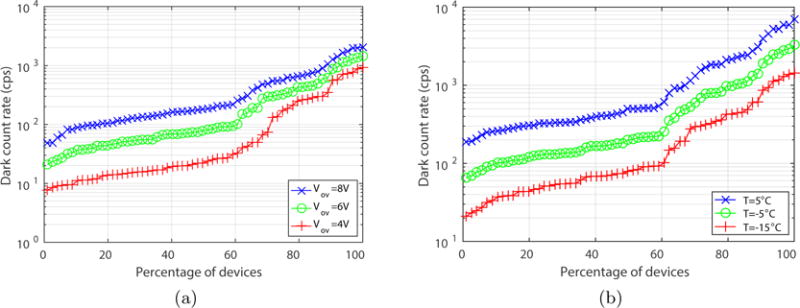
(a) DCR inverse cumulative distribution for different excess voltages. The operating temperature of the detectors is T = −15 °C. (b) DCR inverse cumulative distribution for different operating temperatures. The excess voltage of the detectors is Vov = 6 V.
3.2 Photon detection efficiency
The PDE is the ratio between the average number of detected photons and the total number of photons impinging on the device active area. This parameter is very important for SPAD arrays since, together with the DCR, it is one of the main players in the Signal to Noise Ratio (SNR) of a real measurement. The experimental setup used for the characterization of the detection efficiency is arranged as follows: the light is generated through a mercury-vapor lamp coupled with a monochromator grating (Oriel Spectraluminator 69050), able to generate a single excitation wavelength within 400 and 1000 nm, with a step usually fixed at 50 nm. An integrating sphere is then used to generate two uniform photon fluxes through two distinct output ports: the first one is directed toward the device under test, while the second port is directed toward a calibrated photodiode, whose output is used to calculate the total number of photons impinging on the device under characterization. The measurement is fully automated and controlled by a purposely developed software. For each wavelength to sweep, the measurement is arranged in two consecutive steps: first a shutter between the monochromator and the sphere is opened and the counts coming from the impinging photons are recorded over a 10-s time window thanks to the on-board FPGA counters and the USB link. Then the shutter is closed and the counting measurement is repeated with no light impinging on the device, hence recording the dark count rate. The final value for the PDE is calculated as follows:
| (1) |
where nph is the photon rate impinging on the device, whilst and are the count rates measured by the device with the shutter open and closed. Usually the intensity nph can be tuned acting on two different parameters: the distance between the integrating sphere and the detector and the attenuation factor that can be introduced on the impinging flux using a neutral density filter. This rate is usually chosen higher than the DCR, to attain a high SNR in a limited amount of time, but considerably lower than the maximum count rate for the detector, to avoid a significant distortion due to the dead time Tdead. Actually, and are always obtained from the measured values nopen and nclosed, by compensating the effect of the dead time with the following formula:10
| (2) |
Fig. 4a reports the PDE, averaged over all the pixels of the array, as a function of the wavelength. Measurements have been performed at room temperature and for three different values of the overvoltage Vov = 4 V, 6 V and 8 V. To show the uniformity of the array, in Fig. 4b we reported also the PDE for each pixel. Measurements have been taken at room temperature, Vov = 6 V and at the wavelengths λ = 550 nm, 700 nm and 850 nm. The peak of the PDE curve is at about 550 nm, with a remarkable value of 49% for an excess bias of 6 V. No substantial dependency of the PDE has been registered changing the operating temperature.
Figure 4.
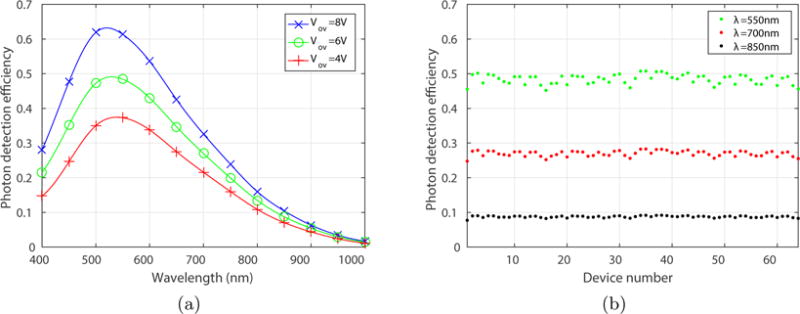
(a) Plot of the PDE versus the wavelength, at room temperature and for three different overvoltages Vov. Data were averaged over all the 64 pixels. (b) Plot of the PDE versus the detector number, at room temperature and for three different wavelengths λ. The overvoltage was set to Vov = 6 V.
3.3 Linearity
Using a slightly modified version of the setup already described for the PDE measurement, it was also possible to measure the linearity curve of the module. This curve represents the number of photons detected by the module as a function of the impinging flux. As already mentioned, the photon flux can be varied by acting on the neutral density filter at the output of the sphere or on the distance between the detector and the sphere itself. Fig. 5 reports the results of the linearity measurement performed with impinging photons having a wavelength of 550 nm. The module operating conditions were set to Vov = 6 V and T = −5 °C. Two different curves are presented for the SPAD having the lowest DCR. With red circles it is possible to see the actual result of the measurement, while the green dashed plot is the corresponding theoretical curve coming from Eq. 1 and Eq. 2, namely:
| (3) |
This diagram shows that the single pixel can work in three different regimes: when the photon flux is very low, the counting rate is dominated by the DCR, resulting in a flat dependency on the impinging flux. For intermediate rates this dependency becomes linear, with a slope equal to the PDE for the used wavelength. When the detection rate becomes comparable with the inverse of the dead time, the detected photon rate assumes a sub-linear dependence on the impinging photon flux, due to the presence of a dead time that is not zero. Eventually, the count rate saturates at the value given by the inverse of the dead time, as expected for a non-paralyzable module.10 An almost perfect agreement has been found between experimental and theoretical data, proving that the module does not introduce additional distortion beside those due to dark counts and dead time. Fig. 5 reports also the experimental (blue crosses) and the calculated (black dash-dot) linearity curves for the whole array, obtained by summing up the counts acquired by each pixel and plotting them versus the total photon flux impinging on the SPAD active areas. This results in a global saturated count rate of 2 Gcount/s (1 Gcount/s considering a maximum tolerable linearity error of 6 dB), proving that the module can be used also in the combined-pixel mode with no additional distortion. As already mentioned this mode is particularly suitable for applications demanding for high dynamic range: the measured value for the module is a remarkable 141.3 dB. It is worth mentioning that so far a negligible dead space has been assumed for the array: unfortunately this is not true and fill factor losses are present if the light is spread all over the chip. In practice, this issue can be solved or strongly mitigated by coupling the detector with a microlens array that focuses the incoming light into the SPAD active areas.
Figure 5.
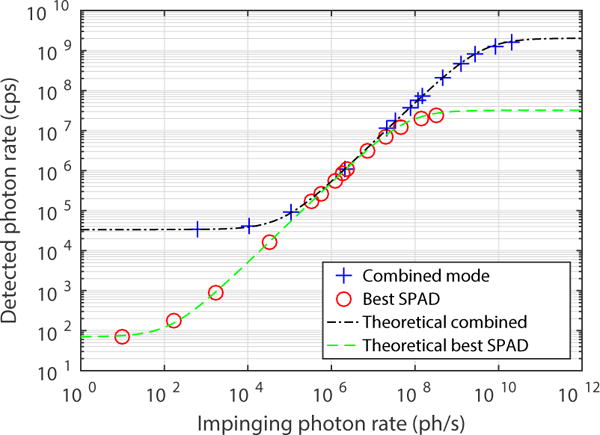
Linearity curve for the pixel with the best noise performance and for the combined-pixel mode. Temperature is −5 °C and the overvoltage 6 V.
3.4 Afterpulsing
The afterpulsing phenomenon is another important source of noise in SPADs. Given a count, the afterpulsing probability is defined as the probability to have another count in the same pixel, that is correlated to the former one. This is due to the trapping of free carriers during the avalanche, that are released when the SPAD has been already reset and it is ready to detect another photon. In order to measure the afterpulsing probability of a single SPAD, the corresponding pin of the VHDCI output has been connected to a portable FPGA-based counter, able to register the arrival time of each event with a 10-ns resolution, realizing a so-called timestamping measurement. The characterization has been carried out for an excess bias of 6 V and a temperature of −5 °C, illuminating uniformly the array with a LED in order to speed up the collection of a sufficient number of events. After that, the data have been post-processed using a MATLAB software, in order to calculate the temporal AutoCorrelation Function (ACF), namely the count rate, registered after a time delay τ from each count. Assuming a negligible afterpulsing probability, the expected ACF should be flat and equal to the average count rate of the device, determined by the impinging photon rate plus the DCR. However what is usually observed in SPADs is a peak in the ACF at low time shifts, due to afterpulses, that recovers at higher time delays and approaches the average count rate due only to uncorrelated events. The ACF has been calculated for some of the channels of the detection module. Fig. 6a reports for example the results obtained on channel 6. In addition also the corresponding afterpulsing probability density has been reported (Fig. 6b), obtained from the ACF just subtracting the asymptotic value at high time delays. Integrating the latter it is possible to calculate the total afterpulsing probability: the result was around 1% for the majority of the devices and in any case below 4%. The measurements have been also validated using the Time-Correlated Carrier Counting (TCCC) technique already described in literature.11
Figure 6.
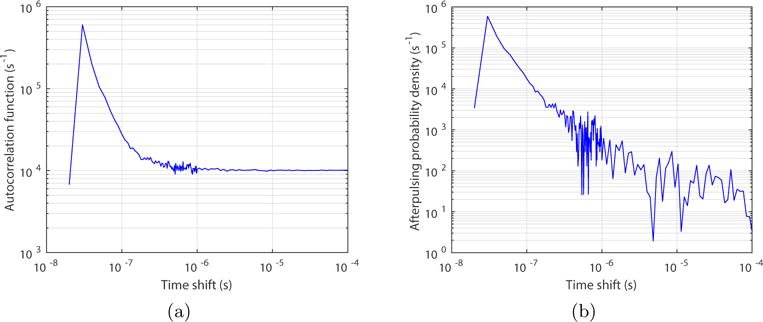
(a) Example of ACF, calculated after the timestamping measurement done on channel 6. (b) Corresponding afterpulsing probability density, calculated from the ACF subtracting the average count rate due to uncorrelated events.
3.5 Optical crosstalk
A third source of noise in SPAD arrays is the optical crosstalk between different pixels. This is due to the photons emitted during the avalanche by a first SPAD, that can trigger a correlated event in a nearby SPAD. In order to measure the optical crosstalk probability between two pixels, the two corresponding outputs coming from the VHDCI connector have been attached to the start and stop inputs of a Time-Correlated Single-Photon Counting (TCSPC) system. A suitable passive delay has been added in the stop signal path in order to shift simultaneous events around the center of the conversion range. Operating the array in dark condition, with no optical crosstalk, we would expect a flat TCSPC histogram, as the dark count events in two pixels are uncorrelated. However, optical crosstalk introduces an additional contribution distributed in time as the current flowing through the emitting SPAD. Calculating the area subtended by this additional contribution and normalizing it to the total number of valid start pulses, we obtain the optical crosstalk probability. Fig. 7 shows the results of the optical crosstalk characterization of the module. The SPAD connected to the start input of the TCSPC system has been kept constant, evaluating the crosstalk probability for different SPADs on the stop input, at different distances. Room temperature and the usual 6-V excess bias have been chosen for this measurement. Results are again consistent with the ones already reported in literature:12 the crosstalk between first neighbors pixels (250 μm spacing) is 2.5% and becomes negligible as the distance increases.
Figure 7.
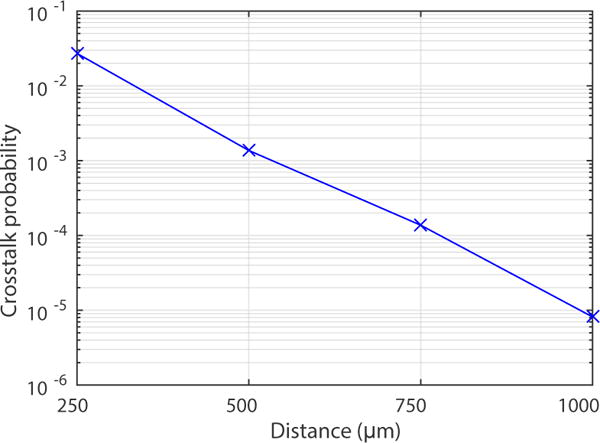
Optical crosstalk probability measured for pixels at different distance. Devices were uncooled and biased 6 V above the breakdown voltage.
4. COMPARISON WITH THE STATE OF THE ART
A comparison with other high count rate devices is suggested in Tab. 1. In the first part of the table the performance of our best pixel is compared with the performance of other high count rate single detectors; both research and commercial solutions have been considered. The second part shows instead the performance of the combined-pixel mode compared to other solutions based on detector arrays. In event-driven architectures13 the temporal and spatial information on the photon arrival is preserved, paying the price of an additional dead time introduced by the sharing of the readout circuitry between all the pixels belonging to the same column. On the contrary, no additional distortion is introduced in the combined-pixel mode that was presented, thanks again to the fully parallel architecture that was designed. Other solutions can attain gigacount rates,14,15 but these can only provide the counts integrated in time windows, losing the information on the arrival time of every single photon.
Table 1.
Comparison among the two operating modes of the presented module and other photon detection solutions.
| Detector | Dimension (μm)
|
Array size | Single-pixel PDE (%)
|
DCR (cps) | Max count rate (Mcps) | Dynamic range (dB)a | |||
|---|---|---|---|---|---|---|---|---|---|
| Diameter | Pitch | 400 nm | 550 nm | 800 nm | |||||
|
| |||||||||
| MPD16 | 50 | 1 | 24 | 49 | 15 | 95b | 12 | 121.8 | |
| Excelitas17 | 180 | 1 | 9 | 55 | 62 | 25b | 40 | 138.1 | |
| 0.35-μm CMOS18 | 20 | 1 | 50 | 34 | 5 | 25 | 50 | 140 | |
| 0.13-μm CMOS19 | 8 | 1 | 410 | 185 | 139.2 | ||||
| Best SPAD | 50 | 1 | 22 | 49 | 13 | 72b | 33 | 131.8 | |
|
| |||||||||
| Event-driven13 | 8 | 45 | 64×48 | 12 | 20 | 4 | 1136640 | 80 | 97.5 |
| SiPM7 | 14c | 25 | 40×40 | 75 | 55 | 16 | 270000 | 1000 | 125.7 |
| Combined mode | 50 | 250 | 8×8 | 22 | 49 | 13 | 33470b | 2130 | 141.3 |
Dynamic range is expressed as 20 log DR.
Thermoelectrically cooled.
Square side length.
5. CONCLUSIONS
In this paper a new photon detection module, based on an array of 8 × 8 SPAD, has been presented. Two different operating modes have been suggested for this module: the first, suitable for multi-spot acquisition, can be used to measure the intensity of light coming from independent sources, fully exploiting the noise performance of the single pixel. The second, indicated as combined-pixel mode, allows measurements at very high count rates, given a single photon-source that is spread all over the array. In addition this last configuration has also other advantages, like an extended dynamic range and the capability to resolve the number of photons that are impinging on the detector at the same time, thanks to a fully independent system architecture. In the end also a final comparison has been reported, keeping in account other high count rate solutions already present in literature or commercially available.
Acknowledgments
This work was supported by the National Institute of General Medical Sciences of the National Institutes of Health under Awards 5R01 GM095904. The content is solely the responsibility of the authors and does not necessarily represent the official views of the National Institutes of Health. The authors wish to acknowledge P. Maccagnani (IMM-CNR sez. Bologna) for the SPAD fabrication. No resources or personnel from MPD were involved in this work.
Footnotes
Conflict of interest statement: M. Ghioni discloses equity in Micro Photon Devices S.r.l. (MPD).
References
- 1.Ghioni M, Gulinatti A, Rech I, Zappa F, Cova S. Progress in silicon single-photon avalanche diodes. IEEE Journal of Selected Topics in Quantum Electronics. 2007 Jul;13:852–862. [Google Scholar]
- 2.Michalet X, Ingargiola A, Colyer RA, Scalia G, Weiss S, Maccagnani P, Gulinatti A, Rech I, Ghioni M. Silicon photon-counting avalanche diodes for single-molecule fluorescence spectroscopy. IEEE Journal of Selected Topics in Quantum Electronics. 2014 Nov;20:248–267. doi: 10.1109/JSTQE.2014.2341568. [DOI] [PMC free article] [PubMed] [Google Scholar]
- 3.Michalet X, Colyer RA, Scalia G, Ingargiola A, Lin R, Millaud JE, Weiss S, Siegmund OHW, Tremsin AS, Vallerga JV, Cheng A, Levi M, Aharoni D, Arisaka K, Villa F, Guerrieri F, Panzeri F, Rech I, Gulinatti A, Zappa F, Ghioni M, Cova S. Development of new photon-counting detectors for single-molecule fluorescence microscopy. Philosophical Transactions of the Royal Society of London B: Biological Sciences. 2012 Dec;368:1–22. doi: 10.1098/rstb.2012.0035. [DOI] [PMC free article] [PubMed] [Google Scholar]
- 4.Naletto G, Barbieri C, Occhipinti T, Capraro I, Paola AD, Facchinetti C, Verroi E, Zoccarato P, Anzolin G, Belluso M, Billotta S, Bolli P, Bonanno G, Deppo VD, Fornasier S, Germanà C, Giro E, Marchi S, Messina F, Pernechele C, Tamburini F, Zaccariotto M, Zampieri L. Iqueye, a single photon-counting photometer applied to the ESO new technology telescope. Astronomy and Astrophysics. 2009 Dec;508:531–539. [Google Scholar]
- 5.Collins RJ, Hadfield RH, Fernandez V, Nam SW, Buller GS. Low timing jitter detector for gigahertz quantum key distribution. Electronics Letters. 2007 Feb;43:180–181. [Google Scholar]
- 6.Korneev A, Kouminov P, Matvienko V, Chulkova G, Smirnov K, Voronov B, Gol’tsman GN, Currie M, Lo W, Wilsher K, Zhang J, Slysz W, Pearlman A, Verevkin A, Sobolewski R. Sensitivity and gigahertz counting performance of NbN superconducting single-photon detectors. Applied Physics Letters. 2004 Jun;84:5338. [Google Scholar]
- 7.Akiba M, Inagaki K, Tsujino K. Photon number resolving SiPM detector with 1 GHz count rate. Optics Express. 2012 Jan;20:2779–2788. doi: 10.1364/OE.20.002779. [DOI] [PubMed] [Google Scholar]
- 8.Castelletto SA, Degiovanni IP, Schettini V, Migdall AL. Reduced deadtime and higher rate photon-counting detection using a multiplexed detector array. Journal of Modern Optics. 2007 Jan;54:337–352. [Google Scholar]
- 9.Ceccarelli F, Gulinatti A, Labanca I, Rech I, Ghioni M. Gigacount/second photon detection module based on an 8×8 single-photon avalanche diode array. IEEE Photonics Technology Letters. 2016 May;28:1002–1005. doi: 10.1109/LPT.2016.2522974. [DOI] [PMC free article] [PubMed] [Google Scholar]
- 10.Becker W. Advanced Time-Correlated Single Photon Counting Techniques. Springer-Verlag; New York: 2005. [Google Scholar]
- 11.Giudice AC, Ghioni M, Cova S, Zappa F. A process and deep level evaluation tool: afterpulsing in avalanche junctions. Proceedings of ESSDERC 2003, 33th European Solid-State Device Research Conference. 2003 Sep;:347–350. [Google Scholar]
- 12.Cuccato A, Antonioli S, Crotti M, Labanca I, Gulinatti A, Rech I, Ghioni M. Complete and compact 32-channel system for time-correlated single-photon counting measurements. IEEE Photonics Journal. 2013 Oct;5:1–14. [Google Scholar]
- 13.Niclass C, Sergio M, Charbon E. A CMOS 64×48 single photon avalanche diode array with event-driven readout. Proceedings of ESSCIRC 2006, 32th European Solid-State Circuits Conference. 2006 Sep;:556–559. [Google Scholar]
- 14.Bronzi D, Villa F, Tisa S, Tosi A, Zappa F, Durini D, Weyers S, Brockherde W. 100 000 frames/s 48 × 32 single-photon detector array for 2-D imaging and 3-D ranging. IEEE Journal of Selected Topics in Quantum Electronics. 2014 Nov;20:354–363. [Google Scholar]
- 15.Stoppa D, Borghetti F, Richardson J, Walker R, Grant L, Henderson RK, Gersbach M, Charbon E. A 32×32-pixel array with in-pixel photon counting and arrival time measurement in the analog domain. Proceedings of ESSCIRC 2009, 35th European Solid-State Circuits Conference. 2009 Sep;:204–207. [Google Scholar]
- 16.Micro Photon Devices PDM series datasheet. 2013 [Google Scholar]
- 17.Excelitas SPCM-AQRH series datasheet. 2014 [Google Scholar]
- 18.Bronzi D, Tisa S, Villa F, Bellisai S, Tosi A, Zappa F. Fast sensing and quenching of CMOS SPADs for minimal afterpulsing effects. IEEE Photonics Technology Letters. 2013 Apr;25:776–779. [Google Scholar]
- 19.Eisele A, Henderson R, Schmidtke B, Funk T, Grant L, Richardson J, Freude W. 185 MHz count rate, 139 dB dynamic range single-photon avalanche diode with active quenching circuit in 130 nm CMOS technology. Proceedings of IISW 2011, International Image Sensor Workshop. 2011 Jun;:278–280. [Google Scholar]