Abstract
We propose a mechanism of adherent cell mechanosensing, based on the idea that the contractile actomyosin machinery behaves as a catch bond. For this, we construct a simplified model of the actomyosin structure that constitutes the building block of stress fibers and express the stability of cross bridges in terms of the force-dependent bonding energy of the actomyosin bond. Consistent with experimental measurements, we then consider that the energy barrier of the actomyosin bond increases for tension and show that this response is enough to explain the force-induced stabilization of a stress fiber. Further numerical simulations at the cellular level show that the catch-bond hypothesis can help in understanding and predict the sensitivity of adherent cells to substrate stiffness.
The contraction of adherent cells is a phenomenon that plays a large role in many biological processes such as morphogenesis [1], wound contraction [2], stem cell differentiation [3], and the development of many diseases [4]. The molecular mechanisms by which cells generate motion and force depend on a series of highly coordinated events occurring in both the cytoskeleton and at the cell membrane. Of particular importance are the contractile elements of the cytoskeleton, made of stress fibers (SF) [5,6]. These filaments, that assemble from proteins present in the cytosol (including mainly globular actin and myosin), generally anchor to the cell substrate via focal adhesions and can ultimately span the entire length of the cell. Importantly, these filaments are capable of sustaining appreciable levels of contraction, which they owe to the underlying actomyosin machinery powered by adenosine triphosphate (ATP). In the past decade, a number of studies have shown that both SF density and contraction in adherent cells were sensitive to the mechanical environment [3,7,8]; a stiffer environment generally promotes a denser, stronger cytoskeleton and eventually cell spreading [9]. Understanding the fundamental origin of these behaviors has motivated a number of theoretical studies, from the cellular to the molecular level. A line of thought has been to view cells as contraction dipoles [10] that could sense the compliance of their substrate and accordingly polarize by minimizing their deformation energy [11]. Others have considered the contractile cytoskeleton as an active material in which filament stability is promoted by tension [12–14]. The molecular origin of this phenomenon was explained by the presence of signaling pathways that induced a positive feedback for SF stabilization with force [15]. Other classes of models, based on cross-bridge dynamics [16], have also been used to explain the effect of tension on cytoskeleton reorganization under static and cyclic conditions [17]. A more thorough review of existing models was discussed in [18]. While biochemical signaling has often been argued as a possible factor, the way by which SFs stabilize with tension still remains an open question. In this paper, we invoke a well-known mechanosensitive element used by biology, the catch bond, to explain both the force-stabilization response of SFs and the development of intricate cytoskeletal architectures in adherent cells. Such bonds are typically found on the membrane of leucocytes and bacteria [19] and act to strengthen the adhesion with a solid substrate in the presence of an external force. They may also play the role of rigidity sensors on the surface of adherent cells, through specific membrane receptors and notably the α5β1 integrin [20]. Contrary to the conventional slip bonds whose detachment rate increases with force as described by Bell’s law [21], catch bonds are able to extend their lifetime under the application of a small to moderate force. While the origin of this behavior may be complex at the molecular scale (arising from mechanochemical interactions or multiple force-dependent bond states for instance [22,23]), the overall response of catch bonds is quite robust across biological systems. Of particular interest in the case of SFs is the finding, notably by Guo et al. [24], that the actin-myosin complex does display a catch-bond behavior, with a maximum stabilizing force around 6 pN. This observation is further confirmed by Capitanio et al. [25] who measured a force-induced reduction in the detachment rate of myosin from actin after its working stroke for forces ranging between 0 and 6 pN at high ATP concentration and Reconditi et al. [26] who found similar trends in the mechanics of muscle fibers. Alternatively, there may be other types of mechanosensitive mechanisms in the SF machinery, which could include, for instance, a force-dependent transition among the different nucleotide states of myosin during its mechanochemical cycle on actin. These considerations, along with the data from Guo et al. [24], clearly indicate the possibility of catch bond within SFs. To investigate this hypothesis, we propose to explore whether the existence of a catchy actomyosin bond could be at the origin of (a) the force and stiffness-induced SF stabilization and (b) the complex actomyosin cytoskeleton architecture observed in a majority of adherent cells. For this, we proceed in two steps; first, we introduce an active viscoelastic model of SF that incorporates the idea of force-induced stabilization of cross bridges. Second, we propose a simple model of the actomyosin cytoskeleton of adherent cells, made of a random assembly of force-sensitive SFs. A computational procedure is introduced to predict the contractile behavior and cytoskeleton architecture of adherent cells laying on beds of microposts. Results are discussed in the light of experimental data from the literature.
I. MODELING STRESS FIBERS AS ACTIVE VISCOELASTIC FILAMENTS
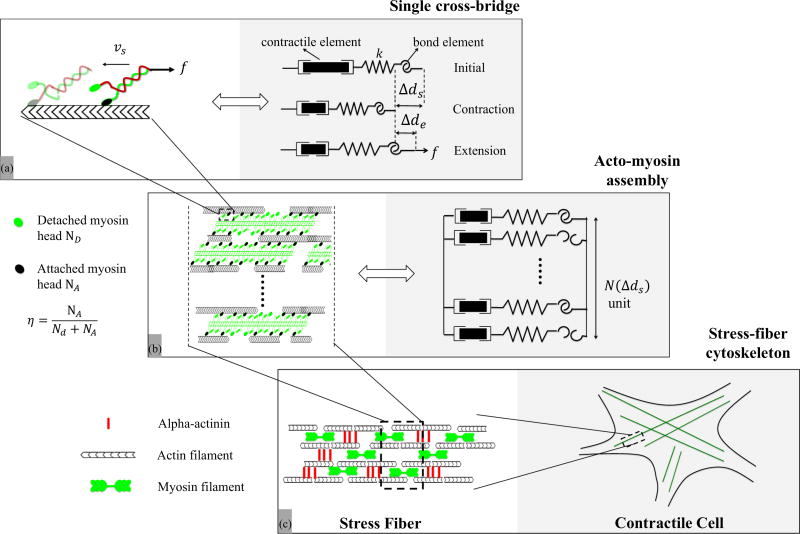
As shown in Fig. 1, SFs are generally viewed as bundles of polar actin filaments which, depending on maturity, can display a periodic appearance associated with the presence of organized repeating structure of myosin and alpha-actinin molecules [27]. Myosin filaments possess proteins domains, or heads, that have the ability to execute power strokes towards the positive end of an actin filament. This operation, collectively, results in an overall shortening of the actomyosin assembly at a speed that can vary depending on the type of myosin (see discussion in Appendix A3 and Table I). Based on these observations, we propose to model a SF control segment as a parallel assembly of three key elements (Fig. 1): (a) a contractile element that captures the change Δds in SF length due to the sliding of myosin heads on actin filaments at a rate Δḋs = υs (here υs is negative), (b) an elastic element of stiffness k [24,32] characterizing the elasticity of cross bridges and whose stretch Δde is recoverable upon unloading, and (c) a bond element that represents the strength of the actin-myosin complex. Note that, initially, the segment is in an optimal configuration, i.e., active actin sites and myosin cross bridges perfectly overlap and a deviation from this length is given by Δd = Δds + Δde. Now, assuming that the overlap ratio decreases linearly with sliding Δds, the maximum number of cross bridges that can be formed during contraction is estimated as
| (1) |
where Nf is the number of myosin minifilaments in the control segment while Nx is the number of myosin heads per myosin filament. In this work, we choose [34] as the distance at which the actin-myosin filaments generally cease to overlap. This relationship is at the origin of the length-tension relation in muscle mechanics [35].
FIG. 1.
Overview of the contractile machinery of adherent cells from the molecular to the micron scale. (a) At the molecular scale, the dynamics of contraction starts from the motion of myosin motors that can attach to actin filaments and walk along them via coordinated configurational changes of the myosin head powered by ATP. The stability of these cross bridges is affected by the applied load f. In this study, this unit is modeled by a series of three elements comprised of a contractile element (whose contraction rate is υs), a compliant element of stiffness k, that captures the elasticity of the cross bridge and an “adhesive” element that represents the bond between actin and myosin. (b) A SF segment is primarily made of aligned and polarized actin filaments cross linked by a series of thick actin myofilaments whose motion along the actin tracks is facilitated by the motion of cross bridges. The overall SF contraction strain and force depend on the force generated by each individual myosin head and the number of attached actomyosin bonds, whose fraction is represented by the variable η. This organization can be represented by a parallel assembly of single cross-bridge elements shown in (a) which may be in an attached and detached state. (c) Assembled in series, these segments make up SFs which constitute the main contractile element of adherent cells. SFs typically organize into a well aligned network whose elements can span a cell between two adhesion points. υs is the sliding velocity, f is the external force against contraction, k is the actomyosin bond stiffness, Δds is the contraction, Δde is the elastic stretch of the bond, η is the ratio of the number of attached cross bridges to that of total available cross bridges N(Δds) at contraction Δds.
TABLE I.
Parameters for the SF model.
| Parameter | Meaning | Value |
|---|---|---|
| Δx | Width of the energy barrier | 3 nm [28] |
| f0 | Normalizing force | 2.2 pN |
| E0 | Reference energy of catch bond | 1.98−19 J |
| α | Bond catchiness | 2.4 kBT |
| Nx | Number of myosin heads per filament | 20 [17] |
| Nf | Number of myosin filament per bundle | 10 [29,30] |
| l | Length of the control segment | 1 µm [29,30] |
| T | Absolute temperature | 300 K |
| ζ | Stall force | 5 pN [31] |
| k | Actomyosin bond elasticity | 600 pN/µm [32,33] |
| υ | Maximum contraction velocity of SF | 1 µm/s [34] |
A. Active viscoelastic model
The dynamics and force generation in actomyosin units have traditionally been studied using the sliding filament theory [16,36,37]. Based on the detailed kinetics and transition between different states of myosin motors during their working cycle, the theory enables the determination of the fraction of attached cross bridges on an actin filament as well as their velocity and working force in terms of external conditions. Although such an approach would provide a good starting point to our derivation, its level of details may divert us from our main objective, i.e., understand the role of actomyosin catch bond on cell mechanosensitivity. We therefore keep this alternative for future work and instead propose a simplified approach which consists of investigating the equilibrium of a SF segment by considering the balance of entropy, conservative and nonconservative forces within the actomyosin assembly as it is subjected to an external force Fe. To describe the former two contributions, we build a Gibbs free energy functional in the form G = U − T S where U, S, and T are the stored internal energy, entropy, and thermodynamic temperature in the control segment, respectively. To evaluate S, we first investigate the number of possible bond configurations in the attached (A) and detached (D) state among the available actomyosin bonds. If we define 0 ≤ η ≤ 1 as the ratio NA/N of attached bonds (NA being the number of attached bonds), the entropy of the system reads as S = −kBN(Δds)[η ln(η) + (1 − η) ln(1 − η)] where kB is the Boltzmann constant. The internal energy of the unit is then composed of two terms: the stored elastic energy and the adhesion energy Eb stored in attached bonds. This yields . The total Gibbs energy functional can then be written
| (2) |
The Rayleigh dissipation potential can similarly be written in term of the sliding velocity υs and the external force Fe as
| (3) |
The term Nημ is to be interpreted as the overall viscosity between actin and myosin filaments while μ is the viscosity arising from a single cross bridge. The latter can be considered as a lumped representation of a number of physical phenomena occurring during the working stroke of a myosin head, i.e., size and rate of the motor swing as well as how the rates of attachment and detachment of the myosin head on actin depend on force [38,39]. The consideration of each individual mechanism, which is beyond the scope of this work, would therefore likely yield a nonlinear viscosity that depends on force in a more complex fashion than presented here. Nevertheless, the presented model, as it captures the main trends exhibited by the above phenomena, is sufficient for the present analysis. Finally, one now should specify the energy provided to the system by ATP hydrolysis in order to power the sliding of myosin heads on actin filaments. For this, we introduce the active force ζ produced by a single myosin molecule and compute the power produced in the control segment as
| (4) |
It is clear here that the term ζ is what drives the contractility of the actomyosin unit and may be linked to the difference in chemical potential between ATP and its reaction products as discussed in [40]. The governing equation of our active actomyosin filaments may then be obtained by balancing dissipation, energy release rate, and active work. For this it is convenient to work with the functional
whose minimization δℱ[η̇, υe, υs] = 0 leads to the equation
Enforcing the fact that the variations of η̇, υe, and υs are independent δυeℱ, δη̇ℱ, and δυsℱ must all vanish, one can obtain the three Euler-Lagrange governing equations
| (5) |
| (6) |
| (7) |
The first equation is interpreted as the mechanical equilibrium of the control segment, while the second denotes its chemical equilibrium (equality of the chemical potentials) of bonds in their attached and detached states. The last equation finally describes how the cross-bridge velocity is affected by the balance between the active force ζ and passive force f = kΔde. Interestingly, if one defines the natural (or maximal) sliding velocity as , Eq. (7) can be rewritten
| (8) |
In the range 0 < f < ζ, this relation may therefore be thought of as a simplified (bilinear) form of the velocity-tension relationship [41] that describes how the sliding velocity decreases if an opposing force f is applied to the actomyosin unit. This expression is consistent with recent findings [25,26] that the myosin stroke size (and hence its velocity) decreases with applied load. In this context, ζ can be interpreted as a stall force, i.e., the force that must be applied to a single cross bridge to stop its motion. Experimental approaches have estimated its value to be around 5 pN [31] in algal cells.
B. Actomyosin catch bonds
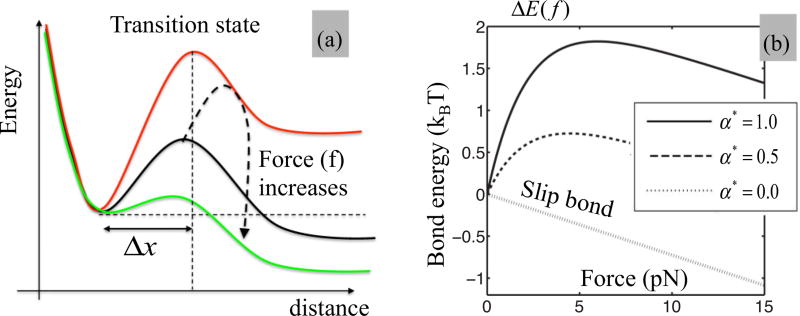
To complete the model, we now need to express the fact that the actin-myosin complex displays a catch-bond behavior. For this, consider the energy landscape of a single bond as depicted in Fig. 2(a), in which ΔE is the energy barrier separating the bound and unbound states. Typically, the larger the energy barrier, the longer a bond can live under thermal fluctuations. When subjected to a tensile force f, the energy barrier of a conventional “slip bond” typically decreases according to Bell’s law [21] as where is the reference energy of the bond and Δx ≈ 3 nm [28] is the width of the barrier. As shown in the literature [24,25], actomyosin complexes are temporarily stabilized when moderate pulling forces are applied, a response that can be interpreted as a temporary increase in the energy barrier ΔEd with forces. Although a number of functions can be chosen to satisfy that criterion, we choose here the following two-parameter function originally proposed by Pereverzev and Prezhdo [42] as
| (9) |
where α measures the “catchiness” of the bond and f0 is used to scale the force at which the bond stabilizes [Fig. 2(b)]. We note that when α = 0, the above expression degenerates to that of a slip bond following Bell’s law. In this study, we choose E0 = 4.8kBT, f0 = 2.2 pN and explore a range of bond catchiness between 0 and αmax = 2.4kBT, in order to match a maximum stabilization at η = 5% [17] for a peak force of 6 pN [24], consistent with the literature. A single value of bond stiffness k was further chosen, corresponding to nonmuscle myosin (NMM) and smooth muscle myosin (Table I). For this parameter, values reported in the literature are limited and very scattered, which motivated the discussion and parametric study provided in Appendix A4. Overall, we show that the magnitude of k does affect the kinetics and forces generated by SF, but does not affect the main trends of its response discussed in the remainder of this paper. Using the expression for Eb in Eq. (6), one finds that the level η of cross-bridge attachment obeys
| (10) |
FIG. 2.
(a) Energy landscape of the actomyosin bond in the direction of applied force. The bond needs to go over the energy barrier (or transition state) in order to switch from its bound to unbound state. For a catch bond, the height of the energy barrier increases with moderate force until it starts decreasing for larger magnitude. This ultimately yields a force-induced stabilization of the bond. (b) Relationship between the height ΔEb of the energy barrier and applied force as predicted by the Pereverzev and Prezhdo model [42] used in this study, for different values of bond catchiness α⋆. The case α⋆ = 0 corresponds to a slip bond response.
C. Stress fiber mechanosensitivity
Let us now assess the consequence of this model on the mechanosensitivity of a SF control segment subjected to a constant external force F by investigating its stabilization via the fraction of attached bonds η. For clarity, we assume here that the SF does not contract during the application of the force (i.e., υs = 0). In this case, η is directly calculated from (10) as
| (11) |
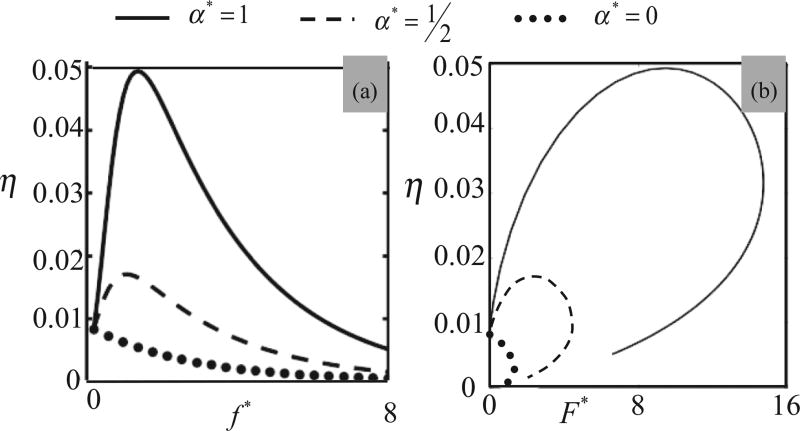
where the force in an attached actomyosin bond is obtained from (5) as f = F/[ηN(Δds)]. This enables us to explore the force-induced activation of the SF as a function of bond catchiness α⋆ = α/αmax. Figure 3 therefore illustrates, for different values of bond catchiness α, how the variable η is affected by (a) the force f on a single actomyosin bond and (b) the total force F = ηNf on the actomyosin assembly. Figure 3(a) shows that for a slip bond (α⋆ = 0), the steady state fraction η monotonically decreases with force as predicted by Bell’s law while as α⋆ approaches unity, the fraction of attached bond becomes close to its maximum (≈5%) for a critical force determined by . We also observe a clear difference between the stability-force behavior for a single bond and the full segment as shown in Fig. 3(b). Multiple bonds exhibit a cooperative behavior since for a given macroscopic force F, the force in individual bonds increases with decreasing η. As a result, we still see the force-induced stabilization under the critical force Fc = Nη(fc)fc for α > 0 but a catastrophic disassembly occurs for a larger force. Passed its maximum value Fc, the resisting force F therefore decreases quickly as cross bridges become unstable and detach, a behavior is reminiscent of the fracture behavior of a fiber bundle, showing catastrophic disassembly at critical force [43].
FIG. 3.
Effect of (a) local (on a single cross bridge) and (b) global (on the full SF segment) force on the fraction η of bound actomyosin bonds in the SF segment in the absence of cell contraction (υs = 0). Predictions are shown in the case of an actomyosin slip bond α* = 0, moderate catch bond α* = 0.5, and strong catch bond α* = 1. These results clearly show the force-induced stabilization of the cross bridges as the bond catchiness is increased (a). They also show a dramatic disassembly of the actomyosin bundle when the applied force F* reaches its critical value (b). f* = f/ζ and F* = F/ζ.
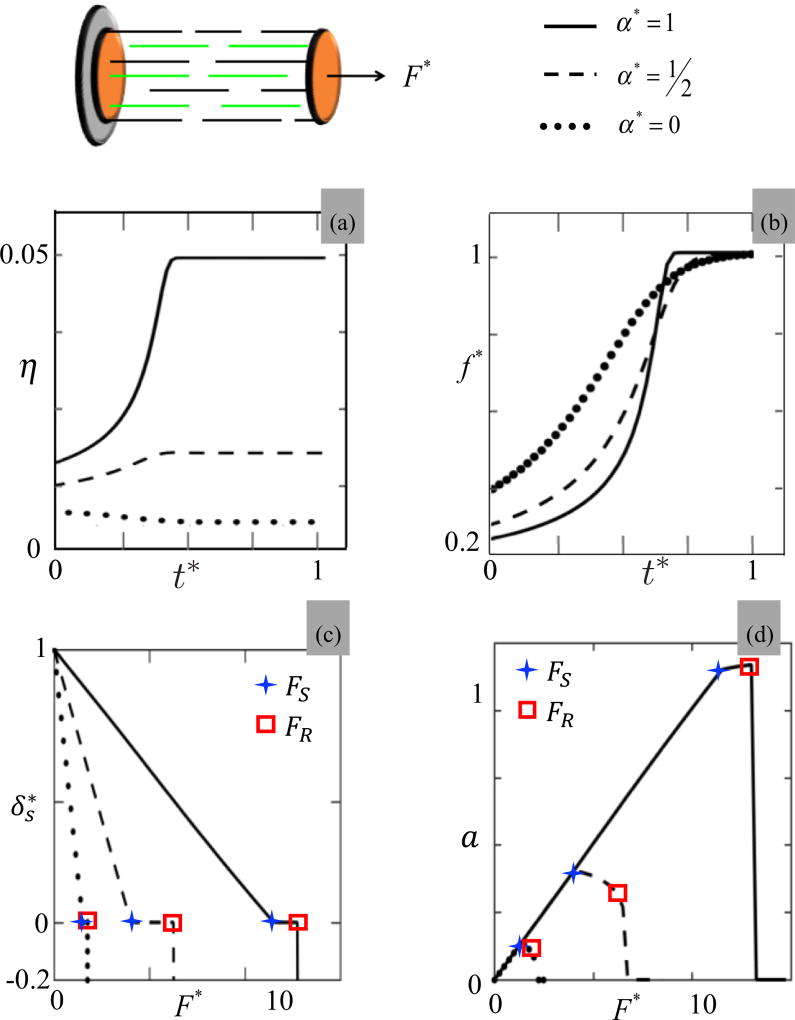
We next explore the behavior of the same SF segment when it is allowed to contract against the load, i.e., cross bridges slide on actin filaments at a velocity given by Eq. (8). In this context, Fig. 4 provides results regarding the time history of the contraction (top panels) and its steady state for different external forces (bottom panels). More specifically, the time response of the SF segment was investigated by plotting the fraction η [Fig. 4(a)] and the normalized actomyosin force f⋆ = f/ζ [Fig. 4(b)] for three values of actomyosin bond catchiness α⋆ = 0, , and 1, respectively. These results show that when the applied force F is moderate (F is smaller than a critical value Fc determined above), bond catchiness promotes actomyosin stability which yields an increase in the fraction of activated cross bridges with α. One also sees that this activation monotonically increases in time as the segment contracts at a rate given by Eq. (8). However, once the force f per each cross bridge reaches its maximum value ζ, contraction ceases and the segment reaches its maximum contraction strain. The latter is sensitive to both applied force and bond catchiness as shown in Fig. 4(c). On this figure, one indeed sees that the normalized segment contraction δ* = Δd/Δdmax decreases with the amount of tension F*. When F* = 0, maximum SF shortening is reached while when the tension reaches its stalling value FS (which corresponds to a cross-bridge force f = ζ), no shortening is observed. One further notices that if the force increases to a critical value FR, the force in each cross bridge reaches its maximum capacity fR (corresponding to the peak force of 6 pN) and the segment ruptures. In this process, we also note that bond catchiness plays a role in stabilizing the segment against external tension as it delays both the stalling and the rupture force significantly. We finally show in Fig. 4(d) the effect of applied force on the overall activation a = η * N(Δds)/(NxNy) of attached cross bridges. Similarly to Fig. 3, in the case of a catch bond, we observe an obvious activation of the number of cross bridges with external force until the force in an actomyosin bond reaches its stalling (and rupture) value. For a slip bond, however, the activation of the SF segment is negligible and quickly reaches its maximum capacity when a force is applied. Overall, these results point out that external tension is key to the activation and stabilization of a SF segment and that this response is strongly dependent on the catchiness of the actomyosin bond.
FIG. 4.
Investigation of a SF segment as it is contracting under a constant load F* = F/ζ for different values of normalized bond catchiness α⋆ = 0,0.5 and 1. Top figures: (a) fraction of attached cross bridge η and (b) force f⋆ = f/ζ on an active cross bridge as a function of time for F* = 1.2. Bottom figures: (c) normalized steady state SF contraction and (d) activation a = η * N(Δds)/(NxNy) of an SF segment as a function of applied force F*. The symbols + and □ indicate the points at which the SF segment stalls and ruptures, respectively.
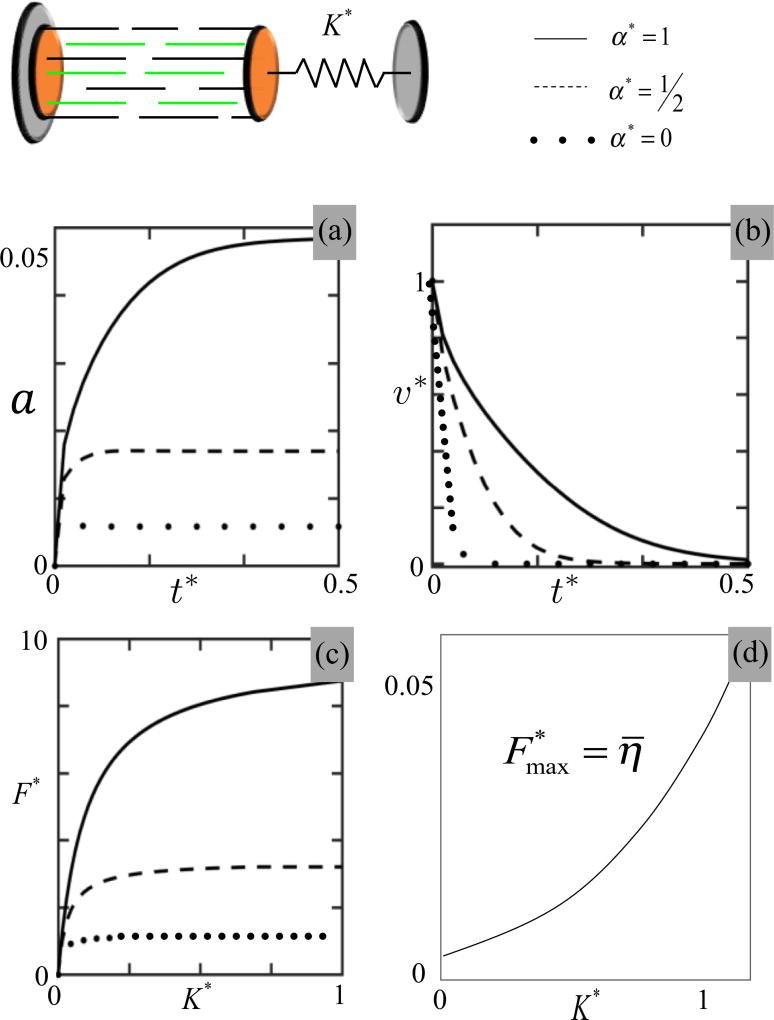
Due to its biological relevance, we now investigate the model’s prediction regarding the stiffness sensing capability of a SF; this can be done by considering a virtual experiment in which the control segment is attached to a rigid support on one end and to a compliant substrate, represented by a linear spring of stiffness K on the other (Fig. 5). Assuming that the spring is in its unstretched configuration when the SF is in its relaxed state (Δd = 0), the external force becomes F = K Δd. In Figs. 5(a) and 5(b), we show the time evolution of the fraction of active cross bridges η and the contraction rate for an external stiffness K = k/2 and explore the effect of the bond catchiness on this process. As observed with the constant force, bond catchiness is a critical parameter for stiffness sensing; when α⋆ = 0, activation is insensitive to stiffness, while for larger values of α⋆, one sees a monotonic increase in SF activation with time, until it reaches a steady state. Interestingly, as bond catchiness increases, the model predicts a slowdown of the contraction dynamics [Fig. 5(b)] as observed in experimental studies of contractile cells (see Fig. 7). This response may be attributed to the fact that a stronger catch bond induces larger forces f in actomyosin bonds, which in turn yield smaller sliding velocities as predicted by Eq. (8). Beyond this dynamic response, external stiffness is also known to strongly influence SF contraction at steady state. In the model, the steady state corresponds to a vanishing sliding velocity υs = 0, which translates, using Eq. (7), to the conditions that the force in actomyosin bonds is f = ζ. This implies, after a simple calculation and assuming that Δds ≫ Δde, that contractile force is related to stiffness K by
| (12) |
where F⋆ = F/(Nζ), K⋆ = K/k, and η̄ = η(f = ζ). A graphical representation of this expression is given in Fig. 5(c) for different values of bond catchiness. This result shows that the SF contraction force increases sharply with external stiffness for small stiffness (F⋆ ≈ K⋆ as K⋆ → 0) and asymptotically reaches the plateau for stiffer environments (when K⋆ ≫ η̄). Since the value of η̄ strongly depends on α⋆, results show that stiffness sensitivity of the SF is highly dependent on bond catchiness: when α decreases, η̄ diminishes until it reaches an irrealistically low activation value (η̄ < 0.05%) when α⋆ = 0 [Fig. 5(d)]. The model therefore suggests that the catch-bond behavior is critical for stiffness sensing.
FIG. 5.
Investigation of a SF segment as it is contracting against a spring of normalized stiffness K* = K/k for different values of normalized bond catchiness (α⋆ = 0, 0.5, and 1). Top figures: time evolution of (a) η and (b) shortening velocity for a spring stiffness K* = K/k = 0.5. Bottom figures: (c) Relationship between the external stiffness K* = K/k and the contractile force F⋆ = F/ζ applied by the control segment at steady state for different values of bond catchiness α⋆. The relationship between maximum contractile force and bond catchiness is shown in (d).
FIG. 7.
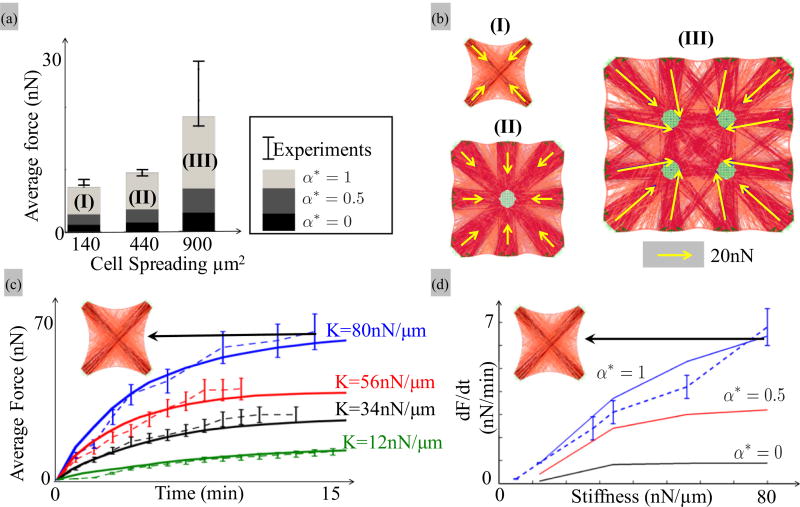
(a), (b) Effect of cell area on contractility. (a) Predicted SF distribution for smooth muscle cells (BPASMC) lying an a micropillar substrate consisting of 4, 9, and 16 pillars, respectively, all assuming α* = 1. With a fixed pillar radius and spacing of 1.5 and 6 µm, the cell spreading areas are respectively 140, 440, and 900 µm2, consistent with experimental conditions presented in the work of Tan et al. The density of anchoring sites for SFs used to match experimental results are respectively 7 per µm2 on the pillar surfaces and 6 per µm on the cortex. The micropost bending sitiffness is 32 nN/µm [44]. (b) The average force per pillar was computed for the three cell sizes under the hypothesis of an actomyosin slip bond (α* = 0), moderate catch bond (α* = 0.5), and strong catch bond (α* = 1). The predicted values are compared with experimental results represented by vertical bars (whose positions and lengths depict the mean and standard deviations of the measurements [44]). (c), (d) Dynamics of fibroblast contraction as a function of substrate stiffness. (c) The evolution of contraction with force was investigated with a square cell lying on four pillars, for which the effective stiffness K = 3EpIp/h3 [Eq. (14)] was varied between 12 and 80 nN/µm. For these simulations, the density of SF anchoring sites was chosen to be 9 per µm2 on the pillar surface and 12 per µm on the cortex. The curves show the evolution of the contractile force per pillar in time as predicted by the model for α⋆ = 1 (solid lines) and measured experimentally for the fibroblast cells (REF52) investigated in Trichet et al. [46]). (d) Role of bond catchiness on the rate of cell contraction at early times (t = 0) as a function of micropost stiffness (K is comprised between 0 and 80 nN/µm). The dashed line and vertical bars (mean and standard deviations) are experimental data taken from the study of Trichet et al. [46]. The density of SF anchoring sites were chosen as 10 per µm2 on pillars and 12 per µm on the cortex, respectively, while the micropost radius and spacing are 1.5 and 6 µm, respectively.
II. FROM STRESS FIBER TO CYTOSKELETON
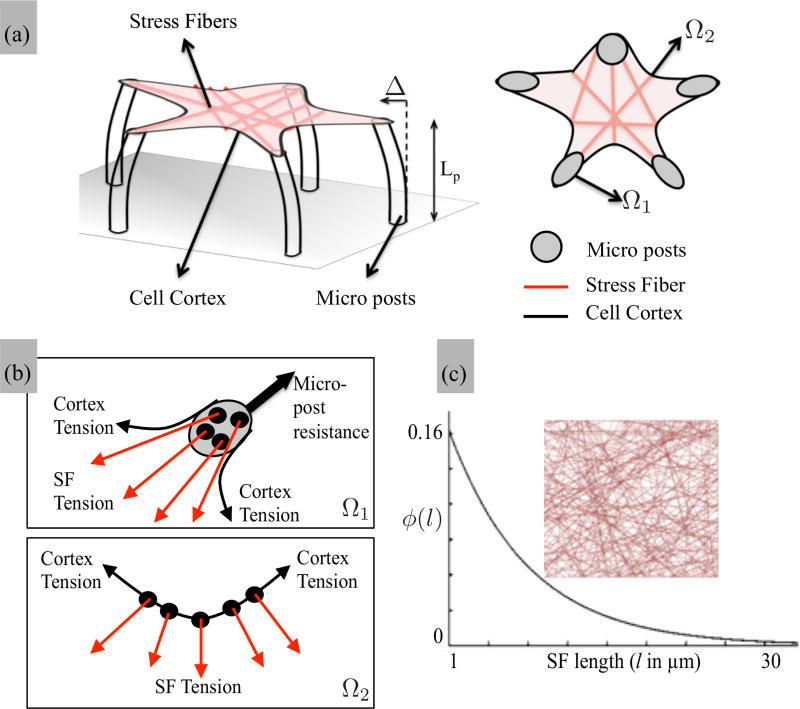
In the remainder of this work, we scale up the SF model to the cellular level in order to investigate the effect of the catch-bond hypothesis on the mechanosensitivity of cells lying on micropillars as measured in a number of experimental studies [44–46]. For this, we take Nf = 20, Nx = 10 in Eq. (1) and assume that the cytoskeleton of an adherent cell initially consists of randomly distributed network of SFs that can anchor at focal adhesion sites, with densities that range between 5 and 15 SF per µm2 [44,46] or at the cell periphery (the actin cortex) with a density that ranges between 5 and 15 per µm [47] (Fig. 6). Although distributed in an isotropic fashion, the length ℓ of each SF is taken to follow an exponential probability distribution given by [Fig. 6(c)]
| (13) |
where λ = 0.2 µm is known as the rate parameter. We note that this distribution indicates that small SFs can assemble and grow more easily than longer ones, and are thus more likely to be found in the network [48]. Within this structure, the response of SFs follow Eqs. (5)–(7) with the difference that the elastic shortening de and the sliding velocity υs are scaled with the length of each individual SF. The other two important elements of the model are the actin cortex, modeled here as a passive elastic shell surrounding the cytoskeleton and underlying elastic microposts, coated with adhesion proteins and to which the stress fibers can adhere at their end sites [Fig. 6(b)]. The motion of these SFs is therefore directly dictated by the mechanical properties of the pillars, determined by their elastic modulus Ep and geometrical properties via classical Euler-Bernoulli theory [44]:
| (14) |
where h is the pillar height, Ip its moment of inertia, and dp the deflection of its tip. For direct comparisons with experiments, we here model cylindrical microposts of radius r = 1.5 µm (Ip = r4/4) and whose height h can be adjusted to control the effective lateral stiffness. The motion of SFs anchored to the actin cortex similarly follows the displacement of the cortex, as determined by its ability to deform through elastic stretch and bending. Although the cortical membrane is a thin structure that completely surrounds the cell’s body, it is approximated here as one-dimensional elastic element delimiting the cell and providing anchor points to SFs. Its deformation is therefore mainly driven by the contraction of attached SF as described in previous studies [49,50]. For simplicity, we use a small deformation, linear elastic Euler-Bernoulli beam model with elastic modulus Ec = 20 kPa [51,52], such that the governing equations can be written as [53]
| (15) |
| (16) |
where subscripts, x denote a derivative with respect to the linear distance along the cortex. Furthermore, Ac and Ic are the cross-sectional area and moment of inertia of the cortex, u and υ are its axial and transverse displacements, respectively, while q(x,t) is the distributed load arising from the SF anchored on the cortex [Fig. 6(b)]. Following [51,52], the flexural stiffness and stretch stiffness are taken to be 1.42 × 10⁻⁹ dyn cm and Ec = 20 kPa, respectively. In what follows, we use a numerical formulation, based on finite elements and whose details are given in the Appendix, to solve the problem of an adherent cell contracting on a bed of micropost. In agreement with previous models [9,54], we assume that neither deformation (u = 0) nor active stress fibers (η = 0) are observed prior to contraction. Furthermore, since the cell cortex is in its minimum energy state prior the contraction, its initial shape can be approximated as a series of straight lines between the adhesion sites on the boundary. The nonlinear finite element procedure is then used to compute SF shortening and contractile force [from (5) and (6)] in equilibrium with the surrounding pillars and the cortex at all times as the cell contracts. A steady state is eventually obtained when the force f in all cross bridges balances the active force ζ.
FIG. 6.
(a) Schematic of a two-dimensional adherent cell on microposts of length (Lp) within which the contraction of the SF cytoskeleton is balanced with micropost bending (tip deflection Δ) and cortical tension. In the equivalent two-dimensional problem, the anchoring point for SFs is divided into two domains: the tip of microposts Ω1 and the cortical membrane Ω2. (b) The microposts resist SF traction by providing a reaction expressed by (14) while the cortical tension balances these forces through bending as expressed in (15). (c) In its initial state, the cytoskeleton is modeled with an isotropic and random distribution of SF spanning adhesion points and whose length follows an exponential distribution expressed in (13).
A. Cellular scale mechanosensitivity
To assess the global mechanosensitivity of the cytoskeleton, we first numerically reproduce the experimental work described by Tan et al. [44] on smooth muscle cells (BPASMC) in which the cytoskeleton contractility was measured as a function of the overall cell spreading area. For this, our simulations considered square-shaped two-dimensional smooth muscle cells (whose properties are given in Table I) laid on a square lattice of 4, 9, and 16 microposts, respectively. The average contraction force on each pillar was then computed from the micropost deflection [following Eq. (14)]. A nonlinear relationship was reported between average force and cell area as shown by the average and standard deviation plots in Fig. 7(a). In the same figure, we show the simulation results at steady state for the three cells under investigation when an actomyosin slip bond (α⋆ = 0), a moderate and a strong actomyosin catch bond (α⋆ = 1) are considered, respectively. The distribution of active SF and cell deformation are also shown for the three cases, all of them in the case α⋆ = 1. Generally, the results show that, once again, bond catchiness is an important factor to mechanosensitivity and contraction. Indeed, when α⋆ = 0 (slip bond), myosin contraction immediately triggers the detachment of cross bridges, which results in a near-zero net contraction of the cell as a whole. For increasing bond catchiness, however, SF that are locally oriented in directions of large stiffness (between two attachments, for instance) become activated and are able to apply a contractile force. Furthermore, it became clear from the simulations that while all posts are subjected to pulling forces from SFs, only those close to the cell boundary could undergo significant bending. Indeed, forces are unbalanced on these pillars since no SFs can be found on the external side of the cell, a mechanism reminiscent of the concept of surface tension between two fluids with different internal cohesive energies. From this observation, one can deduce that cell contraction increases nonlinearly with area for two main reasons: (a) for a cell undergoing homogeneous contraction, the deflection of external pillars, and thus measured force, is proportional to its distance to the center of the cell (in average) and (b) the effective stiffness felt by a SF increases linearly with distance (and thus cell size) according to Ke = Kℓ/2 (a discussion is provided in the next section). In other words, larger cells behave as if they interacted with a stiffer environment and are thus characterized with a higher contraction [as seen in Fig. 5(c)]. We next evaluate model predictions regarding the transient dynamics response of adherent cells on microposts with varying stiffness. For this, we invoke the experimental work of Trichet et al. [46] who explored the time-dependent contractile response of fibroblast (REF52) cells on pillars with effective bending stiffness 12, 34, 56, and 80 nN/µm, respectively [Fig. 7(b)]. Generally, contractile forces increased monotonically with time, at a decreasing rate until it reached a plateau, which corresponds to the steady state force. Interestingly, while the overall trends to do change with micropost stiffness, the scale of the contractile force does increase significantly with post stiffness. Modeling wise, these experimental conditions were reproduced by considering a square cell laying on four microposts [see Figs. 7(c) and 7(d)] and for which the average post force was computed in time, for the four effective pillar stiffness given above. A comparison of simulations (solid lines) and experimental results (dotted lines) provided for the case of a strong catch bond. One observes a good match between simulations and experiments for strong catch bond since the stabilization of bond with force allows SF to contract faster (since less force is applied on each bond) and harder (since more cross bridges are active) when they interact with stiffer substrates while these trends disappear when slip bonds are considered [as shown in Fig. 5(c)]. This observation was confirmed when we plotted the rate of contraction in terms of substrate stiffness for nonexistent, moderate, and strong catch bonds as shown in Fig. 7(c). One can clearly see that when α⋆ = 0, the cytoskeleton becomes insensitive to the mechanical properties of its substrate.
B. Mechanosensitive organization of the cytoskeleton
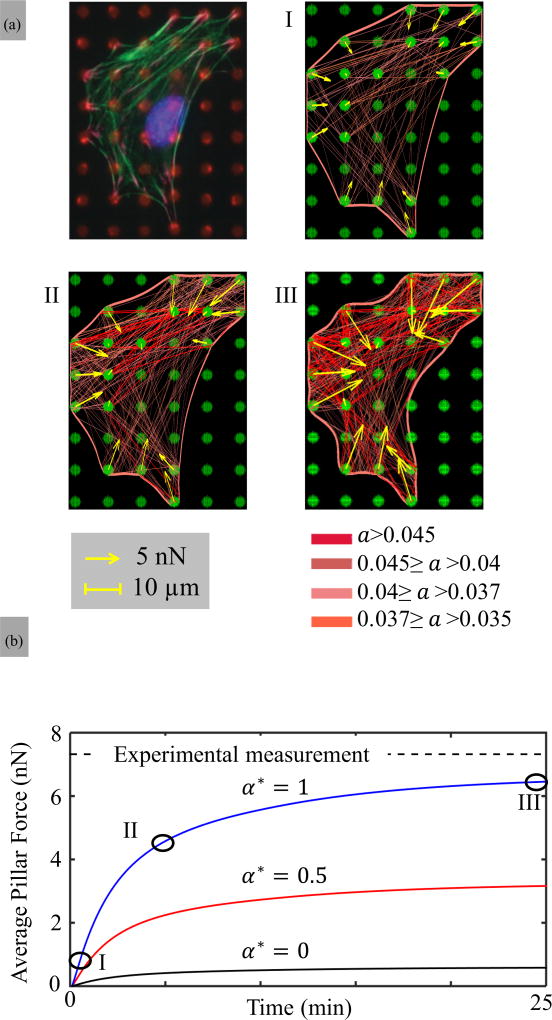
To conclude our study, we finally investigate how the mechanosensitive response of a SF segment as described by Eqs. (5)–(7) can give rise to a complex architecture of the actin cytoskeleton observed in most adherent cells. In this context, we simulate the contraction of a fibroblast cell (NIH/3T3) on soft circular pillars as presented by McGarry and co-workers in [12]. The initial cell geometry and underlying pillars are represented in Fig. 8. This geometry was generated by identifying the microposts located on the cell boundary from the experimental image and assuming that the cortex is described by straight lines between those posts in its unloaded state. For the simulations, the pillar stiffness was taken to be 80 nN/µm and the cytoskeleton contraction was computed until it reached its steady state value (on the order of hundreds of seconds). Figure 8(I–III) depicts the evolution of the stress fiber activation a = η * N(δs)/(NxNy), cortex deformation, and the corresponding overall force per pillar when the strong catch bond hypothesis is used. Surprisingly, one can see that although smaller SF are predominant as dictated by the distribution (13), the first SFs to activate are the longest. To explain this counterintuitive observation, let us consider two similar SFs of different lengths, attached to compliant microposts of stiffness K at their ends. The effective stiffness felt by these SFs is then Ke = F/ε where ε = Δℓ/ℓ is the contractile strain in the SF. For a micropost, the force is related to deflection as F = KΔd with Δℓ = 2Δd and the effective stiffness becomes Ke = Kℓ/2. In other words, longer SFs effectively sense a larger stiffness than their smaller counterparts, which explains their early activation. Eventually, the deflection of microposts and cortex trigger a larger resisting force causing small SFs to increase their activation level as well. These dynamics result in a sharp increase in SF density and micropost forces and a steady increase of the average pillar force in time. We note that as discussed above, the unbalanced forces on boundaries are responsible for the cortex deformation into curved arches [50] and the large micropost deflection on the edge of the cell. On the contrary, interior pillars, being subjected to more isotropic forces, tend to marginally deform. This restricted deformation, in turn, makes interior posts effectively stiffer and prone to adhere to a higher number of SFs. Eventually, the final cytoskeleton organization is strongly dependent on the adhesion pattern, micropost stiffness, as well as the overall morphology of the cell. To probe the effect of bond catchiness, we repeated the same simulation for the moderate catch bond (α⋆ = 0.5) and slip bond (α⋆ = 0) hypotheses. While the former displays similar trends as for a strong catch bond but with a lesser SF activation and force, the slip bond hypothesis showed, as expected, only marginal contraction and a quasinonexistent SF cytoskeleton [Fig. 8(b)].
FIG. 8.
(a) Time sequence of the SF activation a = N(δs)η/(NxNf) of a fibroblast cell (NIH/3T3) on micropost studied by McGarry et al. [12]. The radius, spacing, and stiffness of the microposts are 1.5, 10 µm and 80 nN/µm, respectively. For this simulation, the density of SF anchoring site was chosen to be 8 per µm2 on the pillars and 6 per µm on the cortex, respectively. (b) Corresponding average force per pillar shown as a function of time for three types of actomyosin bonds as characterized by α⋆ ranging from strong catch bond (α⋆ = 1) to slip bond (α⋆ = 0). Circles correspond to time points I, II, and III in (a) while the dashed line shows steady state experimental measurements from [12].
III. CONCLUSION
In summary, the role of catch bonds in cell mechanics is likely to extend far beyond our current knowledge of mechanosensitive membrane adhesion. Here, we presented a model of actomyosin interactions within SF structures that shows that the presence of a catch-bond behavior can explain the activation of the cytoskeleton in response to force and stiffness. The model importantly showed that the consideration of catch bond was enough to explain a number of experimental measurements of cell contractility with stiffness and size, in both the static and dynamic regimes. Although the catch-bond behavior of actomyosin was demonstrated ex vivo [24], the model motivates further experimental studies that can test whether this hypothesis is indeed correct in living systems.
Acknowledgments
The author would like to acknowledge the support of the National Science Foundation under the CAREER Award No. 1350090 and the National Institute of Health under Grant No. 1R01AR065441.
APPENDIX A
NUMERICAL IMPLEMENTATION OF THE MODEL AT THE CELLULAR SCALE
1. Variational formulation
The cell contraction is governed by three equations given in (5), (6), and (7). One can also estimate the degree of inelastic contraction in a SF as
| (A1) |
and ‖d2 − d1‖ = ∫[Δds (t) + Δde]dℓ is the total contraction of a SF calculated from the displacements of its two ends d1 and d2. In the cellular scale model, the total change in energy of the system ℱ̂ is composed of three components: a contribution ℱSF from SFs, a contribution ℰ̇C from the cortex deformation, and, finally, a contribution ℰ̇A from the microposts deformation such that
| (A2) |
where m1 and m2 are the total number of SFs in the cell and number of attached pillars, respectively. The first term is the integration of the free energy of SFs over their respective lengths ℓ, the second term is the integration of the internal energy of cortex over the boundary Γ, while the last corresponds to the bending energy of the microposts. Note that the work done by an external force is comprised in the first term such that it is equal to the integration of the external forces over the cell boundary Γ:
| (A3) |
where fext being the force vector on the cell boundary and d the associated displacement field. The stored elastic (bending) energy in a micropost reads as
| (A4) |
where is the total deflection of the nth micropost which is equal to the resultant of the displacement field and dx, dy are the horizontal and vertical components of the displacement vector (in our predefined orthonormal coordinate system). The work contribution from the cortex finally originates from both axial deformation and bending; assuming that these modes of deformation are uncoupled, one can write :
| (A5) |
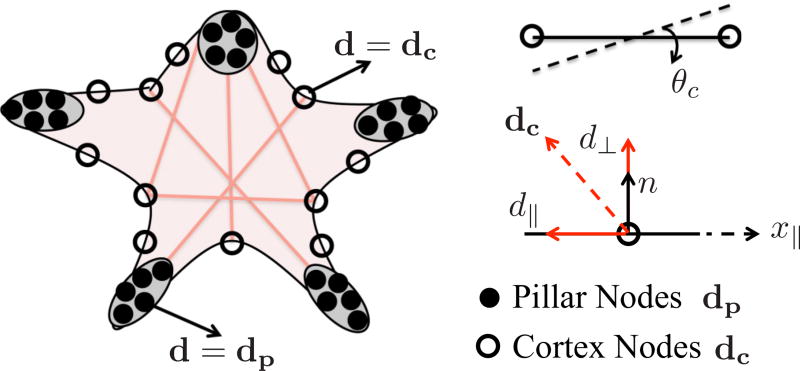
where d‖ = dc · (1 − n) and d⊥ = dc · n are the axial and transverse components of cortex deformation and n is the unit normal of the corresponding cortex segment with a length Lc. The integral of the cell cortex is over its axial direction x‖ (see Fig. 9). Since SF are assumed to not separate from adhesion complexes, the displacement field of the system can be written in terms of those of cortex d = dc and pillars d = dp. Based on variational principles, total work functional can be written as
| (A6) |
FIG. 9.
Schematic of the assembly of the comprising elements: cortex, pillars, and SFs. There are nodes only on the cell boundary, which are shared by either SF cortex or SF pillar coupling.
This ultimately leads to
| (A7) |
| (A8) |
| (A9) |
where the assembly operator 𝒜I establishes the connection between the index of each SF and the index of their connection with the cortex of microposts. This concept is well known in the finite-element literature.
2. Finite-element implementation
In the proposed model, SF reach a pseudoequilibrium state when the variation of the work ℱ̂ is minimized with respect to the field variables comprised of two displacements (dx and dy where ), rotation of the cortex segments θc, activation parameter η, the contraction ds, and its rate υs. Here, we introduced a new variable θc (defined as the first derivative of the transverse displacement with respect to the axial direction θc = ∂d⊥/∂x‖) in order to satisfy the continuity of the cortex deformation. The rotation can be written as tan−1(2d⊥/Lc) for a discrete cortex segment, and assuming that rotations are small θc ≈ (2d⊥/Lc). The balance equations (A7)–(A9) are collected in a residual form as a function of the variables
The linearized form of the system of equations is obtained as follows:
| (A10) |
A numerical solution of this equation is obtained using the finite-element (FE) method. From this viewpoint, we use simple structural elements to model SFs, frame elements to describe the cell cortex [53], and connector elements for the connection between SFs and adhesion sites (to enforce the no separation condition with the penalty method). The equilibrium solution is then found using a standard Newton-Raphson iterative procedure in the form
| (A11) |
where K(x) = ∂R(x)/∂x. Regarding the FE interpolation, we use linear shape functions N for displacement, Hermitian shape functions H for the cortex rotation, and transverse displacement and constant shape functions for both activation and contraction rates as follows:
where N1(ξ) = (1 − ξ)/2, N2(ξ) = (1 + ξ)/2, H1(ξ) = 1 − 3ξ2/l2 + 2ξ3/l3, H2(ξ) = ξ − 2ξ2l + ξ3/l2, H3(ξ) = 3ξ2/l2 − 2ξ3/l3, and H4(ξ) = −ξ2/l + ξ3/l2, ξ being the coordinate in a parametric space comprised between −1 and 1. For the mechanics part of the problem stiffness matrix K takes the form
where
The transformation matrices (T and T̂) from local to global are
where c = cos(θ) and s = sin(θ) For the force-activation coupling the stiffness matrix term is
The stiffness tangent for the activation parameter is
and its coupling with the force on the SF is
And finally the stiffness tangent term for the dissipation is
The final form is
After solving the system of equations, one can calculate the total contraction as
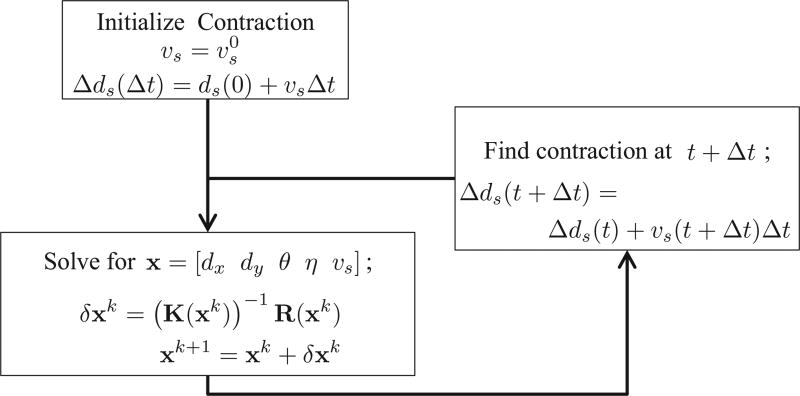
An overview of the computational algorithm in given in Fig. 10.
FIG. 10.
3. Model parameters and differences between nonmuscle myosin and smooth muscle myosin
A summary of the model parameters used in our study is given in Table I. We note here that there exist some significant differences in the properties of myosin heads based on their types.
Kinetics
In the literature, it is reported that the sliding velocity of myosin heads ranges from 0.05 [55,56] to 2 µm/s [34] in nonmuscle myosin II and from 0.3 [57] to 0.8 µm/s [58] for smooth muscle myosin. In this study, we have only investigated the dynamical behavior of NMM [Figs. 7(c) and 7(d) and 8] for which a sliding velocity υ = 1 µm/s was selected consistent with experimental measurements in fibroblasts [34]. We note here that results on smooth muscle cells presented in Figs. 7(a) and 7(b) are at steady state and thus independent of the chosen value of sliding velocity. Nevertheless, for those cells, our model would predict contraction-time relationships that are similar to those presented in Fig. 7(c) but characterized by different time scales (due to differences in sliding velocities [34,56,59]).
Mechanical properties
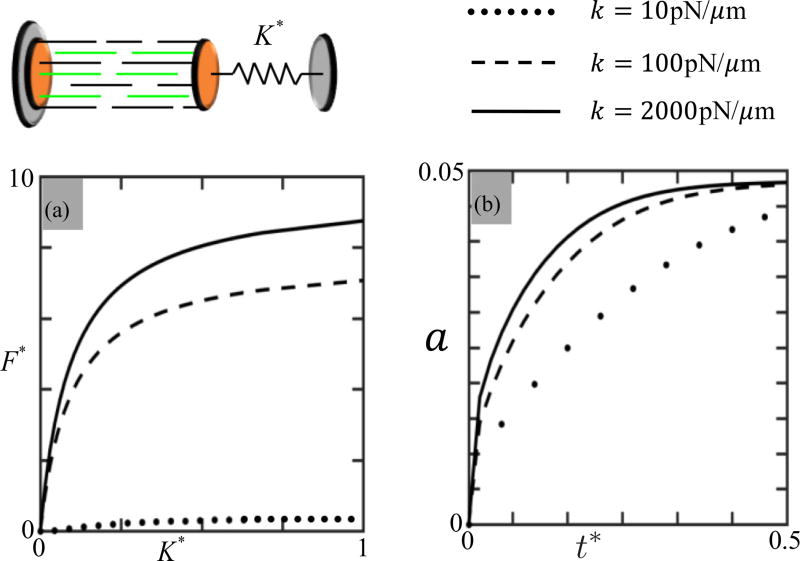
Regarding the mechanical properties, cross-bridge stiffness for the skeletal muscle cells ranges from 130 [60] to 2400 pN/µm [61–63]. In the literature, there is a lack of data about the actomyosin bond stiffness for the smooth muscle and nonmuscle cells investigated in this paper. In order to be consistent with previous studies [32,33], we, however, chose this stiffness to be 600 pN/µm throughout the investigation of cellular mechanosensitivity. Although our selection may be inaccurate in certain cases, we note from Fig. 11(b) that the effect of cross-bridge stiffness on the rate of contractile force is insignificant.
FIG. 11.
Parametric study of actomyosin bond stiffness (k = 10, 100, and 2000 pN/µm) using the control segment connected to a linear spring. (a) Normalized contractile force F* = F/ζ as a function of normalized external stiffness K* = K/2000. One sees that the stiffness sensing ability of the SFs increases with bond stiffness k. (b) Activation parameter a versus time for K* = 0.5. The rate of cross-bridge activation also increases with bond stiffness k.
Catch-bond properties
We used the catch-bond data of skeletal muscle cells due to the lack of experimental data for both nonmuscle and smooth muscle cells. Our choice for the critical force (fc) of 6 pN, however, does not affect the trends of the catch-bond behavior. This choice would only change the maximum load that a SF can carry and would change the SF density at the cellular level. As the critical force fc reduces, the SF density in the cell should increase in order to match experimental data [46].
4. Effect of actomyosin bond stiffness on mechanosensing
The reported data on the actomyosin bond stiffness is limited to skeletal muscle cells from different animals (rabbit and frog). It is furthermore very scattered; for instance, measured values for rabbit skeletal muscle cells range from 130 pN/µm [60] to 1700 ± 700 pN/µm [61,62], while it has been estimated to be between 1000–2200 pN/µm [63] for frog. Because of this variability, we propose here to perform a parametric study to better understand the effect of bond stiffness k on mechanosensitivity and contraction dynamics, as predicted by the model in the case of a strong catch bond (α* = 1). We chose three stiffness values k = 10, 100, 2000 pN/µm and investigated the SF response under the virtual experimental setup presented in Fig. 5. In the results reported in Fig. 11, one sees that actomyosin bond stiffness affects both the SF sensitivity to external stiffness and the rate of SF activation. Figure 11(a) indeed shows that the contractile force of the SF becomes weaker as k decreases, such that when k = 10 pN/µm, a quasi-inexistent contraction is observed. This follows from the fact that highly compliant cross bridges can only apply little force even in the case of large contraction strains. Figure 11 b further shows that the rate of SF activation a increases with bond stiffness. However, regardless of bond stiffness, we observed that the key trends exhibited by the model are always consistent both at the SF and at the cellular levels. In other words, bond stiffness and SF density can always be adjusted accordingly to match model predictions and experimental measurements at the cellular level, without modifying the trends shown in this paper. This motivated our choice of fixed value k = 600 pN/µm for our simulations.
References
- 1.Baxter SC, Morales MO, Goldsmith EC. Cell Biochem. Biophys. 2008;51:33. doi: 10.1007/s12013-008-9013-8. [DOI] [PMC free article] [PubMed] [Google Scholar]
- 2.Bischofs IB, Schwarz US. Proc. Natl. Acad. Sci. USA. 2003;100:9274. doi: 10.1073/pnas.1233544100. [DOI] [PMC free article] [PubMed] [Google Scholar]
- 3.Discher DE, Janmey P, li Wang Y. Science. 2005;310:1139. doi: 10.1126/science.1116995. [DOI] [PubMed] [Google Scholar]
- 4.Schwarz US, Bischofs IB. Med. Eng. Phys. 2005;27:763. doi: 10.1016/j.medengphy.2005.04.007. [DOI] [PubMed] [Google Scholar]
- 5.Fernandez P, Bausch AR. Integrat. Biol. 2009;1:252. doi: 10.1039/b822897c. [DOI] [PubMed] [Google Scholar]
- 6.Freyman TM, Yannas IV, Yokoo R, Gibson LJ. Biomaterials. 2001;22:2883. doi: 10.1016/s0142-9612(01)00034-5. [DOI] [PubMed] [Google Scholar]
- 7.Wang HB, Dembo M, Wang Y. Am. J. Physiol. Cell Physiol. 2000;279:C1345. doi: 10.1152/ajpcell.2000.279.5.C1345. [DOI] [PubMed] [Google Scholar]
- 8.Solon J, Levental I, Sengupta K, Georges PC, Janmey P. Biophys. J. 2007;93:4453. doi: 10.1529/biophysj.106.101386. [DOI] [PMC free article] [PubMed] [Google Scholar]
- 9.Vernerey F, Farsad M. J. Math. Biol. 2013;68:989. doi: 10.1007/s00285-013-0656-8. [DOI] [PMC free article] [PubMed] [Google Scholar]
- 10.Schwarz US, Safran SA. Phys. Rev. Lett. 2002;88:048102. doi: 10.1103/PhysRevLett.88.048102. [DOI] [PubMed] [Google Scholar]
- 11.Bischofs IB, Safran SA, Schwarz US. Phys. Rev. E. 2004;69:021911. doi: 10.1103/PhysRevE.69.021911. [DOI] [PubMed] [Google Scholar]
- 12.McGarry JP, Fu J, Yang MT, Chen CS, McMeeking RM, Evans AG, Deshpande VS. Philos. Trans. R. Soc. London A. 2009;367:3477. doi: 10.1098/rsta.2009.0097. [DOI] [PMC free article] [PubMed] [Google Scholar]
- 13.Foucard L, Vernerey F. Appl. Phys. Lett. 2011;100:013702. doi: 10.1063/1.3673551. [DOI] [PMC free article] [PubMed] [Google Scholar]
- 14.Vernerey FJ, Farsad M. J. Mech. Behav. Biomed. Mater. 2011;4:1683. doi: 10.1016/j.jmbbm.2011.05.022. [DOI] [PubMed] [Google Scholar]
- 15.Deshpande VS, McMeeking RM, Evans AG. Proc. Natl. Acad. Sci. USA. 2006;103:14015. doi: 10.1073/pnas.0605837103. [DOI] [PMC free article] [PubMed] [Google Scholar]
- 16.Huxley AF. Muscle Structure and Theories of Contraction. In: Butler JV, Katz B, editors. Progress in Biophysics and Biophysical Chemistry. Vol. 7. Pergamon Press; London: 1957. pp. 255–318. [PubMed] [Google Scholar]
- 17.Kaunas R, Hsu H, Deguchi S. Cell Health Cytoskel. 2011;3:13. [Google Scholar]
- 18.Schwarz US, Safran SA. Rev. Mod. Phys. 2013;85:1327. [Google Scholar]
- 19.Marshall BT, Long M, Piper JW, Yago T, McEver RP, ZhuD C. Lett. Nature. 2003;423:190. doi: 10.1038/nature01605. [DOI] [PubMed] [Google Scholar]
- 20.Novikova E, Storm C. Biophys. J. 2013;105:1336. doi: 10.1016/j.bpj.2013.07.039. [DOI] [PMC free article] [PubMed] [Google Scholar]
- 21.Bell GI. Science. 1978;200:618. doi: 10.1126/science.347575. [DOI] [PubMed] [Google Scholar]
- 22.Thomas WE, Vogel V, Sokurenko E. Annu. Rev. Biophys. 2008;37:399. doi: 10.1146/annurev.biophys.37.032807.125804. [DOI] [PubMed] [Google Scholar]
- 23.Thomas W. Annu. Rev. Biomed. Eng. 2008;10:39. doi: 10.1146/annurev.bioeng.10.061807.160427. [DOI] [PubMed] [Google Scholar]
- 24.Guo B, Guilford WH. Proc. Natl. Acad. Sci. USA. 2006;103:9844. doi: 10.1073/pnas.0601255103. [DOI] [PMC free article] [PubMed] [Google Scholar]
- 25.Capitanio M, Canepari M, Maffei M, Beneventi D, Monico M, Vanzi F, Bottinelli R, Pavone F. Nat. Methods. 2012;9:1013. doi: 10.1038/nmeth.2152. [DOI] [PubMed] [Google Scholar]
- 26.Reconditi M, Linari M, Lucii L, Stewart A, Sun Y, Boesecke P, Narayanan T, Fischetti R, Irving T, Piazzesi G, Irving M, Lombardi V. Nature (London) 2004;428:578. doi: 10.1038/nature02380. [DOI] [PubMed] [Google Scholar]
- 27.Langanger G, Moeremans M, Daneels G, Sobieszek A, Brabander MD, Mey JD. J. Cell Biol. 1986;102:200. doi: 10.1083/jcb.102.1.200. [DOI] [PMC free article] [PubMed] [Google Scholar]
- 28.Evans E. Annu. Rev. Biophys. Biomol. Struct. 2001;30:105. doi: 10.1146/annurev.biophys.30.1.105. [DOI] [PubMed] [Google Scholar]
- 29.Pellegrin S, Mellor H. J. Cell Sci. 2007;120:3491. doi: 10.1242/jcs.018473. [DOI] [PubMed] [Google Scholar]
- 30.Tojkander S, Gateva G, Lappalainen P. J. Cell Sci. 2012;125:1855. doi: 10.1242/jcs.098087. [DOI] [PubMed] [Google Scholar]
- 31.Chaen S, Inoque J, Sugi H. J. Exper. Biol. 1995;198:1021. doi: 10.1242/jeb.198.4.1021. [DOI] [PubMed] [Google Scholar]
- 32.Fernández P, Pullarkat PA, Ott A. Biophys. J. 2006;90:3796. doi: 10.1529/biophysj.105.072215. [DOI] [PMC free article] [PubMed] [Google Scholar]
- 33.Howard J. In: Mechanics of Motor Proteins. Flyvbjerg F, Julicher F, Ormos P, David F, editors. Vol. 75. Springer; Berlin: 2002. [Google Scholar]
- 34.Katoh K, Kano Y, Masuda M, Onishi H, Fujiwara K. Mol. Biol. Cell. 1998;9:1919. doi: 10.1091/mbc.9.7.1919. [DOI] [PMC free article] [PubMed] [Google Scholar]
- 35.Gordon AM, Huxley AF, Julian F. J. Physiol. 1966;184:170. doi: 10.1113/jphysiol.1966.sp007909. [DOI] [PMC free article] [PubMed] [Google Scholar]
- 36.Hai CM, Murphy RA. Am. J. Physiol. 1988;254:C99. doi: 10.1152/ajpcell.1988.254.1.C99. [DOI] [PubMed] [Google Scholar]
- 37.Brook B, Jensen O. Math. Med. Biol. 2014;31:99. doi: 10.1093/imammb/dqs031. [DOI] [PMC free article] [PubMed] [Google Scholar]
- 38.Dong C, Chen B. Sci. Rep. 2016;6:19506. doi: 10.1038/srep19506. [DOI] [PMC free article] [PubMed] [Google Scholar]
- 39.Chen B. J. Appl. Mech. 2013;80:1. doi: 10.1115/1.4006947. [DOI] [PMC free article] [PubMed] [Google Scholar]
- 40.Julicher F, Kruse K, Prost J, Joanny J. Phys. Rep. 2007;449:3. [Google Scholar]
- 41.Hill A. Proc. R. Soc. London, Ser. B. 1938;126:136. [Google Scholar]
- 42.Pereverzev YV, Prezhdo OV. Phys. Rev. E. 2006;73:050902. doi: 10.1103/PhysRevE.73.050902. [DOI] [PubMed] [Google Scholar]
- 43.Chakrabarti B, Benguigui LG. Statistical Physics of Fracture and Breakdown in Disordered Systems. Clarendon Press; Oxford: 1997. [Google Scholar]
- 44.Tan JL, Tien J, Pirone DM, Gray DS, Bhadriraju K, Chen CS. Proc. Natl. Acad. Sci. USA. 2002;100:1484. doi: 10.1073/pnas.0235407100. [DOI] [PMC free article] [PubMed] [Google Scholar]
- 45.Ghibaudo M, Saez A, Trichet L, Xayaphoummine A, Browaeys J, Silberzan P, Buguin A, Ladoux B. Soft Matter. 2008;4:1836. [Google Scholar]
- 46.Trichet L, LeDigabel J, Hawkins RJ, Vedula SRK, Gupta M, Ribrault C, Hersen P, Voituriez R, Ladoux B. Proc. Natl. Acad. Sci. USA. 2012;109:6933. doi: 10.1073/pnas.1117810109. [DOI] [PMC free article] [PubMed] [Google Scholar]
- 47.Walcott S, Sun SX. Proc. Natl. Acad. Sci. USA. 2009;107:7757. doi: 10.1073/pnas.0912739107. [DOI] [PMC free article] [PubMed] [Google Scholar]
- 48.Thery M, Pepin A, Dressaire E, Chen Y, Bornens M. Cell Motil. Cytoskel. 2006;63:341. doi: 10.1002/cm.20126. [DOI] [PubMed] [Google Scholar]
- 49.Bischofs I, Klein F, Lehnert D, Bastmeyer M, Schwarz U. Biophys. J. 2008;95:3488. doi: 10.1529/biophysj.108.134296. [DOI] [PMC free article] [PubMed] [Google Scholar]
- 50.Vernerey F, Farsad M. Comput. Methods Biomech. Biomed. Eng. 2011;14:433. doi: 10.1080/10255842.2010.531273. [DOI] [PubMed] [Google Scholar]
- 51.Dailey H, Ricles LM, Yalcin HC, Ghadiali SN. J. Appl. Physiol. 2008;106:221. doi: 10.1152/japplphysiol.90688.2008. [DOI] [PubMed] [Google Scholar]
- 52.Vargas-Pinto R, Gong H, Vahabikashi A, Johnson M. Biophys. J. 2013;105:300. doi: 10.1016/j.bpj.2013.05.034. [DOI] [PMC free article] [PubMed] [Google Scholar]
- 53.Kwon YW, Bang H. The Finite Element Method Using MATLAB. CRC Press; Boca Raton, FL: 2000. [Google Scholar]
- 54.Dowling EP, Ronan W, Ofek G, Deshpande VS, McMeeking RM, Athanasiou KA, McGarry JP. J. R. Soc. Interface. 2012;9:3469. doi: 10.1098/rsif.2012.0428. [DOI] [PMC free article] [PubMed] [Google Scholar]
- 55.Kim K-Y, Kovács M, Kawamoto S, Sellers JR, Adelstein RS. J. Biol. Chem. 2005;280:22769. doi: 10.1074/jbc.M503488200. [DOI] [PubMed] [Google Scholar]
- 56.Wang F, Kovacs M, Hu A, Limouze J, Harvey EV, Sellers JR. J. Biol. Chem. 2003;278:27439. doi: 10.1074/jbc.M302510200. [DOI] [PubMed] [Google Scholar]
- 57.Warshaw DM, Desrosiers JM, Work SS, Trybus KM. J. Cell Biol. 1990;111:453. doi: 10.1083/jcb.111.2.453. [DOI] [PMC free article] [PubMed] [Google Scholar]
- 58.Harris DE, Work SS, Wright RK, Alpert NR, Warshaw DM. J. Muscle Res. Cell Motil. 1994;15:11. doi: 10.1007/BF00123828. [DOI] [PubMed] [Google Scholar]
- 59.Cuda G, Pate E, Cooke R, Sellers JR. Biophys. J. 1997;72:1767. doi: 10.1016/S0006-3495(97)78823-4. [DOI] [PMC free article] [PubMed] [Google Scholar]
- 60.Molloy JE, Burns JE, Sparrow JC, Tregear RT, Kendrick-Jones J, White DC. Biophys. J. 1995;68:298S. [PMC free article] [PubMed] [Google Scholar]
- 61.Linari M, Caremani M, Piperio C, Brandt P, Lombardi V. Biophys. J. 2007;92:2476. doi: 10.1529/biophysj.106.099549. [DOI] [PMC free article] [PubMed] [Google Scholar]
- 62.Lewalle A, Steffen W, Stevenson O, Ouyang Z, Sleep J. Biophys. J. 2008;94:2160. doi: 10.1529/biophysj.107.119396. [DOI] [PMC free article] [PubMed] [Google Scholar]
- 63.Barclay CJ. J. Muscle Res. Cell Motil. 1998;19:855. doi: 10.1023/a:1005409708838. [DOI] [PubMed] [Google Scholar]


