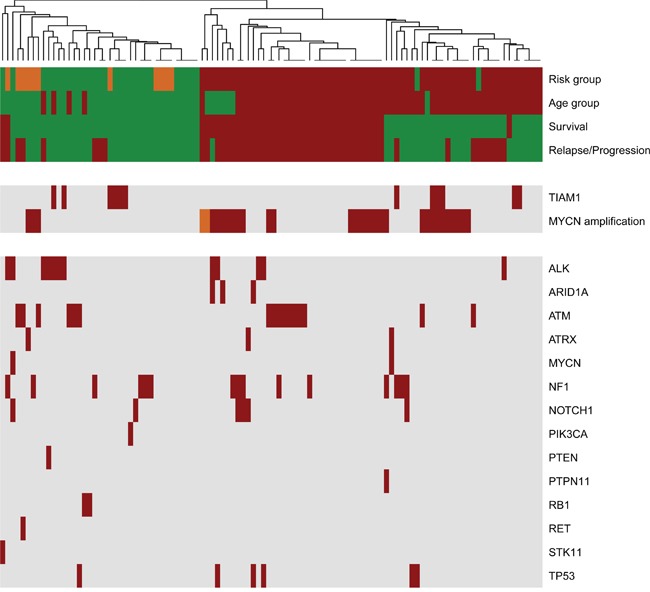
Figure 2. Landscape of clinical variations and identified genetic variants in primary neuroblastomas.

The heatmap was clustered based on Manhattan distances between cases. Distances were estimated with clinical data and identified variants with NB-panel in 106 primary neuroblastomas and using the Average-Method. Each column summarizes one patient. Each row represents the indicated clinical variable (clustered on the upper rows) or genetic variations (clustered in two groups to highlight those cases with TIAM1 variants and/or MYCN amplification). Risk group (green, low and intermediate risk; red, high risk; orange, stage 4S); Age group (green, <18 months; red, >18 months); Survival (green, alive; red, death), Relapse/Progression (green, disease-free; red, event of progression or relapse); MYCN amplification (green, no amplification; red, amplification; orange, heterogenic amplification); Genes (red, variant found; grey, no variant detected).
