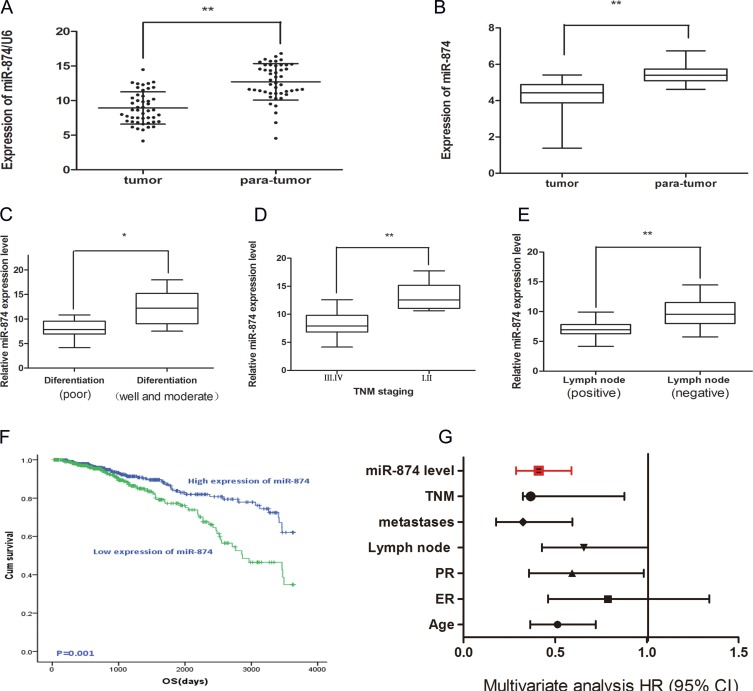
Figure 1.
(A) Real time-PCR demonstrated miR-874 expression in 47 patients with breast cancer compared with matched para-normal tissues. Symbol (**) means a significant difference at P < 0.01. (B) The expression of miR-874 in breast cancer tissues compared with para-normal tissues from external breast cancer cohort in TCGA database. (C) miR-874 expression in moderately and well differentiation tissues as well as tissues with poor differentiation. (D) miR-874 expression in I of TNM staging compared with II or III of TNM staging. (E) miR-874 expression in negative lymph node metastasis tissues compared to positive lymph node metastasis tissues. (F) The high and low miR-874 expression groups of OS were depicted using the Kaplan-Meier. (G) The multivariate analysis of the HRs by Cox multivariate proportional hazard regression model.

